Square
Following
Hot
News
Notifications
Profile
Share your thoughts
placeholder
Article
#BTCBackAbove80K
#ShareWeekly

Bitcoin's return above $ 80 000 has once again caught my attention. I am watching this move and see not just another price recovery, but an important moment for assessing the behavior of buyers and sellers. After a difficult period, BTC is once again trying to regain the trust of market participants. But I am in no hurry to call this the start of a new bull trend. One strong green move does not change the overall picture. For me, what happens after the return to the psychological $ 80 000 mark is much more important. The price reaction at key levels often says
BTC-0.67%
  • 2
$BTC is still churning along the upper boundary of the bull flag, without managing a decisive, high-volume breakout to the upside. The biggest mistake at this level is rushing in for fear of missing out—the truly prudent approach is to wait for price to decisively break above the upper boundary and then confirm it can hold on a retest before considering moving your stop-loss higher. Until then, patiently waiting for a pullback to enter long is the better play. First, watch the support around 79000; support near 77388 is more solid, while 74800 is the key floor for this structure. A break belo
post-image
BTC-0.67%
Trenches
ZIG
Z
bade
b
ZIG
0x8c...1145
Market Cap
$.
Change
.
24h Vol
$.
Holders
.
BTC
B
bade
b
BTC
C5xp...pump
Market Cap
$.
Change
.
24h Vol
$.
Holders
.
HIGH
H
bade
b
HIGH
7ymF...high
Market Cap
$.
Change
.
24h Vol
$.
Holders
.
STONK
S
bade
b
STONK
6GmA...UNgx
Market Cap
$.
Change
.
24h Vol
$.
Holders
.
CORLA
C
bade
b
CORLA
0xba...7777
Market Cap
$.
Change
.
24h Vol
$.
Holders
.
#Share My Holding Returns#
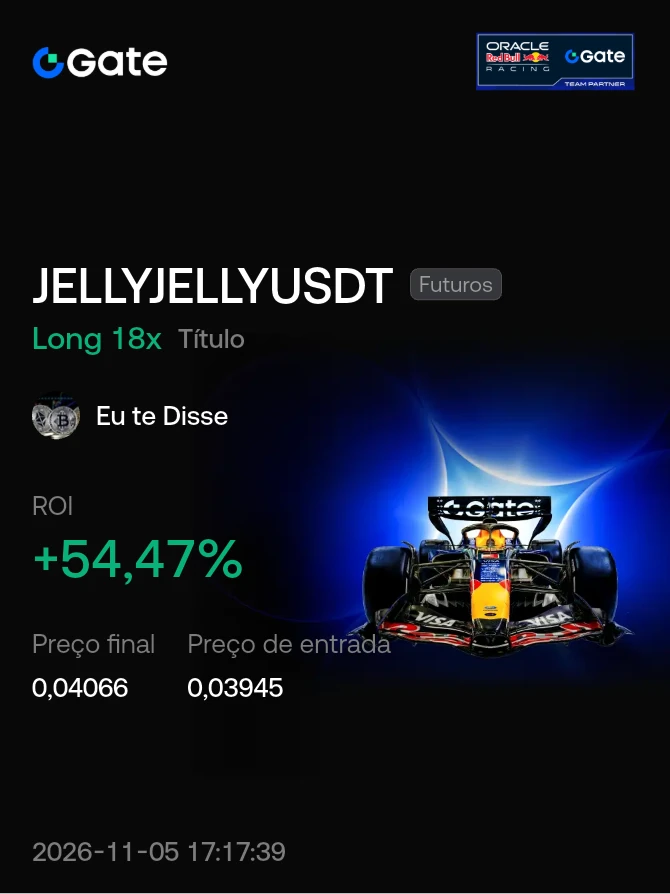
With liquidation at $0.032, would I have anything to worry about with this JELLYJELLY meme?
Let the market maker answer that 👀
post-image
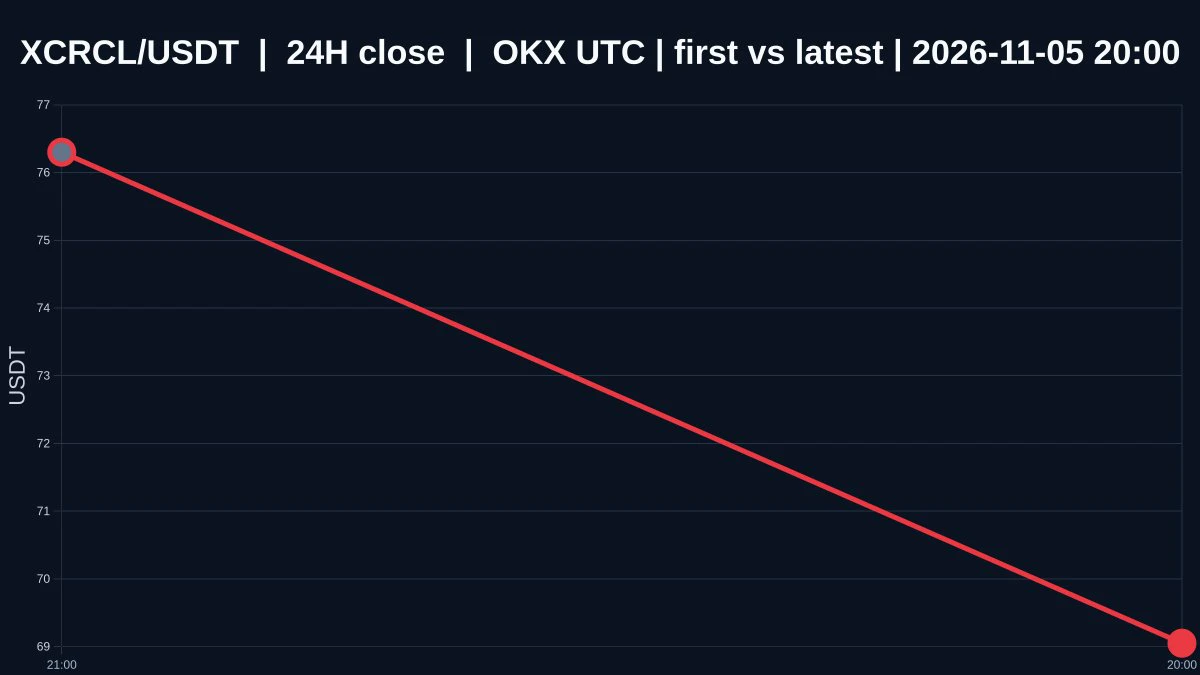
$XCRCL Falls to 69.15; Oversold Does Not Automatically Mean a Bottom Is In
$XCRCL is currently priced at 69.15, down 9.702272133716361% over 24 hours, with an intraday range of 65.34 to 77.33. The 1-hour and 4-hour trends are both weak, and the 1-hour volume ratio is 0.0006001285474826546. The price has fallen to this level, and short-term oversold conditions are building, but the structure has not stopped weakening. I would not equate oversold with a bottom.

Oversold describes a price that has fallen enough over a short period. A bottom describes selling pressure genuinely drying up and buye
post-image
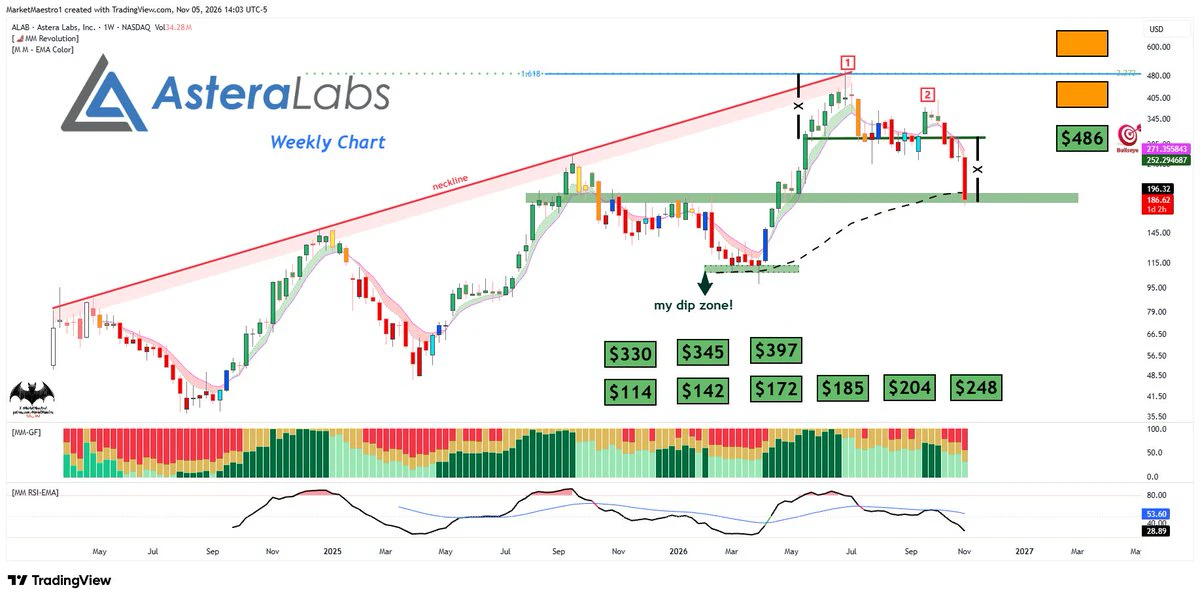
$ALAB
After the double top, it dropped to its target price. The current price is at the same level as both the tariff crash low and the March low
post-image
ALAB-19.76%
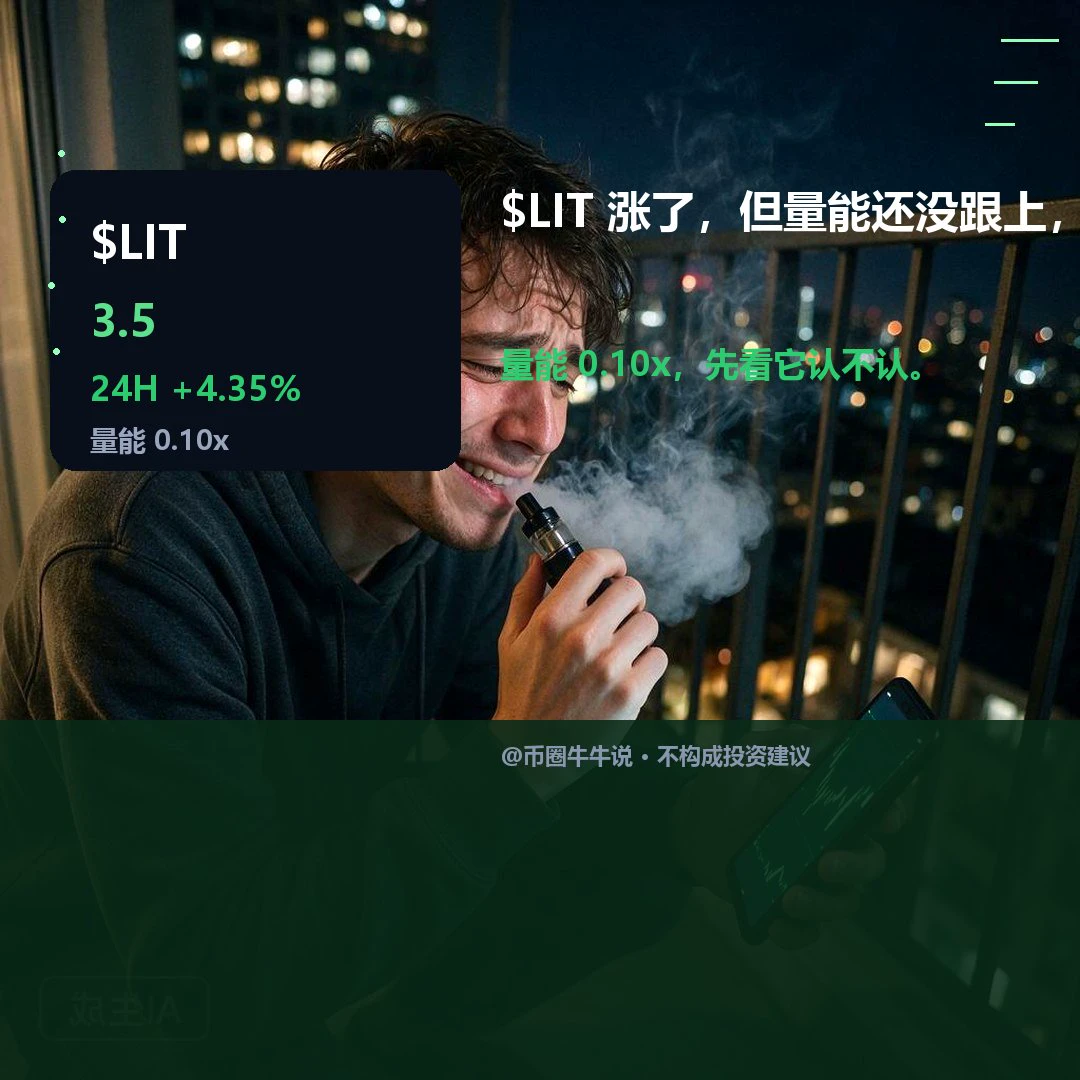
$LIT Currently at 3.5014, 24H +4.35% (3.228–3.5308). 1H bias is strong: RSI 50.47, price is above EMA20 at 3.4123; 4H bias is strong: RSI 53.51, price is above EMA20 at 3.3384. 1H volume ratio is 0.10. If price holds above the 3.5308 resistance, watch for continuation; if it breaks below the 3.228 support, the short-term outlook weakens. Review later whether price can hold above 3.5308 and recover after losing 3.228; volume is only 0.10x average, so a single move across the level still needs confirmation from participation. A break below that cannot be recovered would invalidate the setup. Mar
post-image
LIT-4.56%
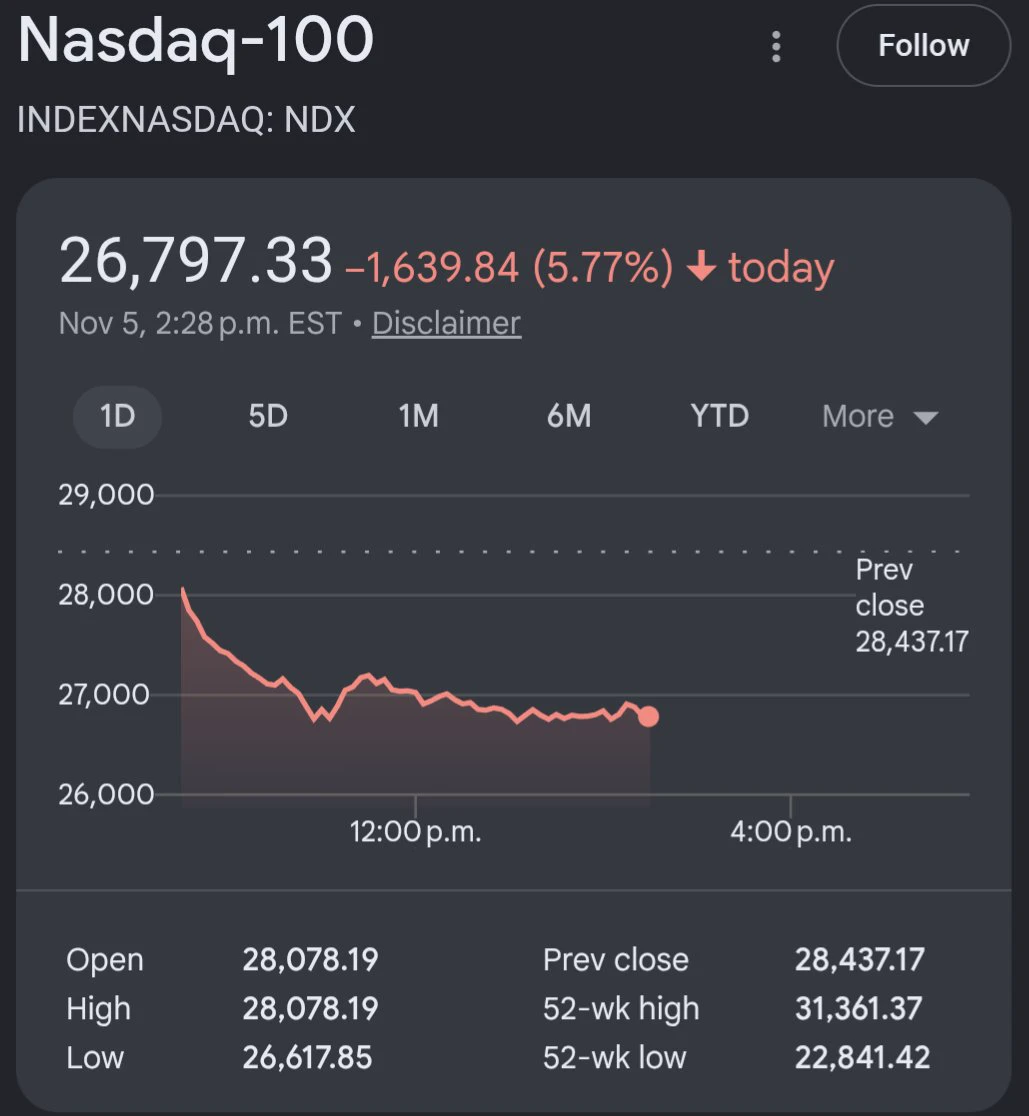
🛑🛑 Thursday's CRASH is here... Today, global stock markets lost more than $3.7 trillion... 🇺🇸 U.S. stocks fell 4%, wiping out $3 trillion. 🇰🇷 South Korea's KOSPI plunged 5.2%, wiping out $200 billion. 🇨🇳 Taiwan's stock market plunged 5%, wiping out $180 billion. 🇯🇵 The Nikkei fell 2.13%, wiping out $162 billion. In addition, the crypto market lost $140 billion, completely erasing yesterday's gains. But what's shocking is that despite the crypto industry's size being only one-tenth to one-fiftieth that of the stock market, its decline was smaller than the Nasdaq's. This is a sign of s
post-image
ZEC+1.16%
ETH Technical Outlook: Ethereum Tests Critical Support as Bearish Pressure Remains

Ethereum is trading around $2,265–$2,267, testing the 0.236 Fibonacci level near $2,265.68 after pulling back from its recent recovery high around $2,358–$2,385.

The latest daily chart shows ETH trading below all four major EMAs. Although RSI has started to recover, the broader structure remains under pressure. Holding the $2,241–$2,265 support area is important for preventing another move lower.

EMA Structure

ETH is currently trading below all four major moving averages:

- 20 EMA: $2,349.35
- 50 EMA: $2,40
ETH-1.26%
  • 1
$ETH Ready for a rebound? Bulls are once again targeting 2365. Long entry plan: 2255 - 2265; Take-profit 1: 2300; Take-profit 2: 2330; Final target: 2365; Stop-loss: 2200. ETH faced strong selling pressure near 2450, but buyers are trying to push the price back up around 2250. As long as the 2200 support holds, I remain bullish on a rebound to 2300 – 2365. If the price breaks below 2200, this plan will weaken. Bulls still have hope... Let's see if buyers can take control again. Trade ID: $ETH
post-image
ETH-1.26%
Analysis new crypto coin
live-cover
LIVE2,227
Crypto investors often focus on the candlestick patterns on their screens. But have you ever considered the invisible hand that moves those candles?

Sometimes, the source of the biggest market movement isn't hidden in the Bitcoin chart or the news feed of an altcoin. The real scenario is often written in the shadow of macroeconomic labels. Right now, we're looking at one of those shadows: the Dollar Index (DXY).

The data on the chart is quite clear: the DXY is at 101.62 today, with a modest increase of 0.09%. However, this small green candle shouldn't mislead investor psychology. Because the
post-image
BTC-0.67%
ETH-1.26%
XAU+0.38%
XAG+0.47%
NAS100-6.65%
  • 7
Guys, don't miss this drop. Open a quick short (sell) position on $MAGMA now 🐳🔥🎯 Target: 0.2780
post-image
MAGMA-0.57%
#StockTalkSeason
Bitcoin (BTC) Price Analysis – November 5, 2026

Short-term bearish pressure

Bitcoin is experiencing significant volatility after the recent US midterm elections. The price briefly recovered above $80,000 but struggled to maintain that level, showing that selling pressure remains strong.

Current market situation

* BTC price: Around $77,400–$79,500, depending on the data provider and update time.

* 24-hour movement: Negative overall.

* Market sentiment: Cautious.

* Main resistance: $80,000–$82,000.

* Important support: $77,000, followed by $75,000–$75,600. Live Chart +
post-image
NVDA-9.13%
  • 1
$ZEC Seriously, I’m fed up. Market makers, can you stop bouncing already? The broader market has fallen below 7.6, and you’re still stubbornly holding the line. Hurry up and dump it so I can get a chance to escape. I’ve been trapped for a full three months, and I’m about to lose it. Every time, you’re the one that rebounds the hardest and fastest. Can’t you have one brutal crash for once? Risk warning: The above is merely a personal, emotional rant and does not constitute investment advice. Contract trading carries extremely high risks, so please proceed with caution.
post-image
ZEC+1.16%
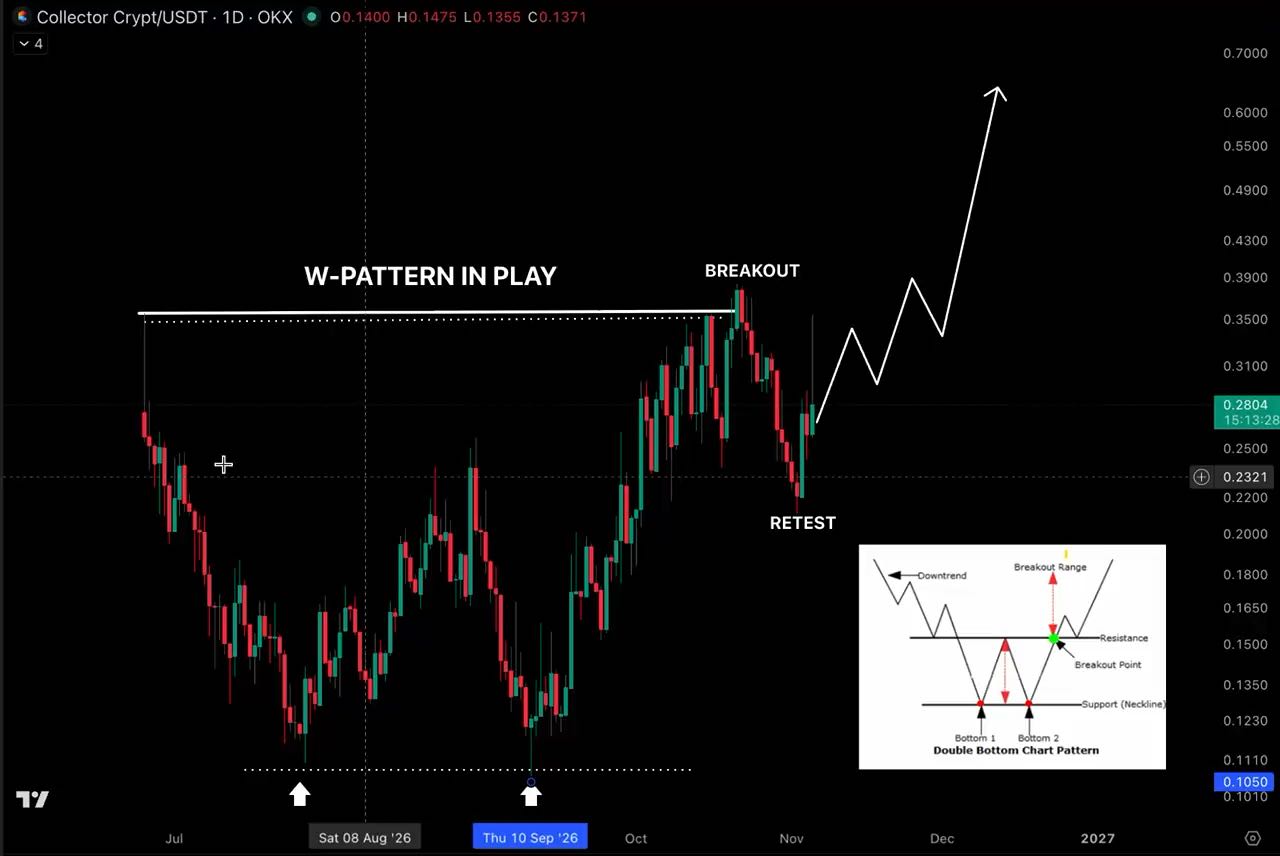
COLLECTOR $CARDS to $0.60?

that’s the bullish path i’m watching rn tbh

this W-pattern has broken out, price has pulled back to retest, and we’re now looking for continuation.

there’s still work to do, but the structure is getting interesting.

either this chart rewards patience or humbles us publicly

no in-between
CARDS-6.47%
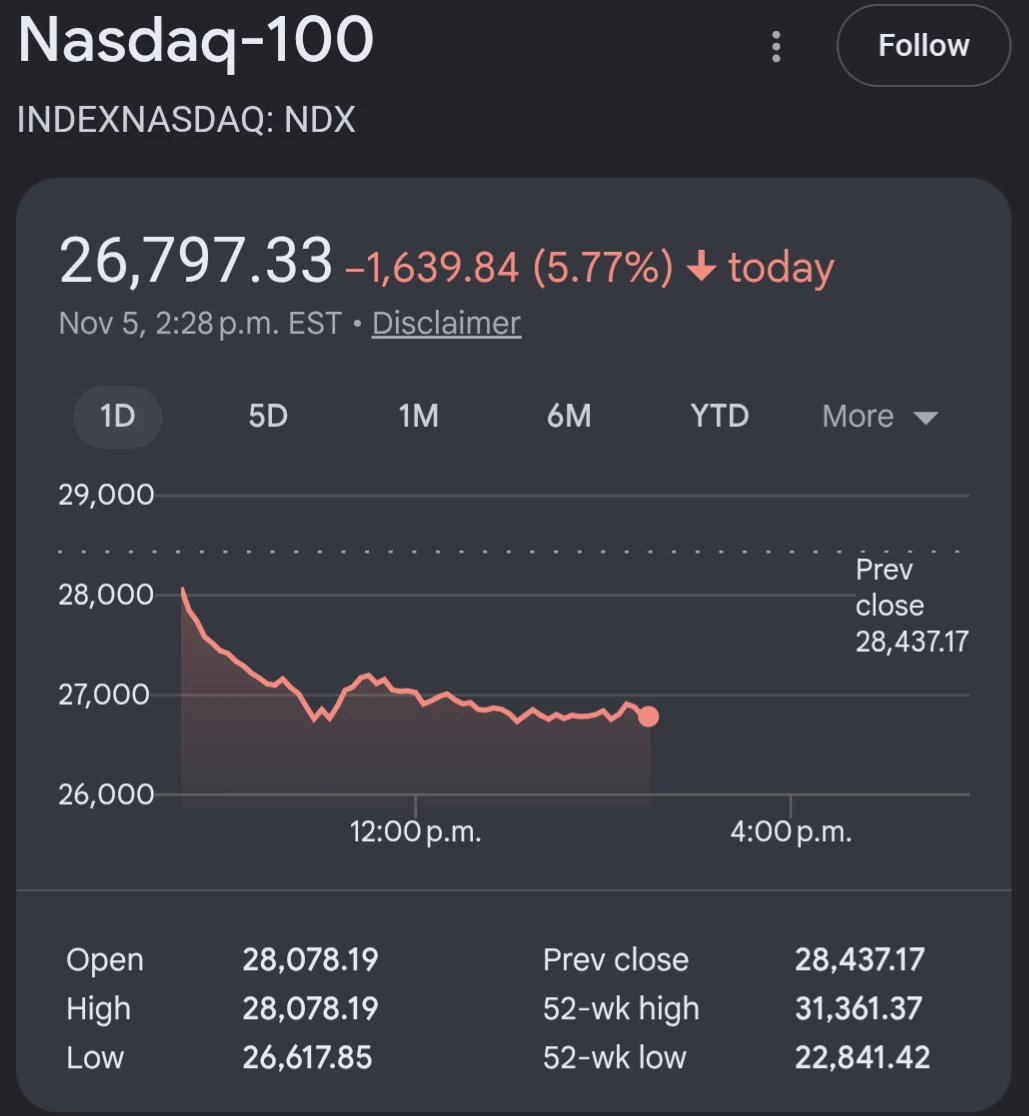
OMG...
The market is crashing.
post-image
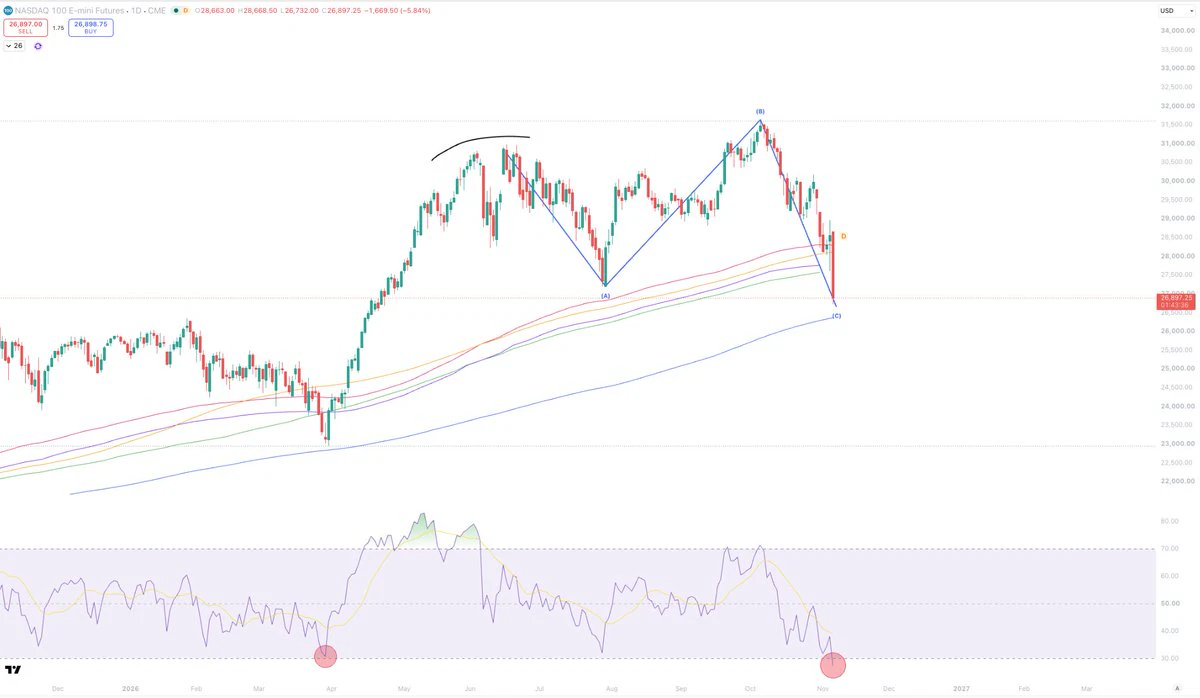
I think you could bid this Nasdaq nuke pretty comfortably.
Scary headlines out there but this looks like a pretty textbook expanded flat.
The VIX up 64% today which historically a buy signal.
And the lowest Daily RSI reading in 17 months.
These kinds of RSI readings are very uncommon in equities.
post-image
NDAQ-2.63%
The market is crashing today, because the Democrats won in the midterm. And the expectationare that they will slow down AI infrastructure projects.
Our civilization is shooting itself in the leg.
We need a backup in space... Fast.
post-image
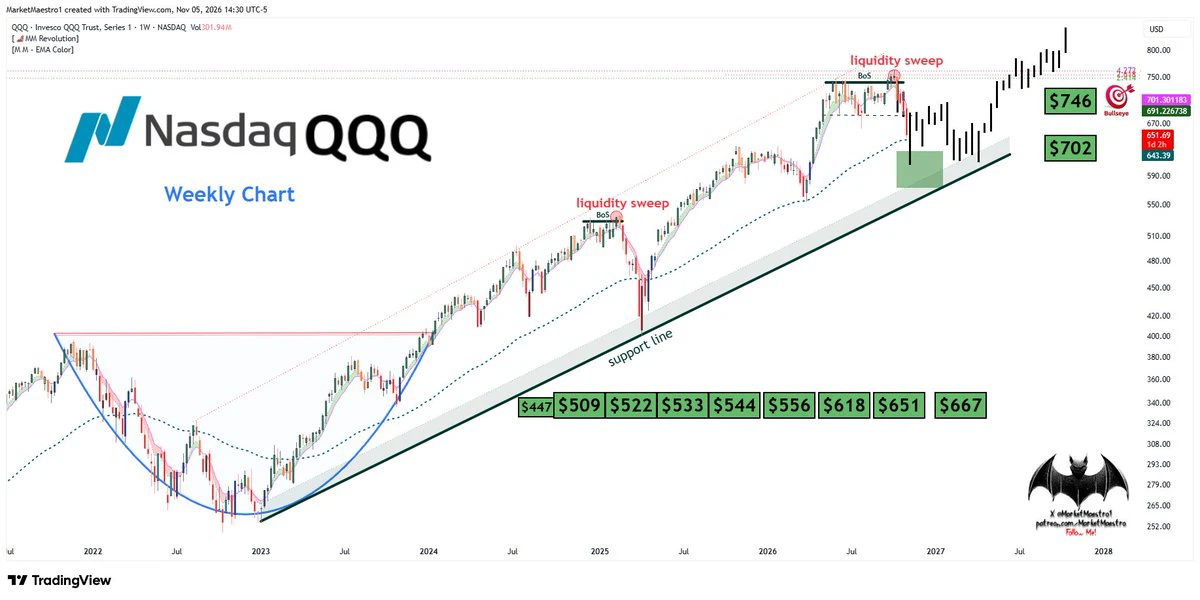
$Q
This is the part where support broke after the liquidity sweep and the heaviest selling occurred.
Important note: I shared the black projection on Patreon and XSubscribe almost a month ago
post-image
Load More

Join 40 M users in our growing community

⚡️ Join 40 M users in the crypto craze discussion

💬 Engage with your favorite top creators

👍 See what interests you

Trending Topics

GateLaunchesPoSECProofOfSecurity

7.69k Views545 Discussing

Beyond Proof of Reserves, Gate has introduced PoSEC, a new Proof of Security framework focused on how user assets are stored and protected. By disclosing the distribution of assets across cold storage and hot wallets, users can directly understand Gate’s storage structure and risk coverage under extreme scenarios. Gate’s latest cold storage coverage ratio stands at 104.58%, meaning cold-storage assets alone are sufficient to cover all user assets. PoR verifies whether reserves are sufficient, while PoSEC shows how assets are stored and how risks are covered — together forming a more complete asset security framework. Share your results and experience! [👉 Learn more](https://gate.com/proof-of-security)

BTCBackAbove80K

126.19k Views41.58k Discussing

DemocratsWinBothChambers

28.37k Views534 Discussing

View More