Square
Following
Hot
News
Notifications
Profile
Share your thoughts
placeholder
Article
11.19 BTC Trading Strategy

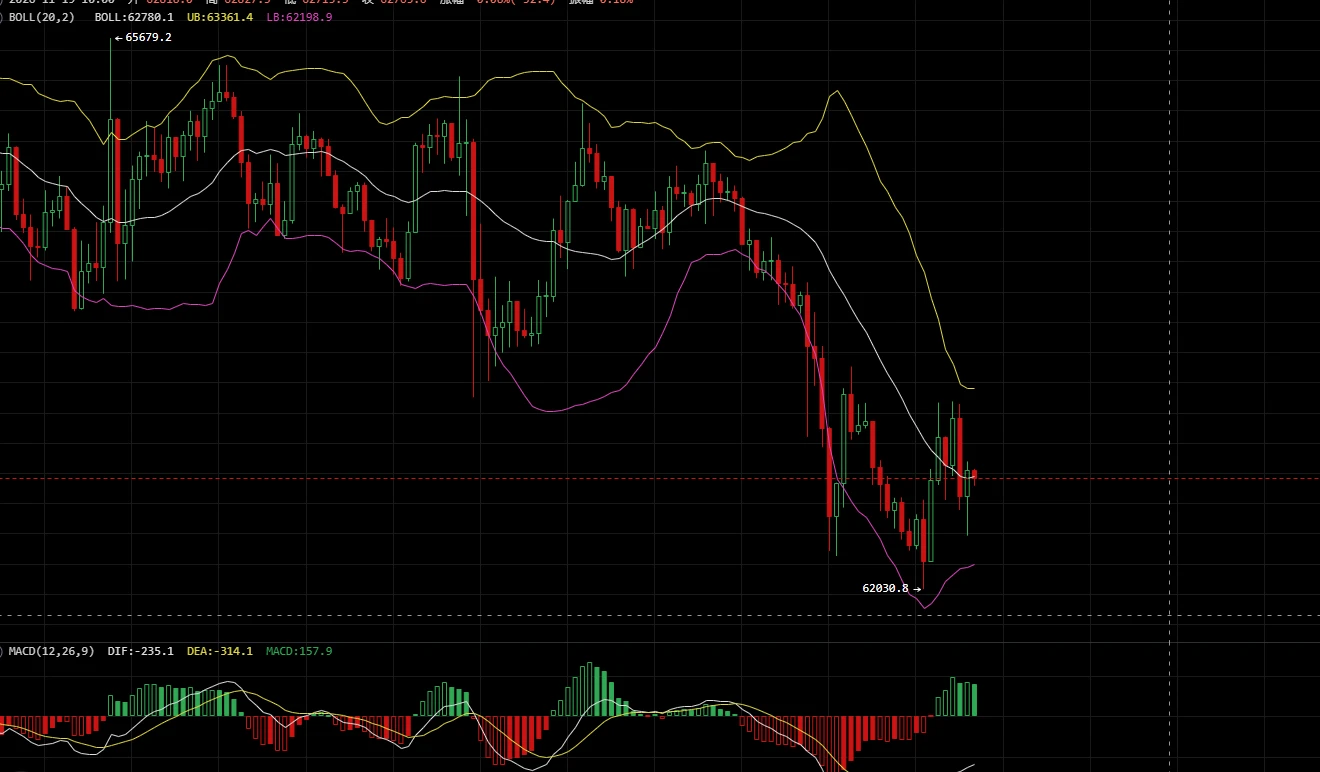
  BTC is currently in the rebound phase following an oversold decline. The Bollinger Bands are opening downward, and after recovering from the 62030 low, the price remains below the lower band. The MACD bearish momentum histogram continues to narrow, with early signs of bullish divergence emerging, indicating short-term potential for a corrective rebound. The first resistance zone is 63300-63400, where the lower Bollinger Band may act as resistance. The key resistance is concentrated at 64400-64500, where the middle Bollinger Band converges with the previous consoli
post-image
BTC-0.65%
#Anthropic发行价83美元 ANT is likely to surge on its first day of trading, but $83 already prices in very high expectations. The first real test after listing will be whether the market is willing to continue assigning it such a high valuation.

Why it may surge on the first day
· Overwhelming demand: Institutional orders totaled about $400 billion, and retail orders about $100 billion. Those who missed out will keep buying after the market opens.
· Underwriters left room: The pricing was only $5 above the top of the range, without pushing it to the absolute limit.
· AI sentiment remains strong: Af
ANT+0.00%
  • 2
Trenches
PIEVERSE
P
bade
b
PIEVERSE
0x0e...25a9
Market Cap
$.
Change
.
24h Vol
$.
Holders
.
DacityCoin
D
bade
b
DacityCoin
DKYc...pump
Market Cap
$.
Change
.
24h Vol
$.
Holders
.
mihao
m
bade
b
mihao
4Cxj...pump
Market Cap
$.
Change
.
24h Vol
$.
Holders
.
GTA6
G
bade
b
GTA6
4kjr...zDnz
Market Cap
$.
Change
.
24h Vol
$.
Holders
.
PROS
P
bade
b
PROS
0x8b...9832
Market Cap
$.
Change
.
24h Vol
$.
Holders
.
Missed breaking the weekend low by just 60 points; don’t mistake the rebound for a trend reversal yet

Yesterday I said the market looked weak and to wait for 65265 to short. The direction was right, but my level was too high: the daytime high only reached 64950. The next two levels did get hit.

This morning’s low was 62062, just about 60 points above the weekend low of 62003. It then bounced to 63303 before turning back, stalling near yesterday’s low of 63336. It’s around 62900 now. Holding here doesn’t mean the trend has turned bullish.

The Fed’s October meeting minutes released this morni
BTC-0.65%
ETH-1.23%
SOL-0.74%
Musk had just landed in Shenzhen when he turned around and compared Jensen Huang to Michael Jordan at his peak in an interview with The New York Times.

After landing, he immediately gave an interview, then started speaking up for his good buddy.
The headlines calling it the worst April are still on the front page, but the Nasdaq finished April up. Not a peep. When it fell, the headlines went all out; when it bounced back, they acted like nothing happened. The media sells emotion, not retrospectives. Trust it, and you’ll be stuck buying high and selling low forever. I’ve got a fund statement from when I opened my account in April stuck to my fridge. The red column still hasn’t gotten back to breakeven. So, is this rally a recovery in the narrative or a real reversal? I still haven’t figured it out.
post-image
NAS100+1.27%
  • 1
Take profits at 64000 and keep reducing your position; add to it if the price drops to 61500 to lower your average entry price. The remaining target is 75000. Stay steady and don’t miss this opportunity in the major crash. If you can’t even hold your positions, you’re truly hopeless
post-image
BTC-0.65%
[New Streamer] Market Prediction
live-cover
LIVE1,933
$BITO Is this going to the moon? Can someone tell me what happened?
Account performance over the past three months: unrealized profit +$1,716.48, return +51.01%, with $BITO contributing +82.00%; position size approximately 1.1k
Honestly, I was stunned when I saw these numbers. $BITO has rallied so hard this time—I never saw it coming. Does anyone know what news is driving it?
Risk warning: The above is shared solely as a record of my personal trades and does not constitute any investment advice. Contract trading involves extremely high risk; please participate with caution.
post-image
BITO-0.88%
Rate-Hike Signals Strengthen | Bitcoin Falters and Continues to Consolidate | If Ethereum Keeps Falling, Watch 1660|
BTC-0.67%
ETH-1.26%
$VELVET $VELVET That's insane. Trading this coin is like licking blood 🩸 off a knife's edge 🔪
has it already pumped and dumped today?
A pump-and-dump like Lab or Rave?
Luring in newcomers?
VELVET-3.58%
Yesterday I said that if it bounced back into the 65260–65450 range and couldn’t break through, I’d try a small short. But the afternoon high only reached 64954, so it never got back to that range, and I didn’t chase the short. It then moved lower on its own. 64000 didn’t hold last night, and the 6 a.m. candle this morning hit a low of 62062, just a few points above the weekend low of 62004. It then bounced to 63304 but couldn’t hold there, and is now back around 62700.

Nvidia’s earnings beat expectations, and the stock rose quite a bit after hours, but it opened higher during the day and the
BTC-0.65%
ETH-1.23%
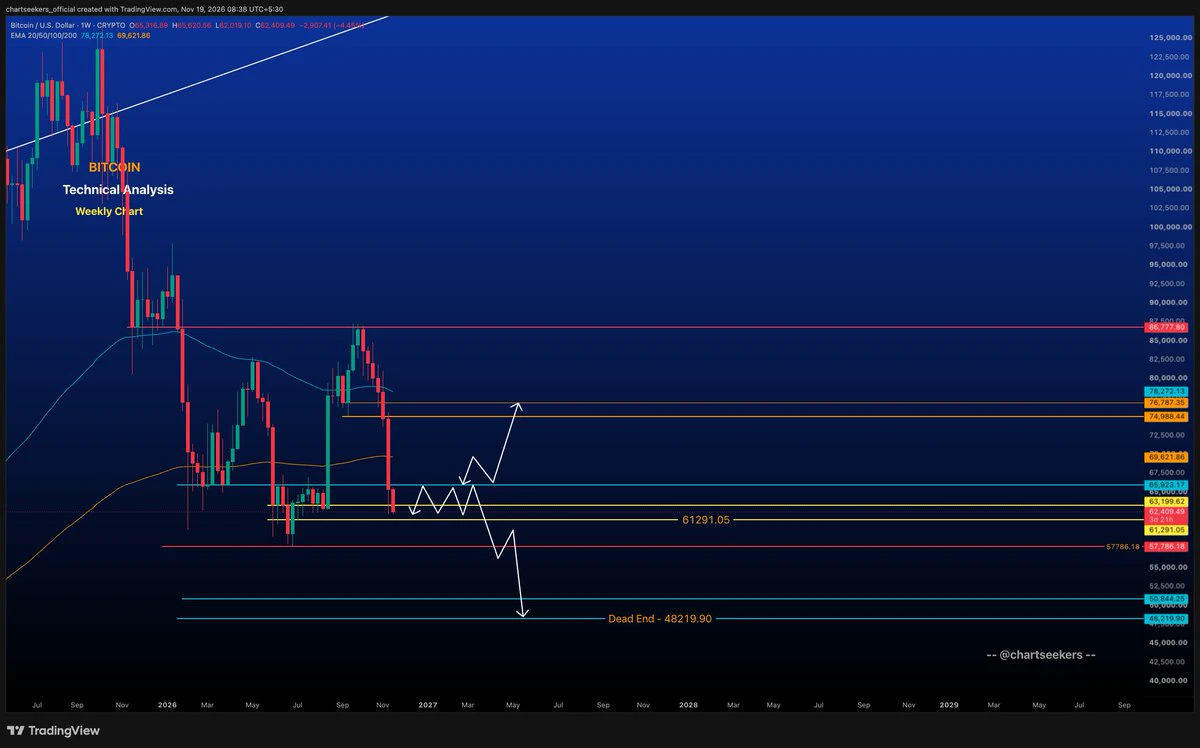
bitcoin:native DAILY OUTLOOK 📊
Bitcoin trading near a crucial decision zone around $61,291. The market is showing weakness, but I’m not expecting a straight-line move from here.
🟢 If BTC holds $61.2K and builds a base, we could see some sideways consolidation followed by a recovery towards $65.8K. A successful reclaim could open the door towards $74.9K–$76.7K.
🔴 If $61.2K fails to hold, the next important support sits around $57.7K. Below that, $50.8K–$48.2K becomes the deeper downside zone.
My Take: Don't rush into taking positions. Let the market show its hand first. Both scenarios are o
post-image
BTC-0.67%
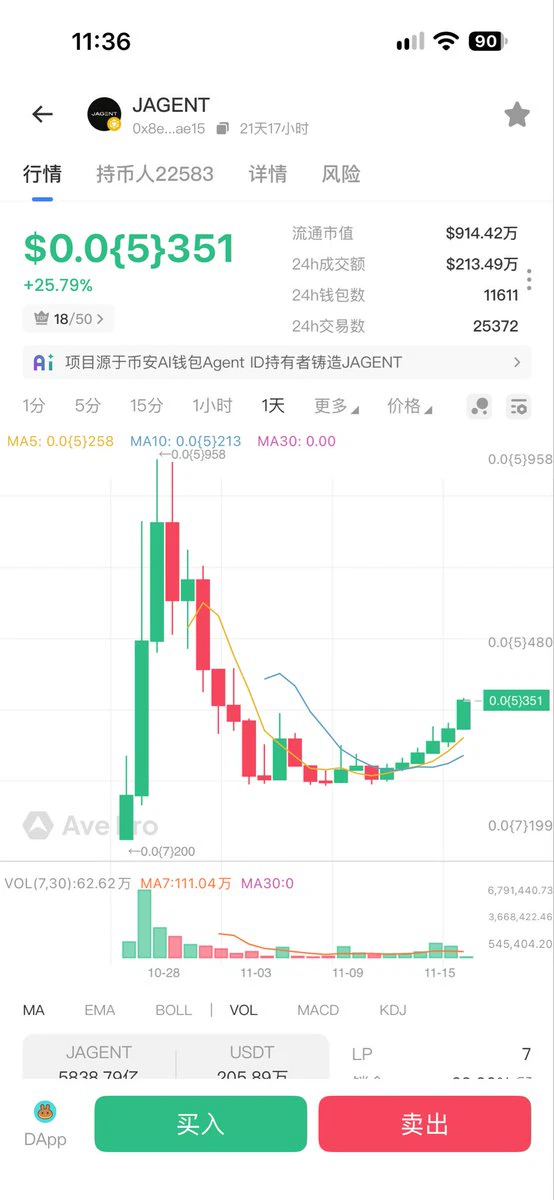
Did you buy the dip when it was over 6 million a few days ago? After all, it’s an early contender in the agentic space, so it seems worth being optimistic about.
post-image
  • 1
  • 1
Live market update about BTC
live-cover
LIVE2,418
The latest move in global long-term bonds does bear some resemblance to the UK pension crisis in 2022. In September 2022, the yield on 30-year UK government bonds rose by more than 100 basis points in just a few trading days. LDI pension strategies were forced to post additional margin, and it took emergency bond purchases by the Bank of England to stabilize the situation. Now, ten-year yields in multiple countries are rising in tandem again: the US 10-year yield briefly moved from around 4% toward and above 4.3%, German 10-year yields returned to above 2.5%, and Japanese 10-year yields approa
post-image
  • 2
GM ☀️

My preference is clear: I’m in the "observer" camp. ✔️

The IPO of AI giant Anthropic begins trading on the Nasdaq today, marking one of the largest public offerings in tech history. For me, however, there is a sharp, decisive line between using a product and investing in the company that funds it.

As a user, Claude exceeds my expectations—it has truly transformed my workflow. It is a fantastic product. But the markets don’t price a product based on how good it is; they price it based on the cash flow it generates and the company’s capacity to sustain that flow. A $1.5 trillion valuat
post-image
ANT+0.00%
  • 2
  • 1
Once a person’s thinking becomes rigid, it’s a very frightening thing.
post-image
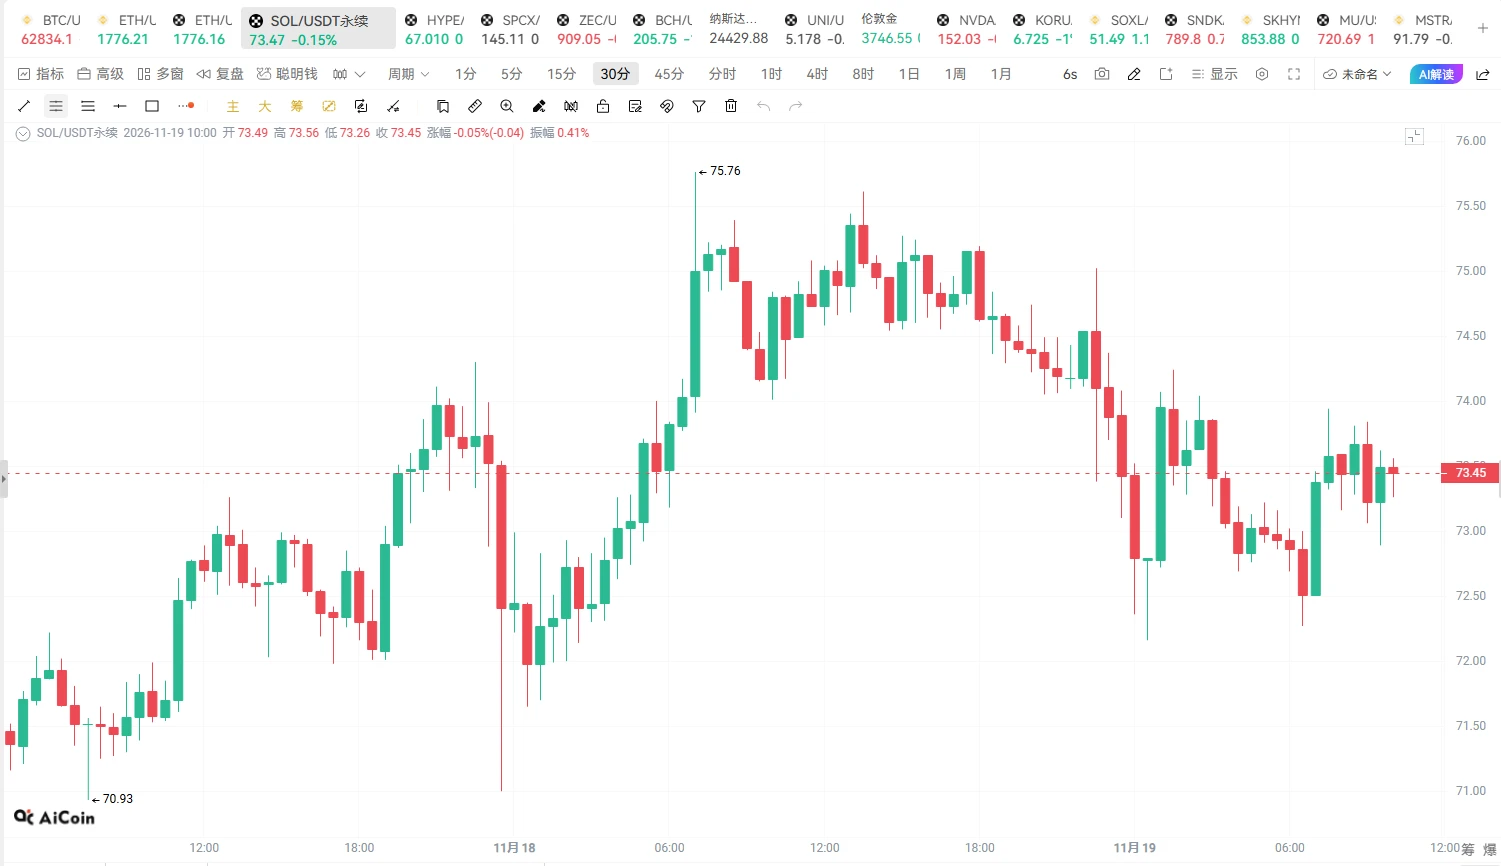
SOL | November 19 Today's Trading Idea

Today's direction: Range-bound trading, mainly shorting rebounds, with light long positions attempted near the lows.

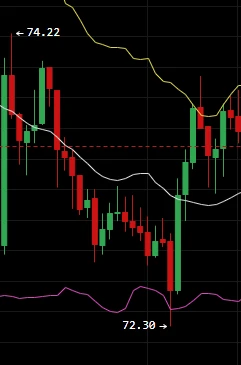
On the 30-minute chart, SOL previously rebounded all the way from 70.93 to 75.76, then began to pull back. It is currently ranging around 73.45, with rebound highs gradually moving lower; the short-term trend has not yet regained strength.

As with BTC and ETH, don't rush to call a reversal for now; trade the range first.

Today's trading plan:
- Short: Enter in batches at 74.00—74.50
- Stop-loss for short: 75.10
- First target: 73.30
- S
post-image
BTC-0.65%
ETH-1.23%
11.19 Market Analysis

SOL Strategy Reference Setup
Rebound range: short around 73.8--74.5
Stop loss: 75.0
First target: 72.5, second target: 72.0

SOL 1-hour chart: short-term trend has turned bearish; focus on shorting rebounds!
Current price: 73.42. Price has fallen steadily from a high of 75.74, hitting a low of 72.16. After a slight rebound to around 74.0, it came under pressure again and weakened, with the short-term structure leaning bearish.
Trading approach: Use the overhead resistance range as a reference and wait for a rebound to meet resistance before entering short positions. Don'
post-image
BTC-0.65%
SOL-0.74%
Load More

Join 40 M users in our growing community

⚡️ Join 40 M users in the crypto craze discussion

💬 Engage with your favorite top creators

👍 See what interests you

Trending Topics

FedMayNeedA50bpRateHike

378.8K Views1.9K Discussing

Minutes from the Fed’s October meeting showed that while officials kept rates unchanged, “almost all” policymakers still believed further rate hikes would be needed if the economy evolved as expected. More importantly, a few officials said that if inflation remained too high, the Fed could even need a 50bp hike at a future meeting. Recent inflation data have already moved closer to that kind of trigger. The market is no longer just debating whether the Fed will hike again, but whether it may need to move faster. Do you think a 50bp hike will start getting priced back in? If hawkish expectations keep rising, which faces more pressure: $BTC or U.S. equities?

AnthropicIPOPricesAt83

489.8K Views3.9K Discussing

GateRanksThirdIn24HNetInflows

85.9K Views58.3K Discussing

View More