Square
Following
Hot
News
Notifications
Profile
Share your thoughts
placeholder
Article
Huawei Executive Richard Yu announced that nationwide test drives of the Xiangjie V8 have officially begun, with its launch event approaching. The vehicle is the first MPV under Harmony Intelligent Mobility Alliance, with a presale price starting at 329,800 yuan. All models come standard with an 800V platform, rear-wheel steering, and Huawei Qiankun ADS.

The presale price starting at 329,800 yuan is just the entry point. The extended-range and all-electric versions actually start at 409,800 yuan and 449,800 yuan, respectively. Before buying, make sure your budget fits the version you want.
$B
BTC-0.67%
In the cryptocurrency market, many people look for trading opportunities every day, but few take the time to make a trading plan. They go long when they see BTC rising and short when they see prices falling, then start questioning their judgment as soon as the market moves slightly against them. This kind of planless trading can easily lead to repeated losses.
So, what should a truly effective trading plan include?
First, define your trading direction. Before entering a trade, analyze whether the market is currently trending up, trending down, or moving sideways. Don’t decide on a direction ba
post-image
BTC-0.67%
Trenches
ZIG
Z
bade
b
ZIG
0x8c...1145
Market Cap
$.
Change
.
24h Vol
$.
Holders
.
BTC
B
bade
b
BTC
C5xp...pump
Market Cap
$.
Change
.
24h Vol
$.
Holders
.
GM
G
bade
b
GM
0x13...7777
Market Cap
$.
Change
.
24h Vol
$.
Holders
.
Diamond
D
bade
b
Diamond
5VCE...pump
Market Cap
$.
Change
.
24h Vol
$.
Holders
.
DOGE
D
bade
b
DOGE
DoGE...fm7R
Market Cap
$.
Change
.
24h Vol
$.
Holders
.
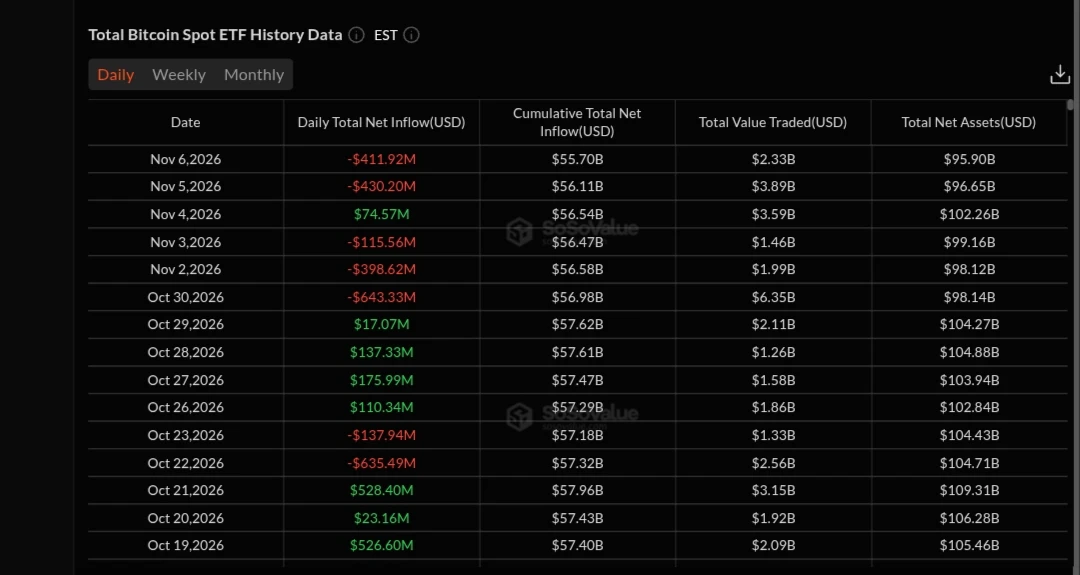
#BTCETFOutflowsContinue
U.S. spot Bitcoin ETFs have experienced a notable shift in momentum, recording significant net outflows over the recent trading sessions. According to data from SoSoValue, daily net outflows exceeded $400 million on consecutive days heading into November 6, 2026, contributing to a substantial reduction in total net assets.
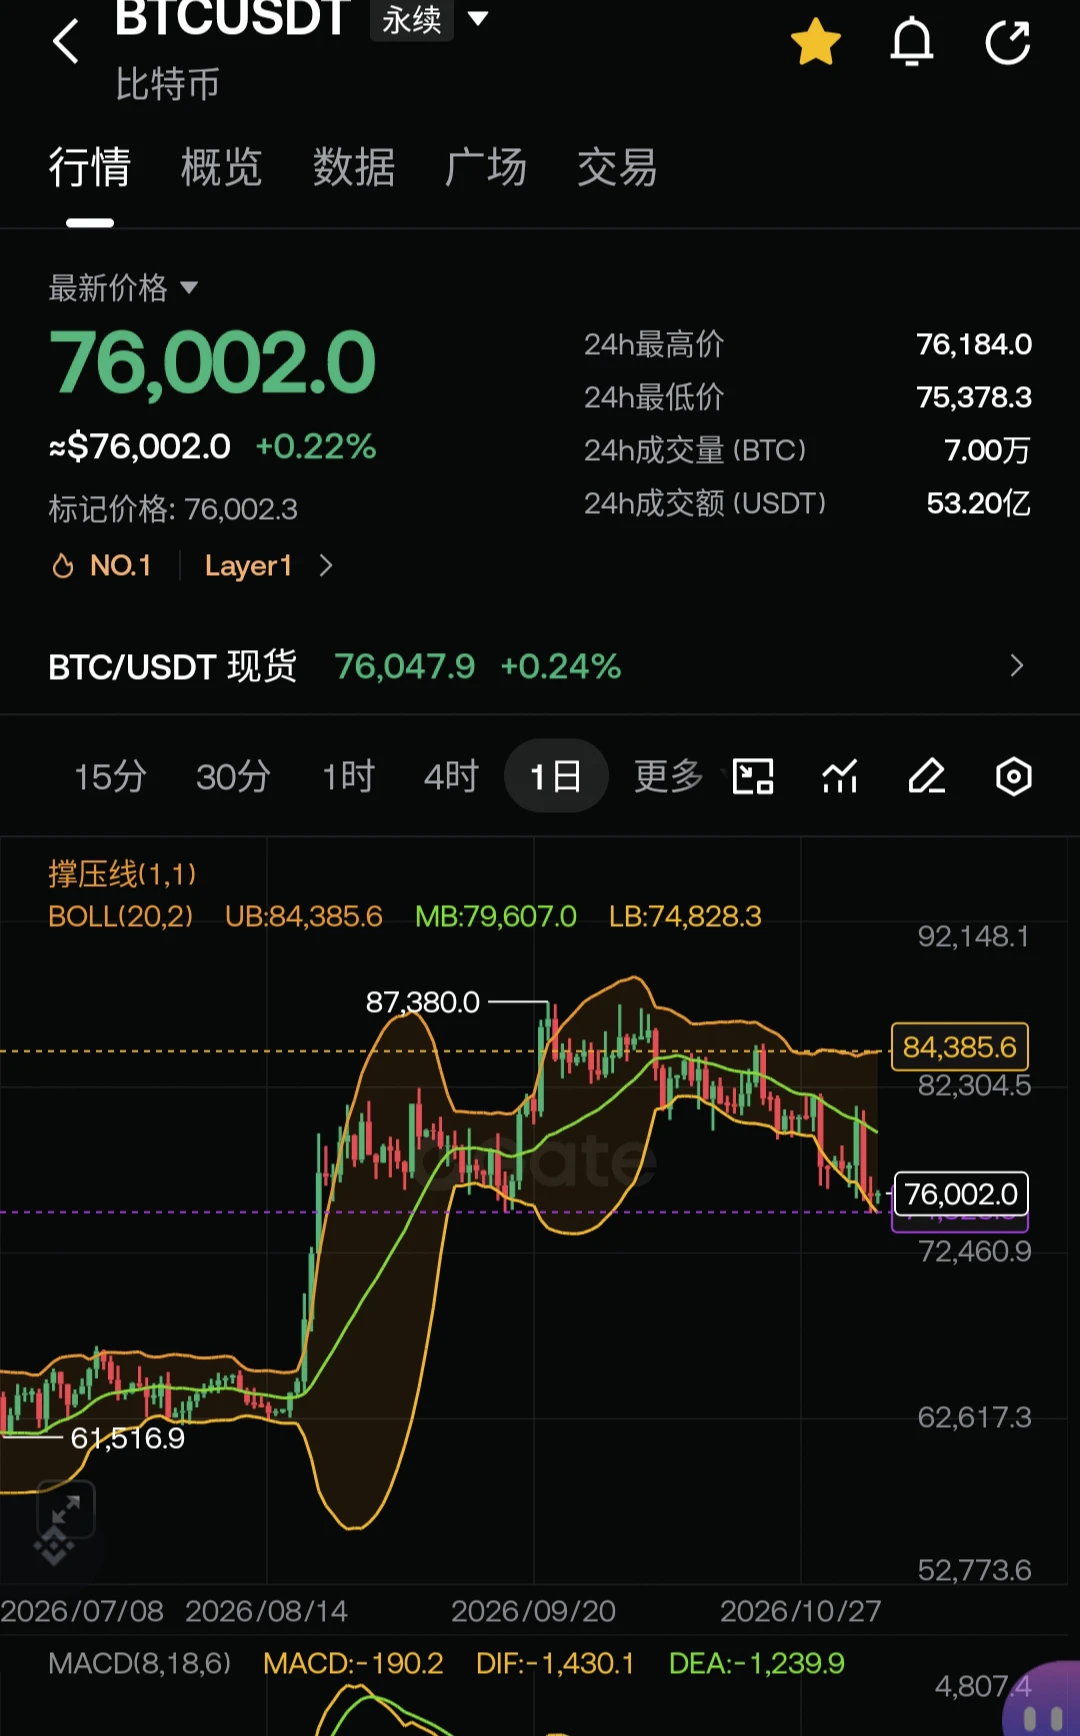
This trend raises key questions regarding institutional behavior. While Bitcoin's price has demonstrated resilience, holding above $75,000, the sustained exit from ETF products suggests a tactical rotation or temporary risk aversion rather than a str
post-image
BTC-0.31%
  • 3
Justin Sun predicts that building muscle will be more valuable than holding gold over the next 10 years

Justin Sun must have been shocked by Zhang Jike, huh?
He keeps talking about building lean muscle every day,
thinking he’s rich and talented, but Jing Tian still doesn’t love him.
Justin Sun, you’re so good at making predictions—
why didn’t you predict back then that Jing Tian would break up with you? 🤔
GLDX-0.40%
PAXG+0.37%
AI stocks have fallen to rock-bottom prices, yet data centers are still expanding at a furious pace: Who’s really putting on an act in this market?

The recent action in AI stocks has been like a major plot twist. The market was chasing artificial intelligence one moment, then tech stocks came under pressure across the board the next. Investors thought they were buying the future, but when they opened their accounts, it felt like they’d bought a one-way ticket to the top.
Goldman Sachs, however, has a different take.
Its forecast for U.S. data center construction spending has been raised, with
NVDA+2.80%
  • 26
MARKET UPDATE
live-cover
LIVE1,138
Bitcoin: The next levels to watch are 73,000 and 73,000. If 73,000 breaks, 69,000 basically won't hold. If 73,000 breaks, I see 40,000 as a possibility. There is a chance it could bounce straight back up from 69,000, but that chance isn't very high. 69,000 is the absolute limit. If 73,000 breaks on heavy volume, it's basically game over. If it wicks down at this level and then goes back up, that would be the bottom. Normally, if we're going to see a bullish trend, 73,000 won't break. If 73,000 breaks, there's an 80% chance this rally is over, and then we're looking at 40,000.#非农就业数据推升加息预期 The
post-image
BTC-0.65%
Setting a stop-loss does not mean you will definitely exit at the expected price.

Many traders believe that once they set a stop-loss in advance, their maximum loss is already fixed. But in real markets, the stop trigger price and the final execution price may not be the same.

Why does this happen?

I. Market volatility: Prices can quickly move past your stop level

When the market suddenly becomes highly volatile, prices may move past your stop trigger price in a very short time. If the next available execution price is already worse, your actual loss may exceed what you originally planned.
post-image
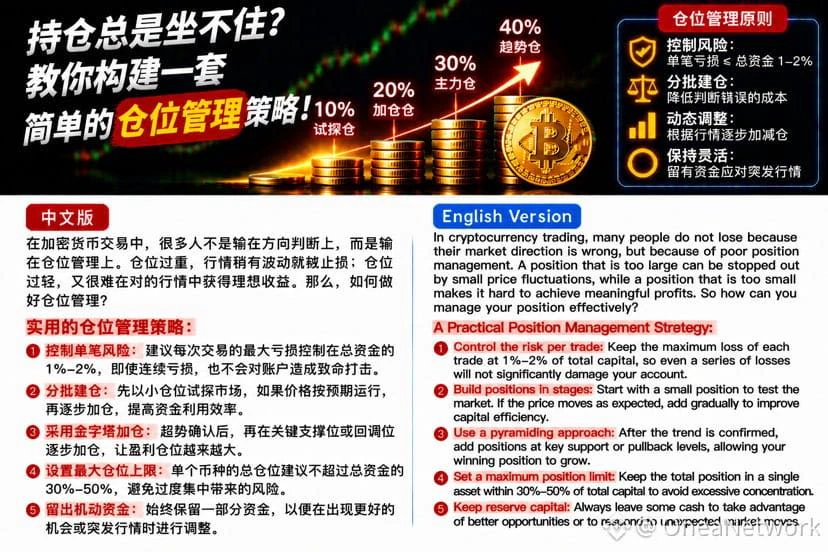
In cryptocurrency trading, many people believe that as long as they can accurately predict whether BTC will rise or fall, they can consistently make a profit. But reality is often the opposite: some traders have a fairly high win rate, yet their accounts never grow consistently. The problem may not be their directional calls, but their position sizing.
Why is position sizing so important?
First, oversized positions can magnify losses. If BTC drops 2%, a trader with a small position may experience only normal volatility, while a heavily positioned trader using high leverage could suffer serious
post-image
BTC-0.65%
#质押Launchpool瓜分45万VLX Gate Launchpool Session 386 is here: Stake BTC, ETH, or VLX to share 4,545,460 ValueX (VLX), with an estimated maximum annualized return of 47.40%.

The numbers look enticing. But today I want to talk about something less enticing—three questions you need to think through first.

I. 47.40% is an annualized peak estimate, not what you’ll actually earn
Launchpool’s annualized return is an extrapolated figure. Here’s a classic industry comparison: a 7-day campaign advertises a 300% annualized return, but the actual return is only about 5.75%—because annualization simply mul
post-image
VLX+0.00%
BTC-0.67%
ETH-1.26%
  • 3
[NEW STREAMER]hot prediction market update💕
live-cover
LIVE1,584
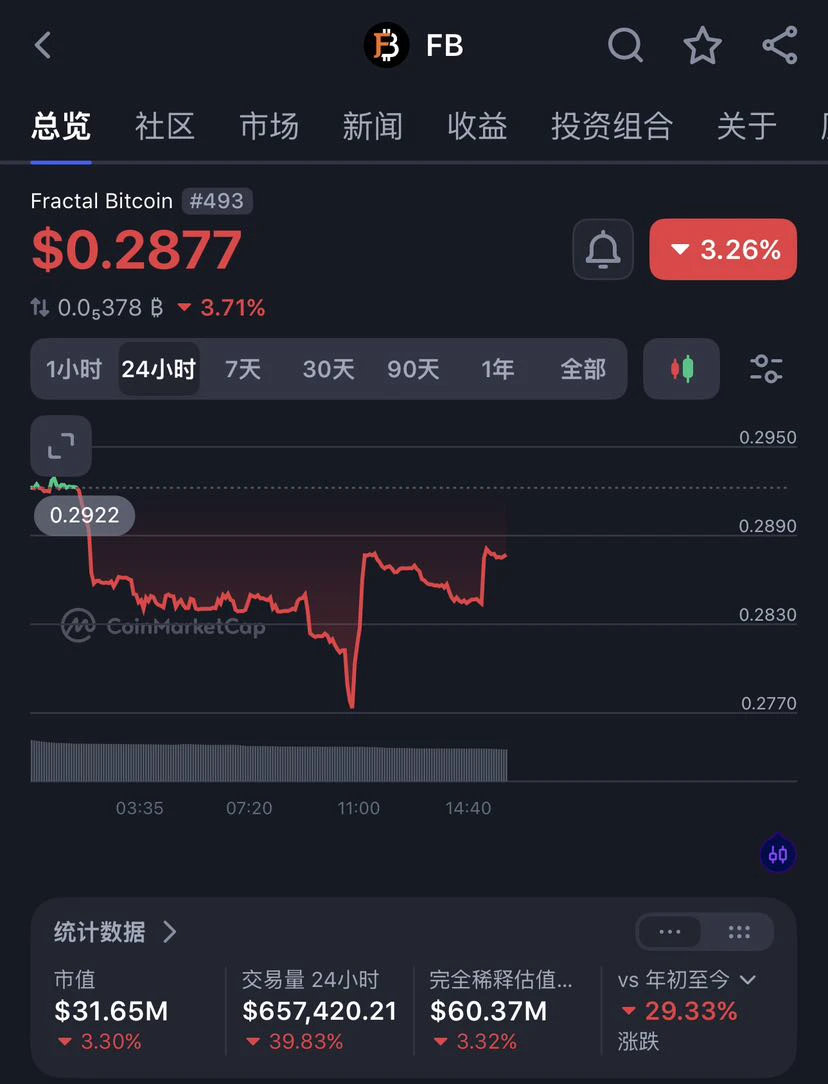
In this market, a lot of people see a small-cap coin and scroll right past it. $FB is probably no different. But I’ll give it a second look: the halving has reduced its new supply, and it’s needed to pay on-chain fees, so there’s at least a reason to keep watching. After such a big drop, I’d be lying if I said I had no interest at all; it’s just that no one really wants to be the first to make a move right now. I’ll keep watching to see whether more people start using it on-chain—if they do, even this garbage might be worth picking up. $FB
post-image
FB-1.17%
Go long on $ONDO . Entry: 0.3682 - 0.3701 Take-profit range: 0.3870 - 0.401 Stop loss: 0.3572 ONDO is gearing up for a rebound; let's ride this rebound until it reaches structural resistance. Note: The bearish trend on the 1-hour timeframe remains dominant; price may face resistance and pull back at 0.3730. Don't go all in, bro. Position size should suit your own account.
post-image
ONDO-0.29%
Why can your account's overall risk be far higher than expected even if you've only made a few trades?

Many traders review their positions one by one, but overlook a more important question: Do these trades share a common source of risk?

Suppose you simultaneously hold long positions in BTC, ETH, and SOL. On the surface, you hold three different assets; but if all three are affected by a broad market downturn, tightening liquidity, or declining risk appetite, these trades could all lose money at the same time.

These are three often-overlooked issues in portfolio risk.

1. Correlation risk:
post-image
BTC-0.67%
ETH-1.26%
SOL-0.77%
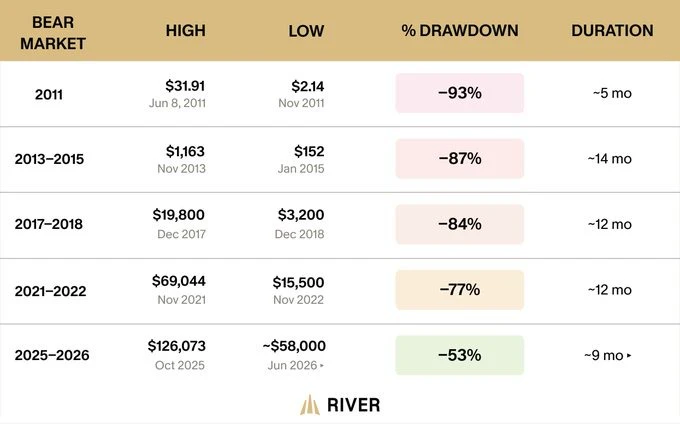
Every Bitcoin bear market has come with a new reason to panic
2011: -93% (hack fears)
2013-15: -87% (Mt. Gox collapse, China cut banks off from exchanges)
2017-18: -84% (altcoin bubble popped, regulators stepped in)
2021-22: -77% (Celsius, FTX, leverage blowups)
2025-26: -53% (exchange hacks, AI and quantum fears)
Different story every time. Same result: Bitcoin kept going.
The drawdowns have gotten smaller every cycle: 93, 87, 84, 77, 53. That’s what a maturing asset looks like.
post-image
BTC-0.67%
㊙️ Why institutions must “lay bait”
The market is zero-sum: for institutions to execute large orders, someone has to take the other side. Retail traders’ stop-loss orders are the most readily available counterparties. The problem is—stop-loss orders don’t appear out of nowhere; retail traders must first enter the market. So the process unfolds in three steps:
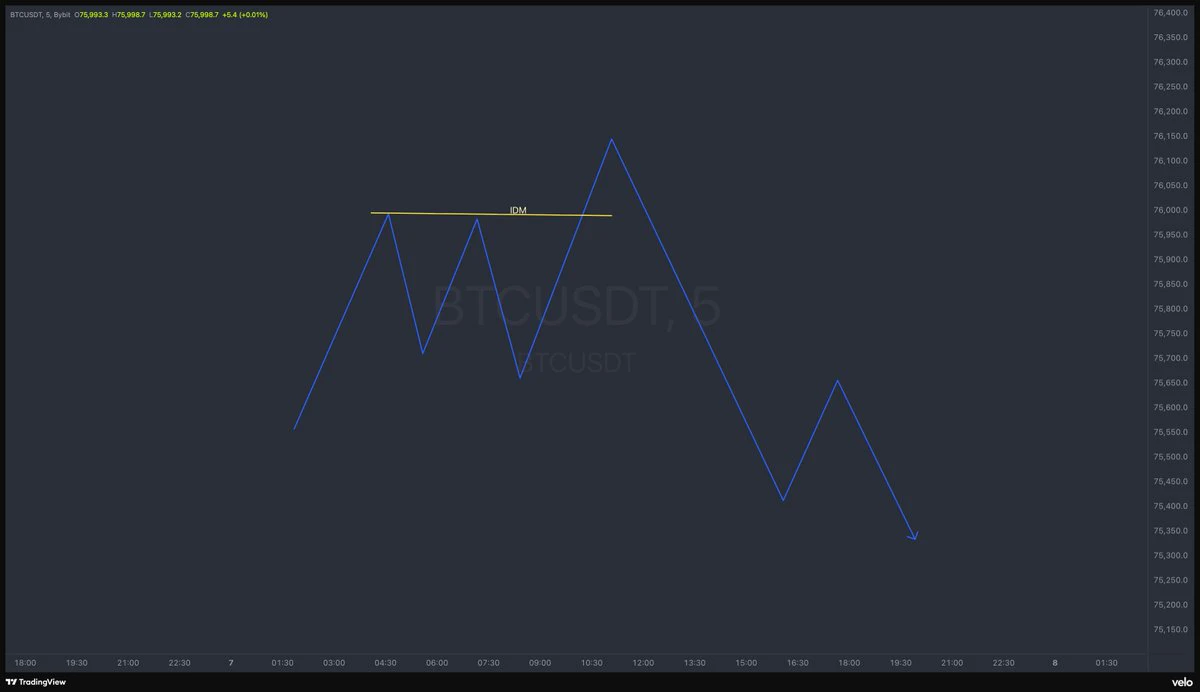
Create a structure that looks like an entry point: a small-scale HL, a small BOS, a neat trendline.
Wait for retail traders to enter and place their stop-losses somewhere obvious: most people will put their stop-losses just below that sma
post-image
Streamers win with words, creators with talent? At Gate’s annual awards, who will have the last laugh?

There are two kinds of people in crypto who are especially worth following: streamers who can explain complex market movements clearly in their livestreams, and creators who can make market trends easy to understand in their writing.
One keeps you hooked as you listen; the other keeps you reading.
Now, Gate’s annual social awards for streamers and creators are here! In this year-end showdown, will streamers’ popularity come out on top, or will creators’ content prove stronger?
For streamers,
MU+4.71%
  • 10
In crypto trading, many people watch BTC candlestick charts every day but don't know how to tell whether the market is currently in an uptrend or a downtrend. In fact, there is a very common technical indicator that can help us see the market direction more clearly: the moving average (Moving Average, or MA).
So, what do MA20, MA50, and MA200 represent?
First, the MA20 short-term moving average. It reflects recent price changes and is relatively sensitive to short-term market movements. When BTC's price stays above the MA20 and the average slopes upward, it usually indicates relatively strong
post-image
BTC-0.67%
#BTCETF资金持续流出 For now, continued ETF net outflows look more like short-term risk aversion and deleveraging than institutions collectively exiting Bitcoin. But the concentration of outflows in BlackRock's IBIT also shows that some large investors are adjusting their allocations.

Why this doesn't look like a collective institutional retreat
Outflows were highly concentrated: From November 2–5, cumulative outflows were about $869.8 million, of which IBIT alone accounted for about $806.5 million.
There were both inflows and outflows: On November 4, there was a net inflow of about $128 million, wi
BTC-0.31%
IBIT-0.30%
BLK+0.60%
  • 4
#美股AI板块遭遇重挫 #每周来晒 This latest sell-off in U.S. AI stocks was a deleveraging-driven rout, but the AI trade has entered a deeper correction. From here, tech giants with stable cash flows look more attractive, while chip stocks need to be repriced based on valuations and expected returns.

Why it’s about more than deleveraging
The trigger was political: Democrats won both chambers, raising market concerns about tighter data center permitting and power-use regulations.
AI investment returns are being reassessed: Five cloud providers spent $556.9 billion on capital expenditures in the first nine m
NVDA+2.80%
MSFT-0.95%
GLDX-0.40%
PAXG+0.37%
  • 1
  • 1
Load More

Join 40 M users in our growing community

⚡️ Join 40 M users in the crypto craze discussion

💬 Engage with your favorite top creators

👍 See what interests you

Trending Topics

USAIStocksHitHard

15.97k Views3.64k Discussing

U.S. stocks sold off sharply on Thursday, November 5 (UTC). The Nasdaq closed down around 5.5%, entering correction territory, while the Philadelphia Semiconductor Index plunged roughly 12%, with chip stocks including $NVDA and $AMD posting steep losses. Beyond profit-taking, investors are growing concerned about the pace of AI data center construction, capital spending, and future returns on investment. The key question now is whether the AI sector’s lofty growth expectations need to be repriced. Where do you think the next opportunities will emerge: chip stocks, tech giants, or other sectors?

USNonfarmPayrolls

23.64k Views4.26k Discussing

StakeOnLaunchpoolToShare450KVLX

2.62k Views775 Discussing

View More