
Square
Following
Hot
News
Profile
Share your thoughts
placeholder
Article
$RIF RIFUSDT The price is moving within an ascending channel
The price is moving within a descending channel on the 1-hour timeframe; it has reached the lower boundary and is poised for a rebound. A retest of this boundary is expected, supporting an upward move.
The Relative Strength Index (RSI) indicates a bearish trend, but an upward breakout is likely due to oversold conditions on the 1-hour timeframe.
An orange trend line supports the upward rebound.
There is initial support at 0.0775, acting as a preliminary support zone.
A key support zone (marked in green) exists at 0.0790; the price ha
post-image
RIF-1.54%
After surging 73%, my conclusion is very direct: do not chase the rally; only enter on a pullback, and a hard stop-loss is mandatory.
There are three reasons. First, RSI has reached 79.1, indicating deep overbought conditions. The Bollinger upper band at 0.03225 is right overhead, while the current price of 0.03021 is less than 7% below it. Going long now is equivalent to taking over at the peak of market sentiment. Second, the funding rate is negative at -0.0118%, meaning shorts are still paying fees. This shows that the short squeeze momentum has not been fully released, but it also means th
post-image
ENA+4.81%
The Senate passed it unanimously: During a government shutdown, lawmakers shouldn’t get a single penny in pay. Kennedy proposed it and finally did something decent. Shutting down key agencies like the TSA while lawmakers continue getting paid is outrageous. I hope I’m wrong this time—if I am, it means this measure simply can’t get through.
post-image
$EIGEN EIGEN Bearish Divergence- Potential Drop to $0.242
EIGEN/USDT – Bearish Divergence | Potential Drop to $0.242
EIGEN is showing signs of weakening bullish momentum on the 30-minute chart.
Key Bearish Signals:
* Clear bearish RSI divergence: price formed higher highs while RSI printed lower highs.
* RSI is forming a contracting triangle, with a potential breakdown below its ascending support line.
* Buying momentum is fading despite the recent price rally.
Bearish Targets: $0.2422
⚠ Confirmation: A 30-minute candle close below $0.2720 would strengthen the bearish scenario.
❌ Invalidati
post-image
EIGEN+10.31%
🔥🚨 HOT TRADER LIVE | BTC BREAKOUT OR DUMP? 🐂🐻 | BIG MOVE ALERT ⚡📈
live-cover
LIVE1,286
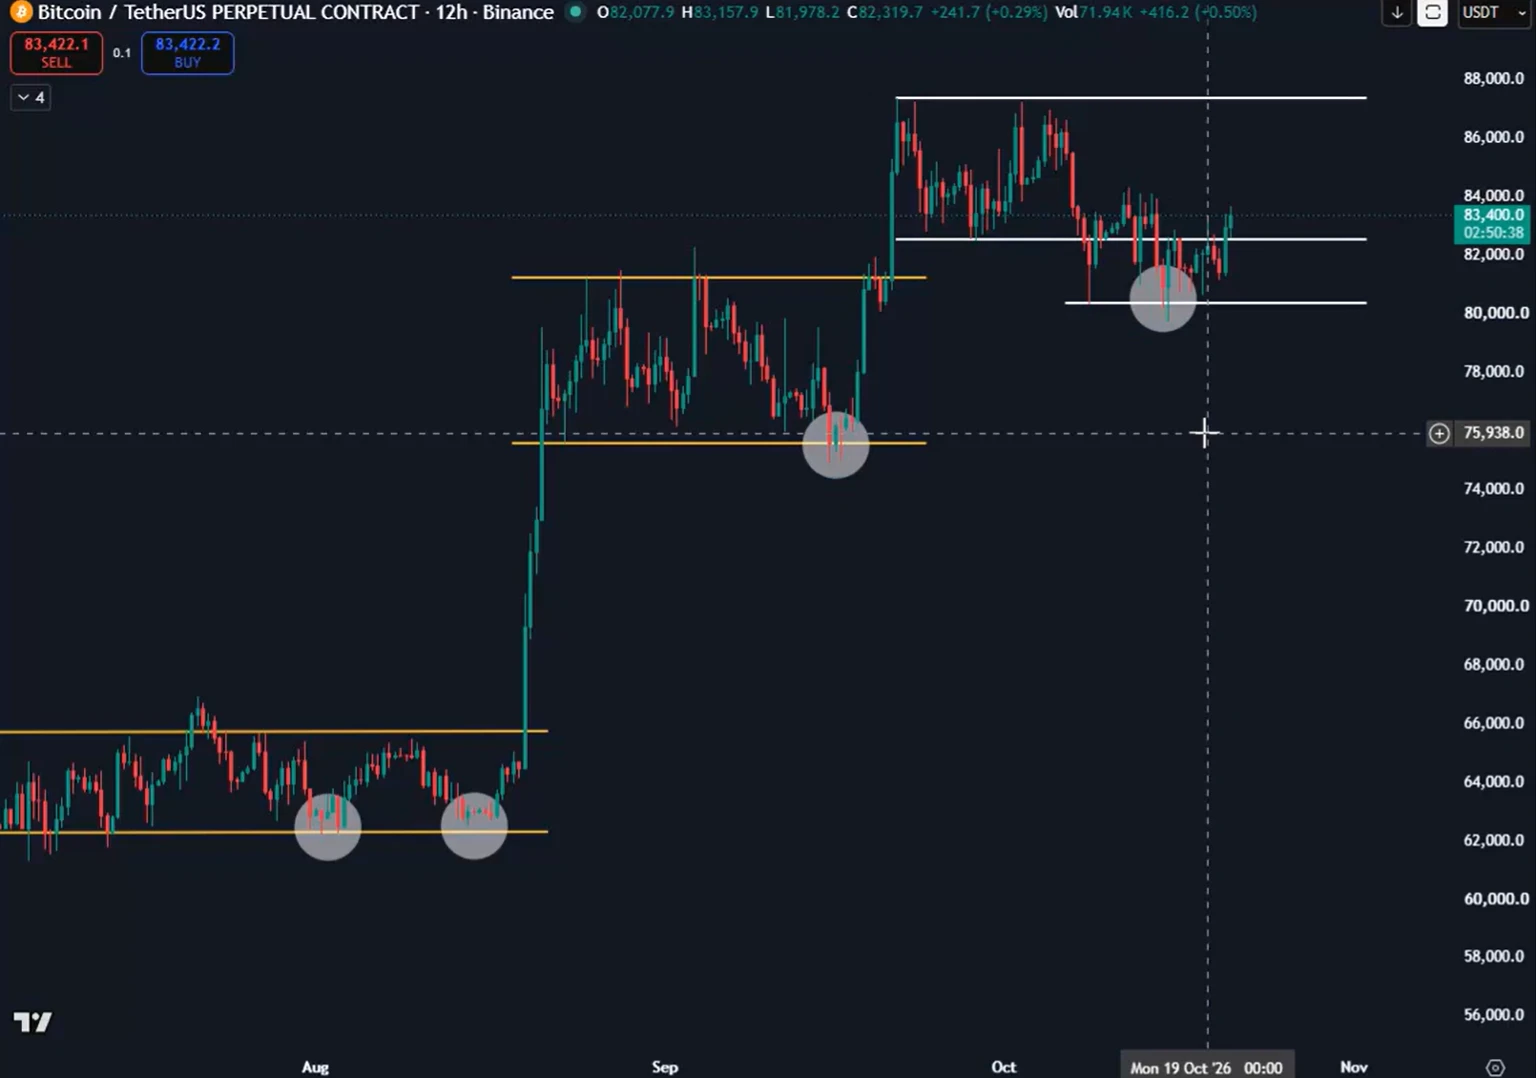
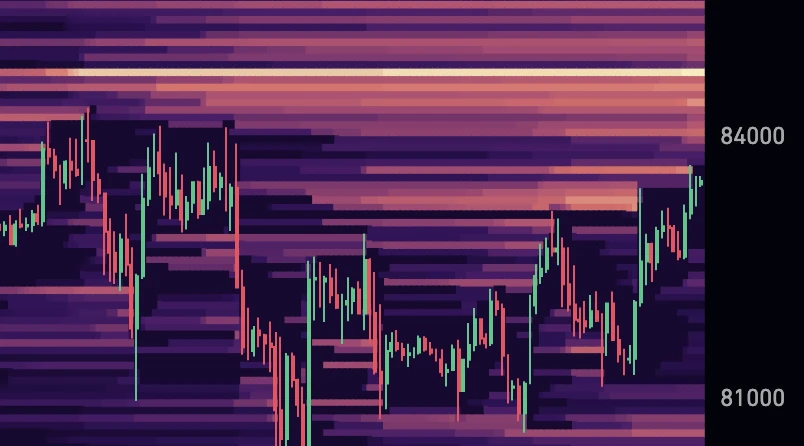
Last week, BTC attempted to move upward and touch the 87000 resistance. After failing to break through, the market immediately came under selling pressure, falling all the way from 86600 and reaching a low of 80300.
By the weekend, the market began entering a recovery phase, with the price gradually moving higher. The rebound peaked at 84340, and today’s focus is on the 84500 Fibonacci level. Whether it can hold will directly affect whether this rebound can continue to expand.
For those holding trapped long positions, preserving capital should always come first. As the market approaches your e
post-image
BTC+0.53%
ETH+2.16%
SOL+1.92%
Many people see the Fear and Greed Index surge to 69 and reflexively shout “greed has peaked,” but overlook one premise: when the broader market has not suffered systemic deterioration, greed often corresponds to the main upward phase of strong-performing coins, not the end. Right now, $W is a typical example—up 71.44% in 24 hours, with 48.4M USDT in trading volume. Against a backdrop of no clear breakdown in BTC and relatively warm market sentiment, funds are visibly rotating into high-beta small-cap sectors.
Technically, $W is currently priced at 0.03002. MA5=0.029444 has crossed above and
post-image
BTC+0.52%
MAGIC+1.22%
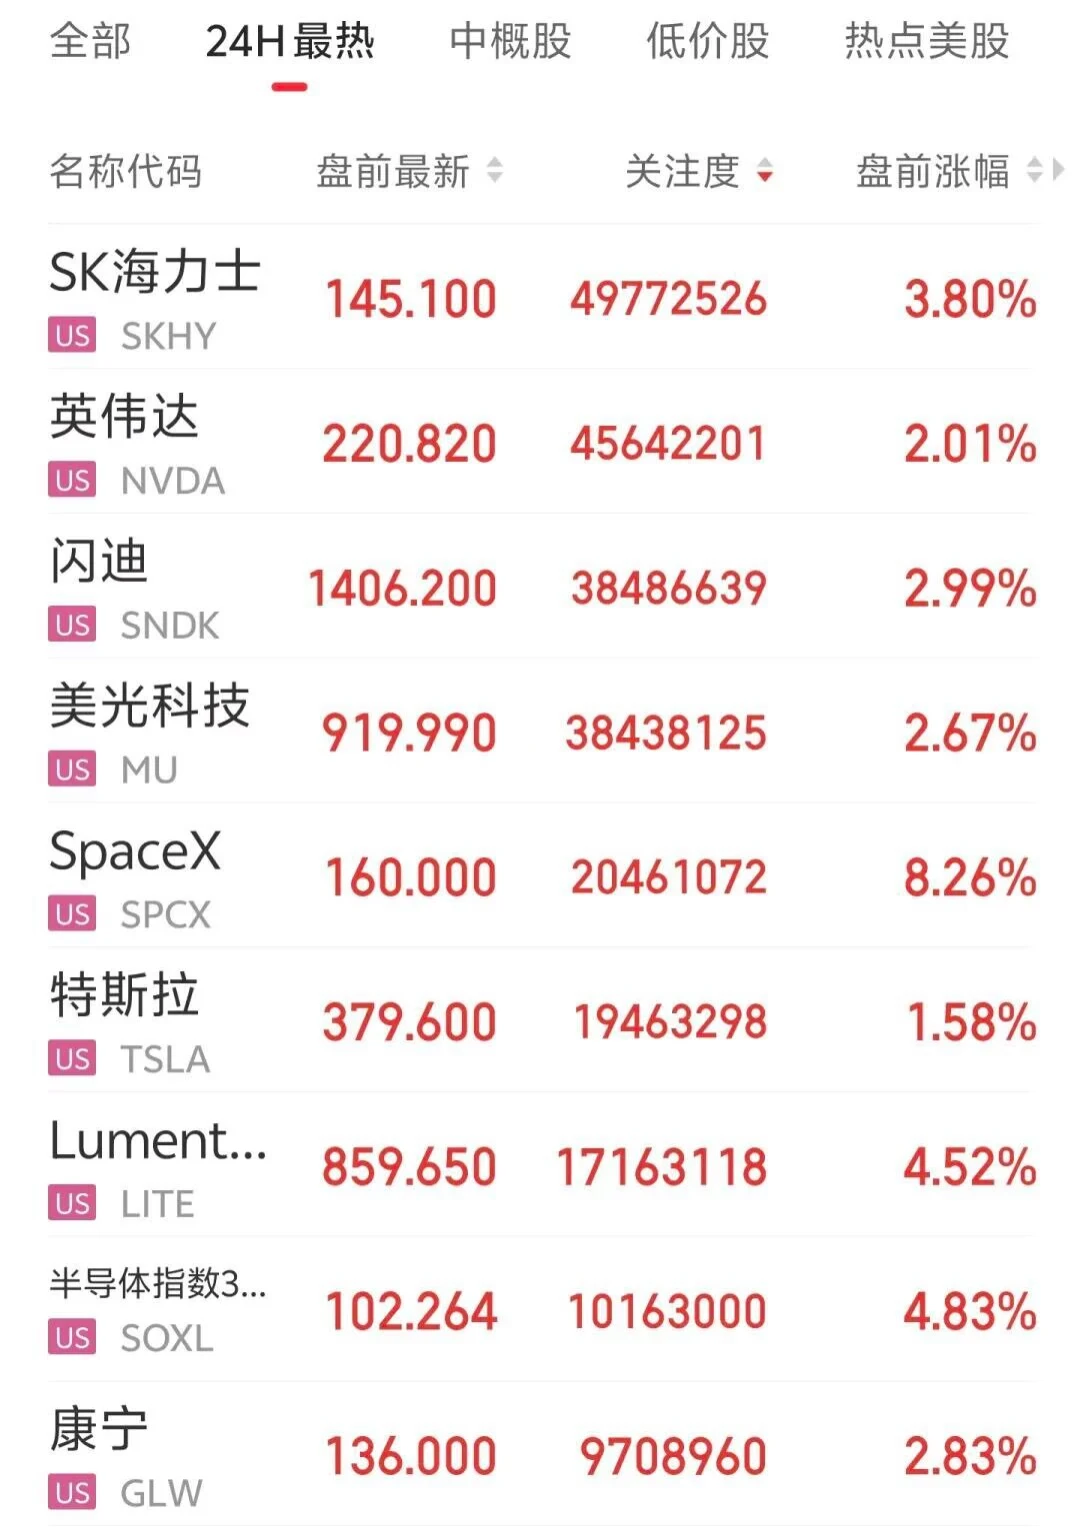
$SNDK Cautiously go long, and refuse to pay for AI
The AI trend has been blowing for so long. After being pushed to a climax in June and then retreating, it now appears to have merely recovered somewhat, without the ability to return to its peak.
After OpenAI's performance fell short of expectations, concerns about an AI bubble resurfaced in the market. Coupled with tech giants calling for a slowdown in AI development some time ago, the market is currently no longer as aggressive toward AI and memory.
Previously, people said there would always be a shortage of memory, but things do not look ve
post-image
SNDK-2.23%
$BNB Current price 752.68; the short-term long/short dividing line is at 745, with first resistance above at 768. This assessment is not a guess, but a reusable market-reading method based on moving-average structure: to determine whether a trend is healthy, focus on the relative position of the price and moving averages, the direction of the moving-average alignment, and whether pullbacks occur on declining volume.
First, look at the structure. $BNB The current price is above the short-term moving averages, up 0.65% over 24h, indicating mild consolidation rather than a sharp rally; this type
post-image
ALGO+9.40%
BTC MARKET UPDATES
live-cover
LIVE62
#GateXRedBullWinsSingaporeGP Verstappen Finally Conquers Marina Bay: 73rd Career Victory, 250th Start and a Red Bull Weekend Sweep
Max Verstappen has finally conquered one of Formula 1’s most demanding street circuits. On October 11, 2026, the Red Bull Racing driver won the Singapore Grand Prix in 1:42:00.785, converting pole position into victory across 62 laps at Marina Bay. It was his first Singapore Grand Prix win, his 73rd career Grand Prix victory and a landmark result in his 250th F1 race start. The victory also completed a remarkable weekend after he won Saturday’s Singapore Sprint.
Th
$AVAX Current price 11.034, 24h +7.13%, trading volume 34.8M USDT. In terms of moving-average structure, MA5=11.005 has risen above MA20=10.8769, and a short- to medium-term bullish alignment is beginning to form; the MACD histogram at +0.003719 remains bullish, but absolute momentum is relatively weak; RSI=68.4 is approaching overbought territory, while the upper Bollinger Band at 11.1711 is directly overhead. The price is running close to the upper band, indicating a strong but overextended pattern. The funding rate is mildly positive at +0.0038%, with no signs of excessive leverage; the Fea
post-image
MET-6.48%
BREAKING: Over $2B in grain across 12,000+ warehouses in India is coming onchain via Avalanche, enabling millions of farmers to use stored crops as collateral for loans.
AVAX+6.98%
NEAR at $5.7—would you still dare to chase it?
Up 150% in 30 days, surging from $2.3 to $5.7, with the ETF attracting $58 million in three days and Intents posting $4.8 billion in monthly volume—but perpetual funding rates have turned positive and whales’ long positions are crowded. Is jumping in now a chance to feast or get slaughtered?
First, look at the surface: NEAR has become the strongest altcoin of this cycle.
BTC is ranging between $83K and $86K, ETH is hovering around $2,550, yet NEAR has independently rallied from $2.3 in mid-September all the way to $5.7, gaining nearly 150% in 30 d
post-image
BTC+0.52%
ETH+2.14%
NEAR+10.61%
October's market is not short of opportunities; what's lacking is someone to help you take the right position in advance. $BTC ‌#BTC涨1.17%
post-image
BTC+0.53%
UPL
I am watching the N4.01/share zone.
#NFA
post-image
This week could be huge for the markets...
wednesday: us cpi and core cpi data
thursday: us ppi and core ppi data
friday: fed chair kevin warsh speech
expect some serious market volatility this week!
if the economic data comes in better than expected we could see a strong market rally.
post-image
$VET VETUSDT Traders watch VeChain 10% upside
The price is moving within a descending channel on the 1-hour timeframe; it has reached the lower boundary and appears poised for a rebound, suggesting a potential upward move upon retesting this level.
The Relative Strength Index (RSI) indicates a bearish trend, but an upward breakout is likely due to oversold conditions on the 1-hour chart.
An orange trend line supports the potential upward rebound.
There is initial support at 0.007350, acting as a primary support zone.
A key support zone (marked in green) exists at 0.007123; the price has reboun
post-image
VET+0.46%
BTC’s Coinbase premium has been negative for 19 consecutive days, currently at -0.12%, indicating that U.S. spot buying remains weak.
My view: ETF inflows do not necessarily mean that spot demand is broadly recovering. If BTC rebounds while the premium continues to weaken, it suggests that buying support may be insufficient, so caution is warranted regarding a pullback after a rise.
Short-term focus: whether the premium can move back above zero, whether spot trading volume increases, and whether BTC can hold key support levels. A negative premium is not a standalone short signal, but if prices
BTC+0.52%
Can this kind of image be posted?
post-image
Load More

Join 40 M users in our growing community

⚡️ Join 40 M users in the crypto craze discussion

💬 Engage with your favorite top creators

👍 See what interests you

Trending Topics

GateWCTCS9GlobalTradingCompetition

35.02k Views5.29k Discussing

Gate WCTC S9 Global Trading Competition is officially live, crossing asset boundaries across crypto, stocks, and CFDs with an 8M USDT total prize pool. The Lucky Launchpad guarantees a win every time, new users get a 20 USDT futures voucher upon registration, and the Event Contract PK tournament features a prize pool of up to 400,000 USDT.[👉 Read announcement](https://www.gate.com/announcements/article/102133)

GateXRedBullWinsSingaporeGP

172.94k Views6.43k Discussing

WillYouBuyDipInKoreanStocks

61.39k Views1.77k Discussing

View More