

Share your thoughts
placeholder
Article
Let’s just say Robinhood has been good
Wanna give some back to the guys that are here grinding each and every day
Find me them
post-image
HOOD-2.12%
Everyone’s long XRP, but this 4h setup says the rug is already being pulled.

$XRP /USDT - SHORT

Trade Plan:
Entry: 1.4119 – 1.4165
SL: 1.4361
TP1: 1.3978
TP2: 1.3868
TP3: 1.3704

Why this setup?
- Price is pinned at 1.4142 with a hard ceiling of 1.4165—rejection zone is razor thin.
- 1D trend is range, not breakout, so 55% SHORT confidence is the edge here.
- RSI 15m at 56.86 shows weak momentum—no fuel to break the range high.
- TP1 at 1.3978 is only 1.2% away; TP3 at 1.3704 is a 3% drop in a dead market.
- Invalidation at 1.4049 means the floor is already cracking under your fee
XRP+1.09%
JUST IN: Long-term holding can beat timing, as Bitcoin’s annual gains cluster in a few days. Across 2010–2026, removing the top 10 days often flips profitable years to losses; 2019 would be -40% without its top days. $BTC
post-image
BTC+0.05%
[$牛来 Signal] 1H Funding Rate Anomaly + 4H MACD Bullish Expansion, Targeting the Pullback Low
$牛来 4H MACD histogram widened to 0.0056, while the 1H funding rate was elevated at 0.0633%. The price pulled back from 0.14079 to 0.12569, landing right at the upper edge of the recommended entry zone. Buy orders are supporting around 0.1253, while order book depth imbalance is -38.38%, indicating that selling pressure has not been fully absorbed.
🎯Direction: Long
⚡Entry/Limit Orders: 0.1253129 - 0.1256900 (dip-buy within the range at the current price)
🛑Stop-loss: 0.1244331
🚀Target 1: 0.1275754
🚀T
post-image
牛来+35.80%
BTC+0.05%
ETH+1.05%
SOL+1.57%
#Robinhood Chain Records $3.7B in Daily DEX Volume
Robinhood Chain just hit a record $3.7B in 24-hour DEX volume, briefly surpassing Ethereum and Solana in daily activity.
But the 30-day picture remains different:
• Robinhood Chain: $23.09B
• Solana: $64.54B
The record is notable. The bigger question is whether Robinhood Chain can sustain this level of on-chain activity.
Record volume is a signal. Sustained volume is the real test.
#Robinhood #DeFi #Crypto $ETH
post-image
ETH+1.05%
  • 1
Everyone’s staring at LTC’s 54.17—but the real trap is the 1D range you’re ignoring.

$LTC /USDT - SHORT

Trade Plan:
Entry: 54.02 – 54.32
SL: 55.99
TP1: 52.81
TP2: 51.90
TP3: 50.54

Why this setup?
- 4h bias is SHORT with 77.4 confidence, yet 1D is sideways—that’s a coiled spring, not a free fall.
- Entry at 54.17 sits mid-range; RSI 15m at 49.81 shows zero momentum—no buyers, no sellers, just dead air.
- Why now? ATR 1h (0.58) is tight, but TP1 at 52.81 is a 2.5% drop that only triggers if 54.02 breaks. If it holds, the alt scenario flips to 55.22.
- The range ceiling (55.99 SL) is
LTC+6.11%
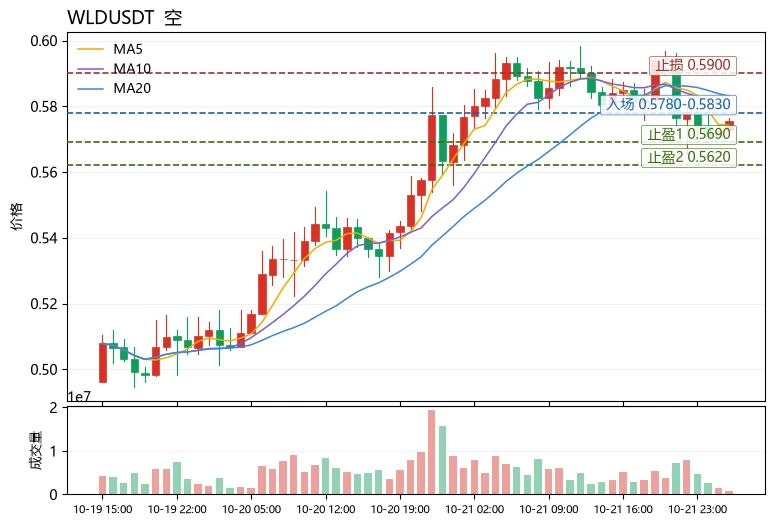
Nobody’s watching $ESPORTS /USDT while it silently sets up a 95%-confidence trap.

$ESPORTS /USDT - SHORT

Trade Plan:
Entry: 0.01482 – 0.01490
SL: 0.01525
TP1: 0.01457
TP2: 0.01437
TP3: 0.01408

Why this setup?
Why now?
- 4H bias is SHORT with 95% confidence—that’s not a guess, that’s a loaded gun.
- Daily trend is bearish, and the 15m RSI at 60.2 is giving a dead-cat bounce, not a reversal.
- Entry zone 0.01482–0.01490 sits right under the 1h pivot—price is kissing resistance that’s held all week.
- Targets are mapped: TP1 0.01457, TP2 0.01437, TP3 0.01408. That’s a 5% drop from h
ESPORTS+0.68%
$1000 to $100,000 Crypto Trade Challenge Today
live-cover
LIVE970
Feels good, brothers. But the position management is still the same: take profit on 80% first—don’t be greedy for the last bite. Move the stop-loss on the remaining 20% closer to the entry price and let it run; however much profit it makes is pure profit. Don’t turn unrealized gains into losses.

$ETH $LAB
post-image
ETH+1.02%
LAB+2.32%
I originally wanted to cut my losses as a sacrifice to the heavens, but the sacrifice never happened—the meat roasted itself. When I checked the chart after lunch, $SKHYNIX was grinding around 1235.91 and testing my patience. One look at that lower wick told me everything: this was a textbook pullback holding support, with bottom-fishing bids absurdly strong.

The thinking at the time was very simple: hold as long as the key level stayed intact, and leave only if it broke. Who could have imagined it would surge straight to 1276.07 in the afternoon, sending paper profits soaring to +229.4%? T
post-image
SKHYNIX+0.10%
BTC+0.03%
SOL+1.57%
Everyone’s long $CL /USDT at 91.78—except the 4h tape just whispered a secret.

$CL /USDT - SHORT

Trade Plan:
Entry: 91.69 – 91.87
SL: 92.60
TP1: 91.17
TP2: 90.76
TP3: 90.14

Why this setup?
Why now?
- 1D is range-bound, so no breakout fuel—only mean reversion.
- 15m RSI at 60.4 is fading; momentum is stalling right at resistance.
- ATR (1h) at 0.34 means tight stops—but TP1 at 91.17 is a 0.6% drop that respects the range floor.
- Confidence is weak (55), so this is a scalp, not a saga.

Debate:
Are you fading the 91.78 pop for TP1, or does the range fake you out into 92.39 first?
CL+0.88%
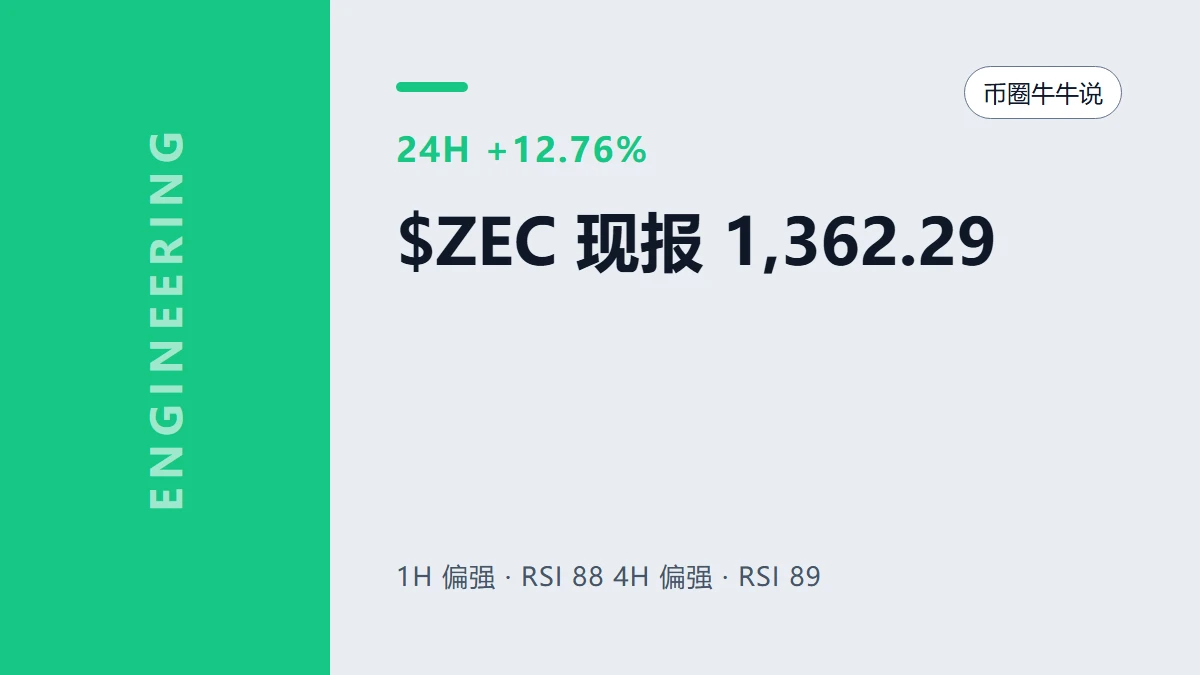
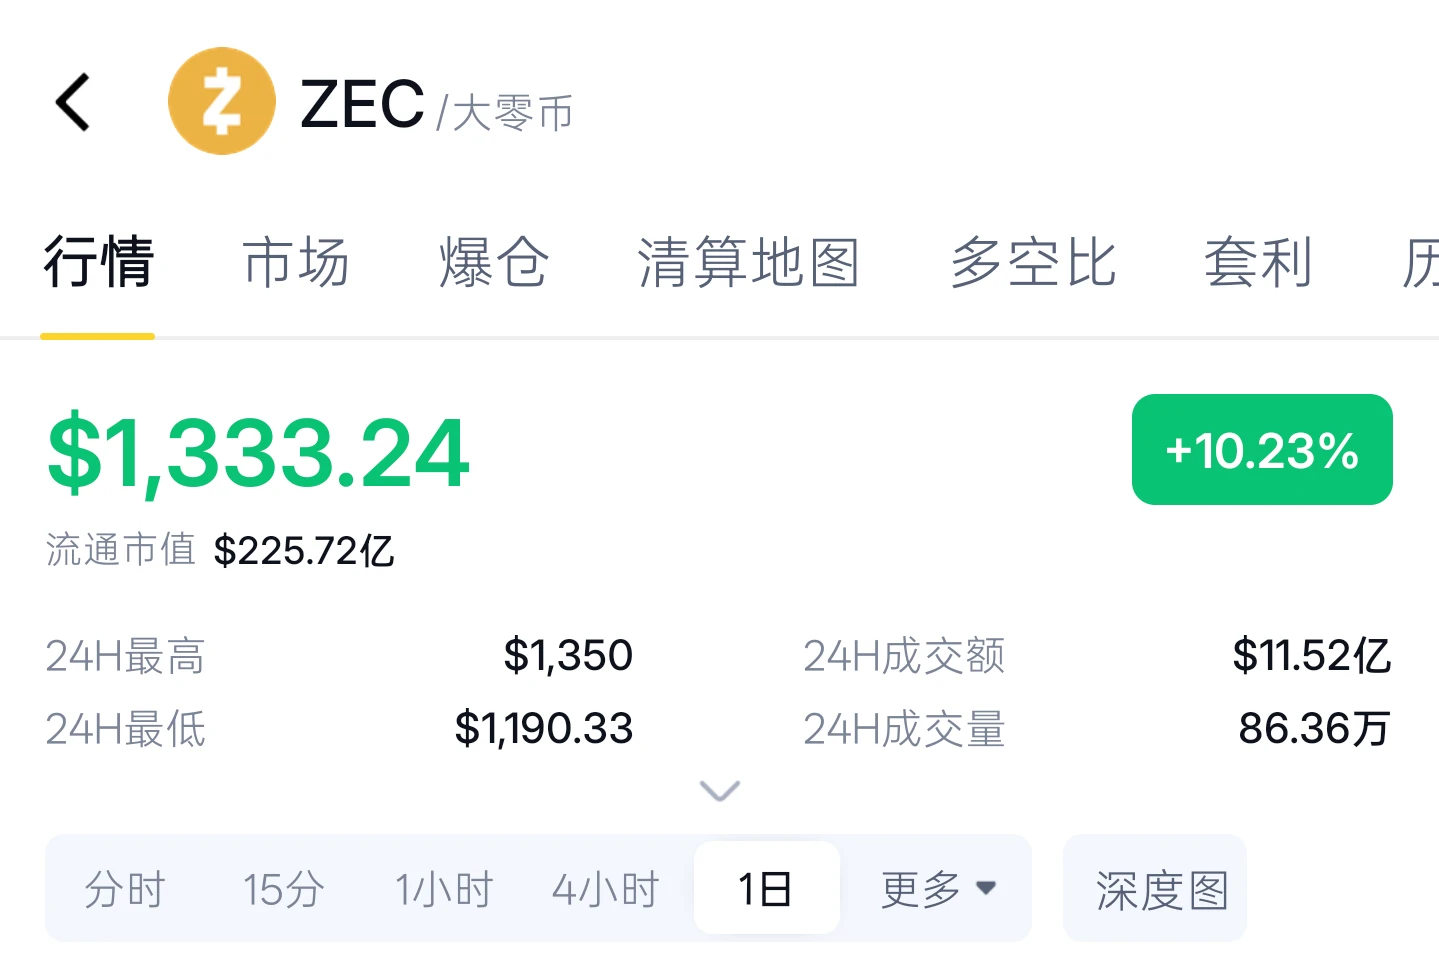
Everyone’s chasing the next 100x, but ZEC just printed a 95% confidence LONG signal while retail is asleep.

$ZEC /USDT - LONG

Trade Plan:
Entry: 1002.66 – 1010.92
SL: 967.12
TP1: 1036.55
TP2: 1056.38
TP3: 1086.14

Why this setup?
- 4h structure aligns with the daily bullish trend, but the 15m RSI (36.18) is oversold—this is the classic "pullback in an uptrend" setup.
- Entry zone is tight (1002–1010), giving us a low-risk trigger right at the 1h pivot (1006.79).
- Why now? The ATR (16.53) suggests volatility is compressing—breakout fuel is building. Target 1 is 3% away, but TP2 (1056)
ZEC-1.52%
If you're reading this & you sell cash secured puts... I need you to do one thing.
Add up every dollar of cash you've had parked as collateral over the last 5 years.
Now pull up the $Q chart for those same 5 years.
That's what your collateral missed.
Not what you lost. What you never got. It doesn't show up on any statement, there's no red number, so nobody ever counts it.
You won your trades. Most puts expired, you kept the premium, high fives.
BUT! your collateral sat next to one of the best 5 year runs in history earning essentially nothing.
I ran the same trades. Same strikes. Same premium
post-image
VOO-0.36%
But there is one type of person I don’t recommend chasing: those who only want to get in after seeing a rise. Entering at this level leaves them uneasy, and they’ll run at the first bout of volatility. Wait and see what the next round of structure brings. Putting risk control first is called rationality; cutting losses after taking a hit is called decisive loss-cutting. There will be more opportunities ahead. Opportunities are waited for, not snatched.
$SOL $DOGE
post-image
SOL+1.57%
DOGE+7.01%
Bull-Bear Divide Deepens Around $82K! B.TOP Founder Sells All His BTC
live-cover
LIVE88
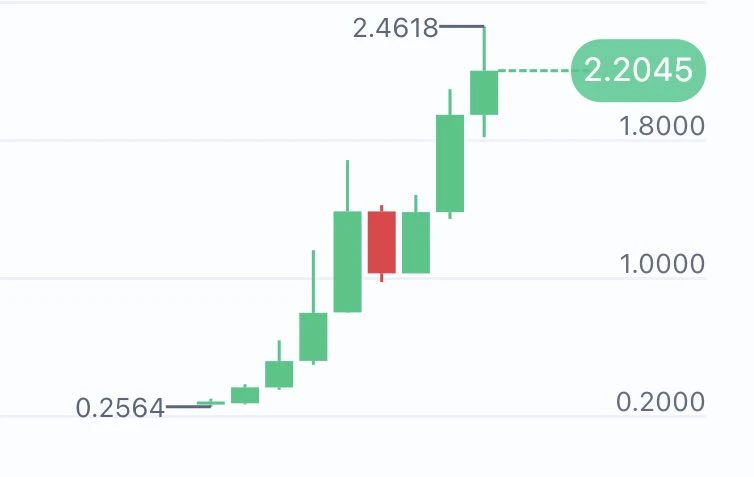
Everyone’s staring at the wrong side of NEAR while the 4H quietly flips the script.

$NEAR /USDT - LONG

Trade Plan:
Entry: 2.1670 – 2.1918
SL: 2.0599
TP1: 2.2690
TP2: 2.3287
TP3: 2.4183

Why this setup?
- My setup says LONG with 95% confidence, yet the 15m RSI is bloodied at 38.57—that’s the classic “bullish shakeout” fingerprint.
- Price is parked at 2.1794, hugging the 1H ATR (0.0497) like a coiled spring. The 1D trend is still bullish, so this dip is the invitation, not the obituary.
- Why now? The “Waiting” status is the tell—the market is loading the cannon before TP1 at 2.2690 an
NEAR+3.11%
Watching the price push higher, outsiders are anxious to chase, while those already holding positions are also torn over whether to exit. The approach for this $PROLOGUE trade is simple: once the price entered a rapid rally, I took 70% off the table and set a protective stop for the remaining position, letting it run on its own. The reason is that the more rapid the rally, the faster the pullback often arrives. By putting the bulk of the profit in the pocket first, it becomes easier to view subsequent volatility calmly.
Looking back at the entry point, the decision to go long was fairly clear
post-image
PROLOGUE-27.36%
LAB+2.32%
BTC+0.03%
Everyone’s staring at H/USDT’s bounce—but the 4H tape just whispered a secret that 95% of traders will ignore.

H/USDT - SHORT

Trade Plan:
Entry: 0.07631 – 0.07705
SL: 0.08024
TP1: 0.07401
TP2: 0.07222
TP3: 0.06955

Why this setup?
- RSI (15m) is pinned at 33.52—weak momentum, not oversold enough to reverse a bearish 1D trend.
- ATR (1h) at 0.001485 means volatility is contracting—perfect setup for a liquidity sweep below 0.07631.
- With TP1 at 0.07401 and TP2 at 0.07222, the path of least resistance is down, not up.
- Why now? The 0.07960 invalidation is miles away, giving shorts ro
ADA’s 4h chart is whispering a secret the 1D range refuses to scream—until now.

$ADA /USDT - SHORT

Trade Plan:
Entry: 0.2202 – 0.2214
SL: 0.2265
TP1: 0.2165
TP2: 0.2137
TP3: 0.2094

Why this setup?
Why now?
- RSI 15m at 65.33 shows a micro-pump into resistance—exhaustion fuel for shorts.
- Entry zone 0.2208 sits at range highs; ATR 0.0024 means tight stops, big payoff.
- Confidence 55 isn’t 90—it’s a scalp, not a marriage.
- TP1 0.2165 is a 2% drop; TP3 0.2094 is the real meat if the range breaks.
- If 0.2265 flips, alt targets say 0.2251+—but that’s a different trade.

Debate:
ADA+3.15%
Load More

Join 40 M users in our growing community

⚡️ Join 40 M users in the crypto craze discussion

💬 Engage with your favorite top creators

👍 See what interests you

View More