
Share your thoughts
placeholder
Article
$PUMP
UPDATE
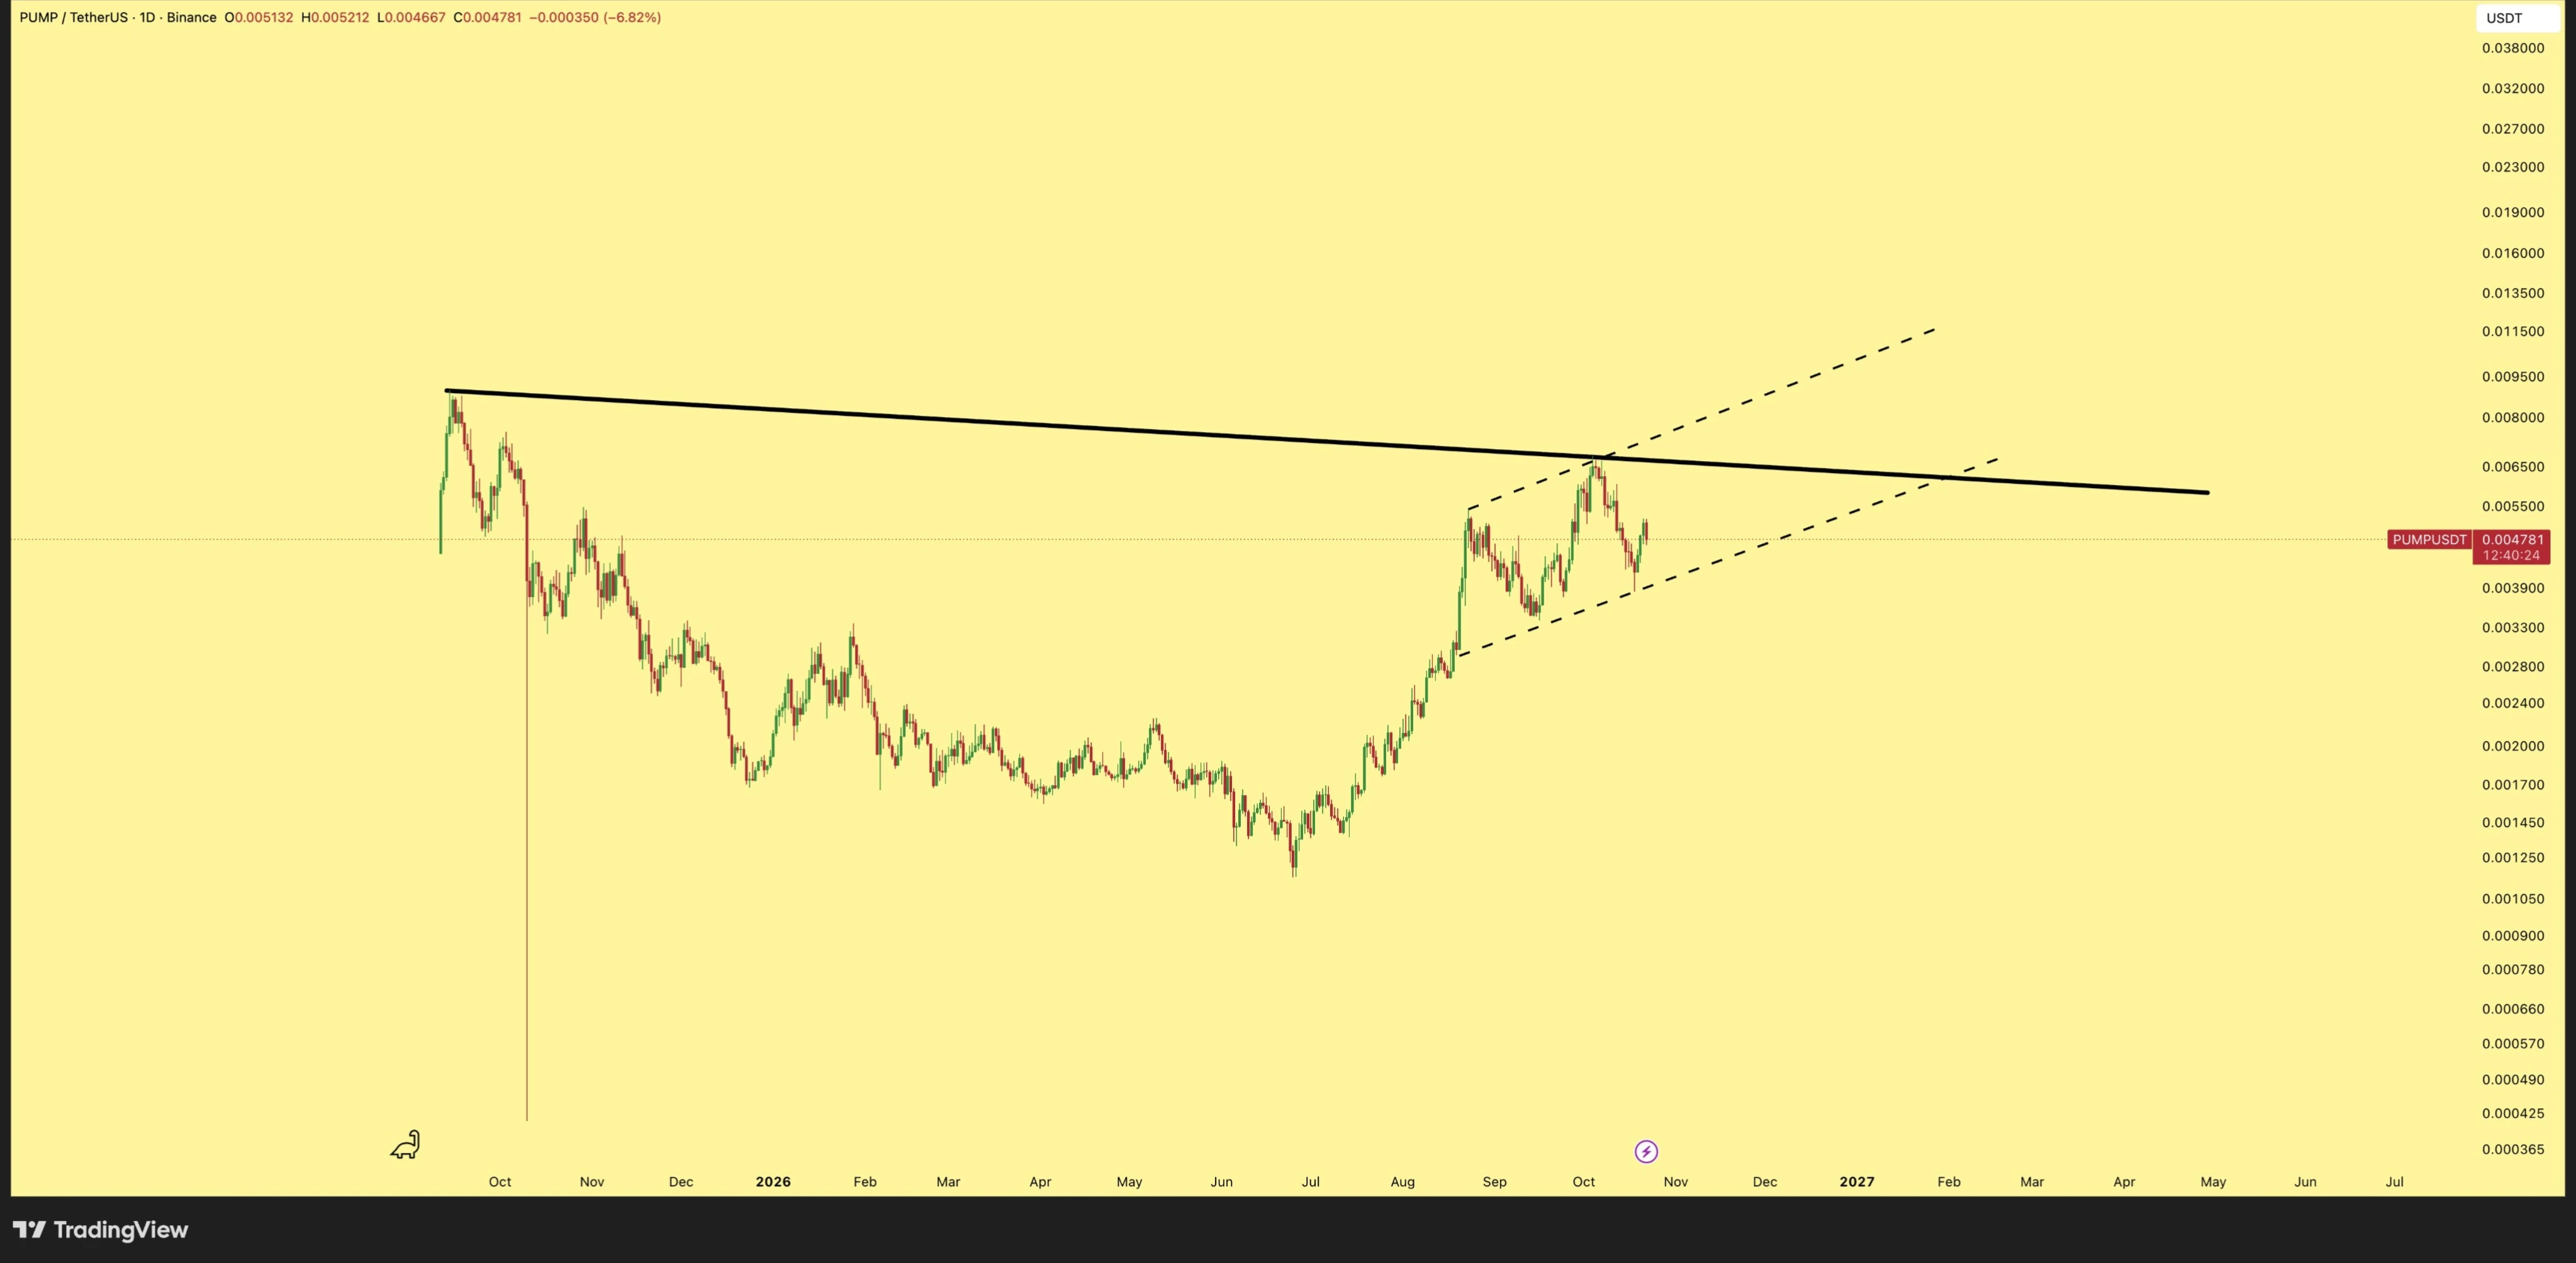
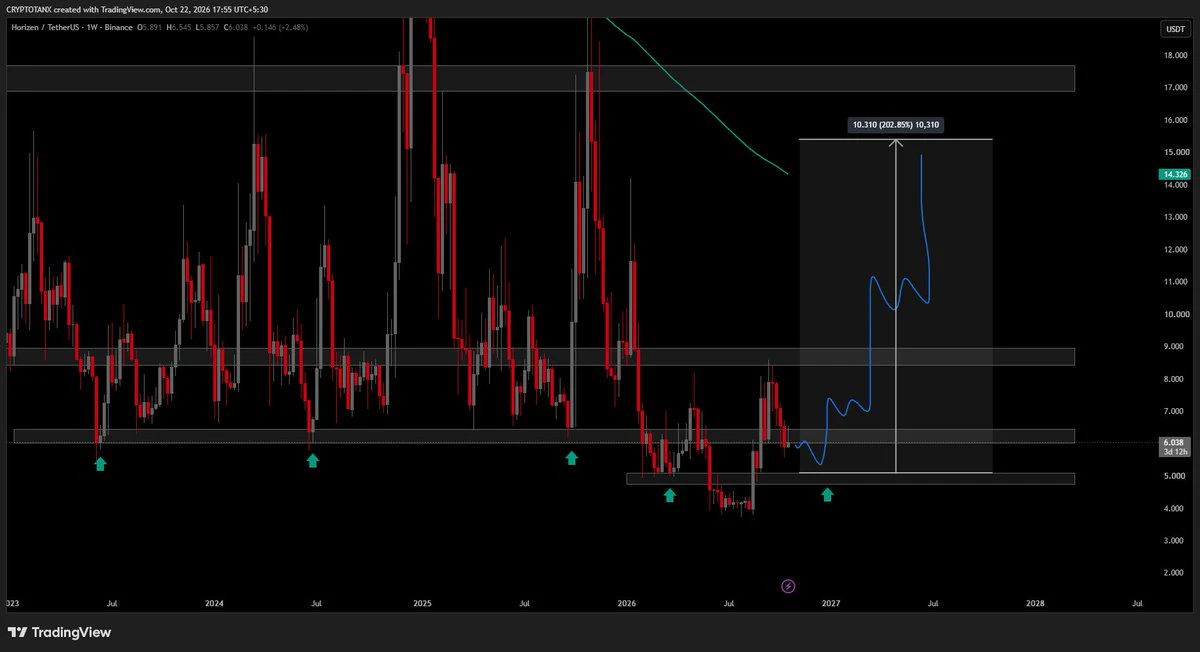
#PUMP is getting a good support here. In this move we can see 60%+ gain here ✍🏻
#PUMPUSDT #PUMPBTC #BTC #Bitcoin #NFTs
post-image
PUMP+11.02%
PUMPBTC-2.68%
BTC-0.82%
#RedBullTradingTourSeason6
🏎️ RED BULL TRADING TOUR PHASE 6 — THE RACE IS ON!
Phase 6 of the Red Bull Trading Tour is now live, giving traders another opportunity to turn consistent participation into mileage, rankings, rewards, and even an F1 experience.
This campaign is built around a simple racing mindset: every eligible activity can move you forward. Instead of focusing only on trading volume, participants can take part in different tasks, build their progress, and compete for a share of a 60,000 GT prize pool.
One of the standout features of Phase 6 is the availability of GT airdrops wi
GT+2.85%
The hand that set the stop-loss a few days ago trembled slightly; this morning I realized that was unnecessary filial piety.
During the repeated intraday swings, $KALSHI spent a long time grinding along the upper boundary. The price looked firm, but trading volume kept thinning. The higher it went, the less sincere it looked; this kind of low-volume push higher often needs a bearish candle to bring it to an end. After placing a short at 27.520, I didn’t keep adjusting it, set the stop-loss above a key level, and went off to do other things. When I came back just now, the price had already fal
post-image
KALSHI-0.65%
DOGE+0.70%
SNDK+0.15%
Recently, $ZEC triggered a massive short squeeze following the listing of Grayscale’s spot ETF (ZCSH), with the price surging to around $1,250 and $34 million in shorts being liquidated. But once the bullish news materialized, it became bearish; after the high-leverage long positions ran out of funds, the price quickly retraced.
I decisively entered a 75x short at an average entry price of 1211.01. The exhaustion of buying pressure triggered a cascading sell-off, sending the price down amid volatility to the latest price of 1155.48.
The position currently has an unrealized profit of +325.36%.
post-image
ZEC-4.96%
BTC-0.81%
ETH-0.08%
Nobody is talking about $USELESS /USDT while the 1h RSI sits at 50.17 and the daily trend screams bullish.

$USELESS /USDT - LONG

Trade Plan:
Entry: 0.22217 – 0.22877
SL: 0.19378
TP1: 0.24924
TP2: 0.26509
TP3: 0.28886

Why this setup?
Why now? The 1h price of 0.22547 aligns with the entry zone, and the 15m RSI at 50.17 shows momentum balanced enough for a clean push. The daily trend is bullish, which means the 1h ATR of 0.013206 is setting up a measured move toward TP1 at 0.24924. If that breaks, the structure targets TP2 at 0.26509, and a continuation would aim for TP3 at 0.28886. The inv
USELESS+1.51%
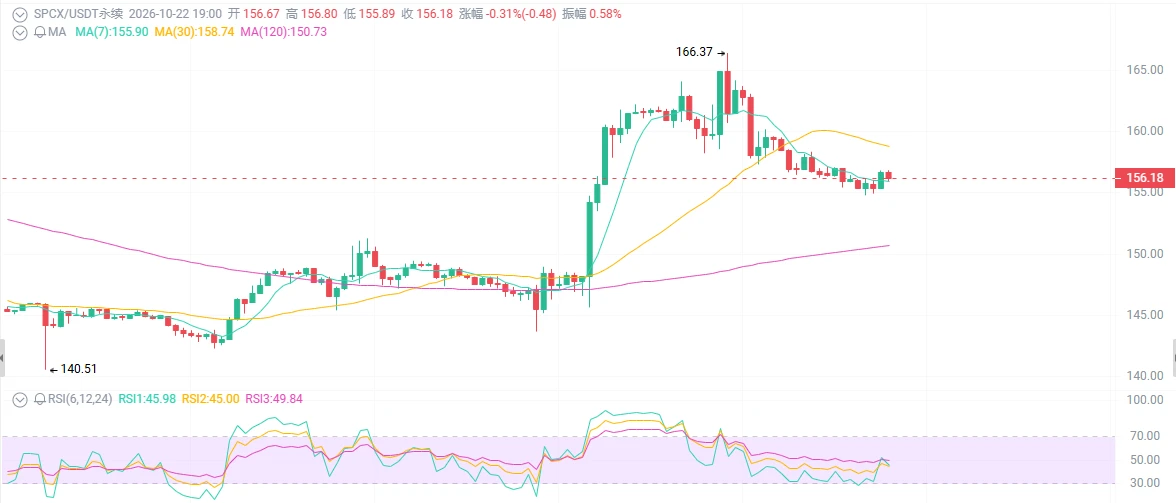
$SPCX /USDT is range-bound on the daily trend but the 1h ATR whispers a short is forming.

$SPCX /USDT - SHORT

Trade Plan:
Entry: 150.04 – 150.28
SL: 151.35
TP1: 149.27
TP2: 148.67
TP3: 147.78

Why this setup?
Why now? The daily trend is range, which means the 1h price of 150.16 sits at a natural magnet for mean reversion. The 15m RSI reading of 48.86 confirms the short-term momentum is neither oversold nor overbought, allowing a clean entry within the 150.04 to 150.28 zone. The 1h ATR of 0.496517 quantifies the volatility contraction before a potential snap-back toward TP1 at 149.27. If t
SPCX-0.53%
With this trend, I don't even need to think—the account is dancing on its own.
A few days ago, before bed, I already felt that $SKHYNIX was acting strange. The rebound was weak, but the pullback was also shallow—a classic case of both bulls and bears waiting for direction. When it kept oscillating intraday, I said that when a range is compressed to the extreme, either nothing happens, or once it breaks, there will be a major move. I entered directly at 1235.91 and waited for the wind.
When I looked this morning, wow—it shot straight up to 1338.97, +592.1%. Those who were already in the trade s
post-image
SKHYNIX+3.70%
SNDK+0.15%
BNB-1.54%
$1000 to $100,000 Crypto Trade Challenge Today
live-cover
LIVE1,563
SKL pump pump big pump ath hype go
post-image
SKL+1.58%
PUMP+11.02%
HYPE-2.77%
Everyone is about to find out what happens when SYMBOL breaks 88.061.

$HYPE /USDT - LONG

Trade Plan:
Entry: 85.245 – 85.679
SL: 83.383
TP1: 87.021
TP2: 88.061
TP3: 89.620

Why this setup?
Why now? The daily trend is bullish, setting the stage for continuation higher. The 1h price sitting at 85.462 aligns perfectly with the entry_ref, giving us a precise spot to initiate. The 15m RSI at 48.31 shows room to run without being overbought, while the 1h ATR of 0.866321 confirms enough volatility to reach TP1 at 87.021 and push toward TP2 at 88.061. The invalidation level at 83.595 is the line i
HYPE-2.77%
I originally wanted to cut my losses as a sacrifice to the heavens, but the ritual failed and the meat roasted itself. When the sell-off started in the early session today, $TAO bounced back to around 277.1, and I immediately felt something was off. Every push upward was weaker than the last, and the volume kept fading. This kind of move isn’t accumulation of strength—it’s selling pressure slowly building up. A rebound without enough support is, bluntly, just handing ammunition to short sellers.

The price is now at 261.4, and +271.11% has been realized. Honestly, it moved more smoothly than
post-image
TAO-2.61%
ETH-0.08%
XRP-1.53%
I just switched the app to the background, and it shot straight down—are you playing hide-and-seek with me? ⚡

During the repeated intraday swings, the signal I saw was crystal clear: every surge fell just short, and selling pressure was incredibly heavy. Resistance overhead was obvious; this kind of fake breakout can't fool anyone watching the trading volume.

That 0.20941 short position is now 0.04575, with +1538.53% secured. Nailed the rhythm—feels good, brothers. 📉

Markets are waited out, and profits are held onto. Panic comes from having no plan; losses come from overthinking.

Take
post-image
SNDK+0.15%
DOGE+0.70%
Insiders are calling ZEC the next quiet breakout, but the price has not moved yet.

$ZEC /USDT - LONG

Trade Plan:
Entry: 1151.48 – 1163.06
SL: 1101.65
TP1: 1198.99
TP2: 1226.80
TP3: 1268.52

Why this setup?
Why now? The daily trend is already bullish, the 1h ATR of 23.176898 shows enough volatility for a clean push, and the 15m RSI at 41.12 signals room to run before overbought. The entry zone anchored at 1157.27 sits inside the 1h price, with TP1 at 1198.99 and TP2 at 1226.80 offering stacked targets. The invalidation level of 971.33 is the hard line in the sand that protects the position
ZEC-4.96%
Insiders are quietly setting shorts on DOGE while the 1h price sits at 0.08975.

$DOGE /USDT - SHORT

Trade Plan:
Entry: 0.08950 – 0.09000
SL: 0.09220
TP1: 0.08792
TP2: 0.08669
TP3: 0.08486

Why this setup?
Why now? The daily trend is range-bound, which favors short reversals at the top of the range. The 15m RSI reading of 48.07 shows the 1h price is neutral, not overbought, so a move lower is not out of character. The 1h ATR of 0.001019 means the average hourly swing is roughly that size, giving the entry zone of 0.08950 to 0.09000 a realistic trigger for a breakdown. TP1 at 0.08792 and TP
DOGE+0.70%
Everyone is watching gold but silver is about to break lower.

$XAG /USDT - SHORT

Trade Plan:
Entry: 66.24 – 66.38
SL: 66.97
TP1: 65.82
TP2: 65.49
TP3: 65.00

Why this setup?
Why now? The 1h price is sitting at 66.31 inside a tight entry zone between 66.24 and 66.38, and the 15m RSI at 54.76 shows the market is not yet overbought, leaving room for the short to run. The daily trend is range-bound, which means a breakdown from this range is more likely than a continuation, and the 1h ATR of 0.273073 confirms enough volatility to push through 65.82 and reach the deeper target at 65.49. The in
XAG+0.09%
While I was away using the restroom, I came back to find the candlestick chart had already wiped out my losses for me. $BTC This move ground people down until they had no patience left, then once it finally took off, it was fast and fierce. The position entered at 63014.1 was pushed to 79278.2, bringing in +4488.29%—feels great.

During the intraday plunge, I watched the minute chart: the key level held, the bottom moved sideways, and buying pressure kept strengthening. I had only one thought at the time: at this level, I wasn't afraid to enter again. And the market gave me the answer.

A q
post-image
BTC-0.81%
ADA-0.05%
LAB-1.99%
can't have nice things these days
LTC is range-bound but a SHORT setup is quietly forming underneath

$LTC /USDT - SHORT

Trade Plan:
Entry: 54.79 – 55.25
SL: 57.21
TP1: 53.38
TP2: 52.28
TP3: 50.64

Why this setup?
Why now? The 1h price sits at 55.02 inside the entry zone of 54.79 to 55.25, and the 15m RSI at 43.59 shows bearish momentum without being overextended. The 1h ATR of 0.911989 means each candle carries enough volatility to push through the entry zone and reach TP1 at 53.38, with TP2 at 52.28 as the next realistic target. The daily trend is range, which favors fading moves rather than trend continuation, so a shor
LTC+1.78%
In the middle of the night, my friend misread the address... and asked if I had 20,000 BNB.
I really want to instantly earn 20,000 BNB and then casually say, “I don’t need a lot of money; I need a lot of love.”💔
post-image
BNB-1.49%
Load More

Join 40 M users in our growing community

⚡️ Join 40 M users in the crypto craze discussion

💬 Engage with your favorite top creators

👍 See what interests you

View More