
Share your thoughts
placeholder
Article
$SOL Short】4H middle-band resistance, 1H upper-band test
$SOL The 1H Bollinger upper band is 98.7990, while the current price at 98.85 is hanging at the edge; selling pressure above the 4H middle band at 99.6005 has not eased. Order book depth is -0.56%, with a buy/sell ratio of 0.99, and aggressive buy orders lack sufficient depth. The 1H MACD histogram is expanding at 0.2614, while the 4H MACD histogram is contracting at -0.0467, with short-term bullish momentum running into the 4H bearish structure. EMA20 1H is 97.8976 and EMA50 1H is 98.5330; the current price has moved too far from the m
post-image
SOL+2.83%
Volatility has compressed to 2.24%—is this the calm before the storm or a breeding ground for a trend?
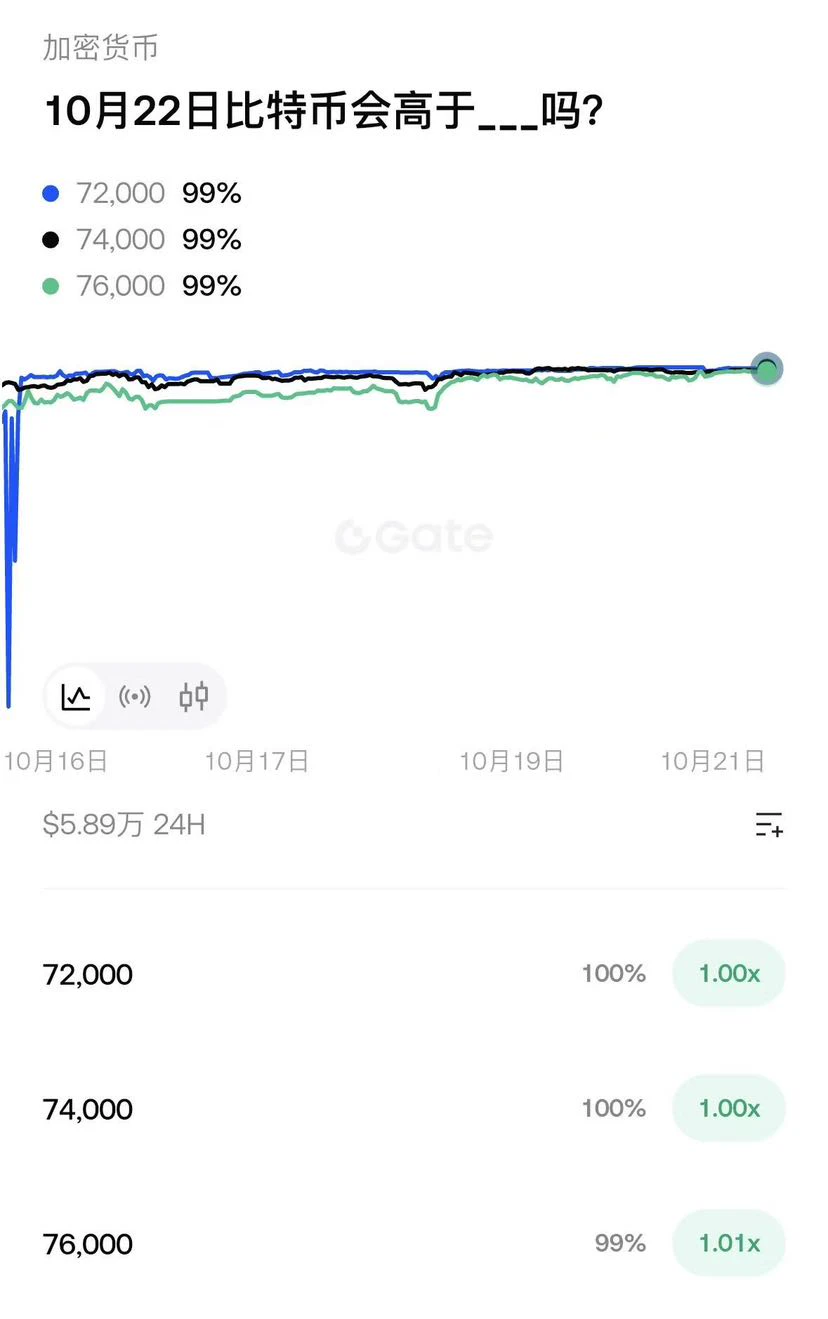
The answer depends on whether your position can withstand a false breakout. $BT The current price is 76384, MA5=76196.6 has crossed above MA20=75961.1, the MACD histogram at +101.9 is maintaining its bullish bias, RSI 55.8 is in the neutral-to-strong zone, and the Bollinger upper band at 76461.7 is right overhead—this is a standard range-bound bullish structure. But note: the amplitude across 30 K-lines is only 2.24%, and the Bollinger Band width has narrowed to an extreme, meaning a directi
XRP+0.40%
CT declared ARC dead after a 17 September 2026 live stream sparked social panic over developer identities and unverified rug-pull fears 💥🗣️
Meme tokens dumped 40% to 75% in 12 hours, with critics hastily writing off the network before day two 🛑📉
Yet jumping to conclusions so early ignores recent history 📜👀
When @RobinhoodApp launched its network on 1 July 2026, it suffered an identical baptism of fire: its top meme token collapsed, its main launchpad Noxa suddenly vanished after leaving $12M in fees, and critics declared the chain finished 🥊📉
While sentiment claims @arc already lost it
ARC-3.76%
MEME+1.45%
UNI+7.11%
Affected by the failure of a key procedural vote on the CLARITY Act, among other factors, the crypto market is broadly trending downward. The PayFi sector fell 8.44% in 24 hours, while XRP (XRP) and Stellar (XLM) fell 10.38% and 10.66%, respectively. Meanwhile, Bitcoin (BTC) fell 3.17%, briefly dropping below $75k during the session before recovering to $75.6k; Ethereum (ETH) fell 4.88%, dropping below $2,400.
post-image
XRP+0.41%
XLM+3.58%
BTC+0.86%
ETH+1.42%
#Bots I'm trading ETHUSDT with the Futures Grid bot on Gate. Join me!
post-image
  • 6
  • 2
First, the invalidation condition: if $SNDK recovers 1563.17 on increased volume and the daily candle closes above it, I’ll admit this short trade was wrong.

But until then, I choose to continue holding. After the price pulled back from the high, each rebound failed to surpass the previous high, while the key levels kept getting lower, forming a very standard downtrend structure. The moving averages are bearishly aligned, SNDK is trading below the zero axis, and there are no signs of a bullish momentum shift. I entered the short near a key level during the rebound, with +138.3% unrealized pr
post-image
SNDK+0.04%
SOL+2.83%
BTC+0.87%
#美联储三年来首次加息25个基点 #Gate广场中秋团圆局 The rate hike is in—what next? How many more times can Bitcoin’s “bad news priced in” script play out?
The shoe has dropped. On September 17, the Federal Reserve raised interest rates by 25 basis points to 3.75%-4.00%, the first hike since July 2023.
CME data showed that the market’s pricing probability for a hike surged from 87% to 92.5% ahead of the meeting—most people had known the outcome for a long time.
How did Bitcoin perform? It fell to $75,355 within an hour of the decision, then quickly rebounded to $76,513. It looked like the classic “bad news priced in
BTC+0.86%
  • 3
The overnight news-driven shock caused prices to rapidly spike up and down. The market is still in a low-level oscillation and recovery phase, while the overall weak downward structure remains intact, with multiple timeframes resonating bearishly. Daily timeframe: Prices previously declined with consecutive bearish candles. Although they have now entered low-level consolidation and have not yet made a new low, no strong bullish reversal candle has appeared. The rebound candles have relatively small bodies and failed to recover the ground lost in the previous decline, so the current consolidati
post-image
BTC+0.87%
ETH+1.39%
🎁 15,000 USDT Mid-Autumn Festival gifts continue—today we're talking about the $ARC chain!
New users can claim a red packet worth 100%, up to 5 USDT, plus an exclusive 1,000 USDT prize pool!
👉 Sign up now: https://www.gate.com/campaigns/6260
🔥 Day 3: #ArcEcosystemHotTokensSeeIncreasedVolatility
Post with #Arc生态热门代币波动加剧 + #Gate广场中秋团圆局 , share your views and win rewards!
📢 Today's Hot Topic
Interest in the Arc ecosystem has surged since the Arc mainnet launch, but ecosystem token volatility has intensified. On September 17, ARGUS fell over 40% in 12 hours, LONG fell over 70%, and COOL fell
post-image
ARC-3.76%
  • 8
  • 5

On the eve of the FOMC, the ETH short setup played out perfectly!
Where the line was drawn, the market went.
The direction was nailed throughout, with levels accurate to the decimal.
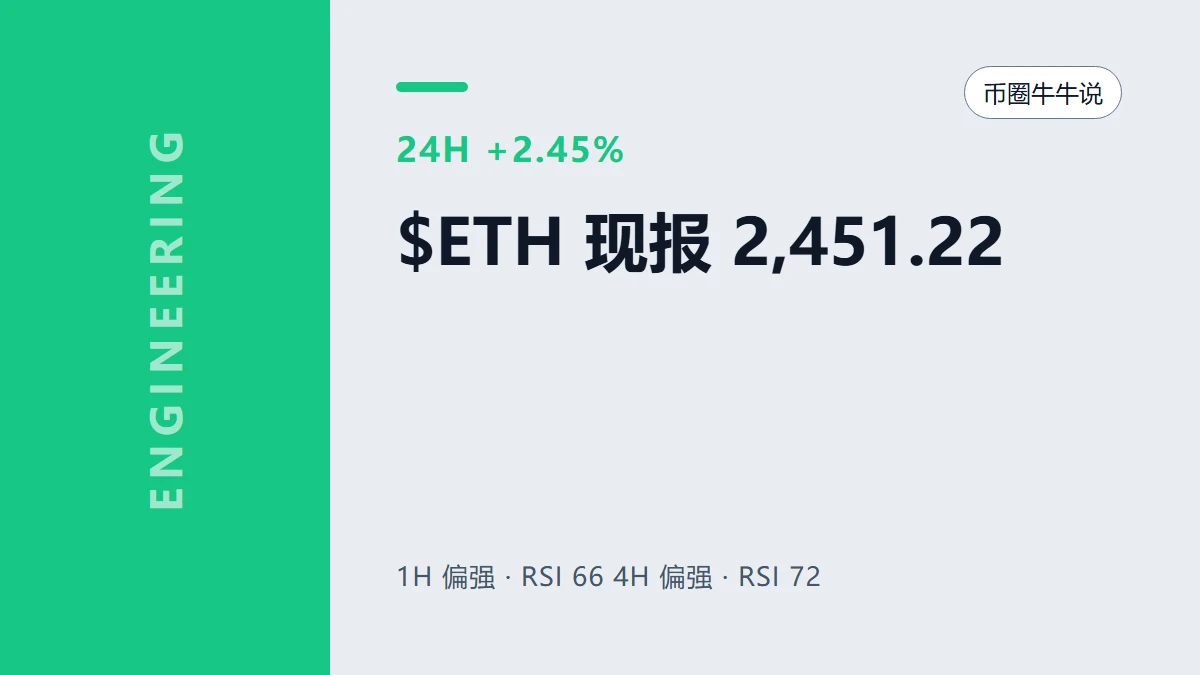
$ETH #美联储三年来首次加息25个基点
ETH+1.42%
A brief analysis of BTC’s short-term trend through Dow Theory, Chan Theory, Elliott Wave Theory, volume-price relationships, order flow, and price action
I. Dow Theory
Strong secondary rebound within a downtrend: The Dow mid-term structure (LH: 82,272→80,538→79,568; LL: 74,931) remains a downtrend, but the secondary rebound since September 16 has shown rare resilience: low 75,006 (higher than 74,931) → high 76,463 → retracement low 75,579 (higher low) → current new rebound high 76,586. A rebound structure with “continuously rising lows” is forming, and the rebound has recovered 70.7% of the la
BTC+0.86%
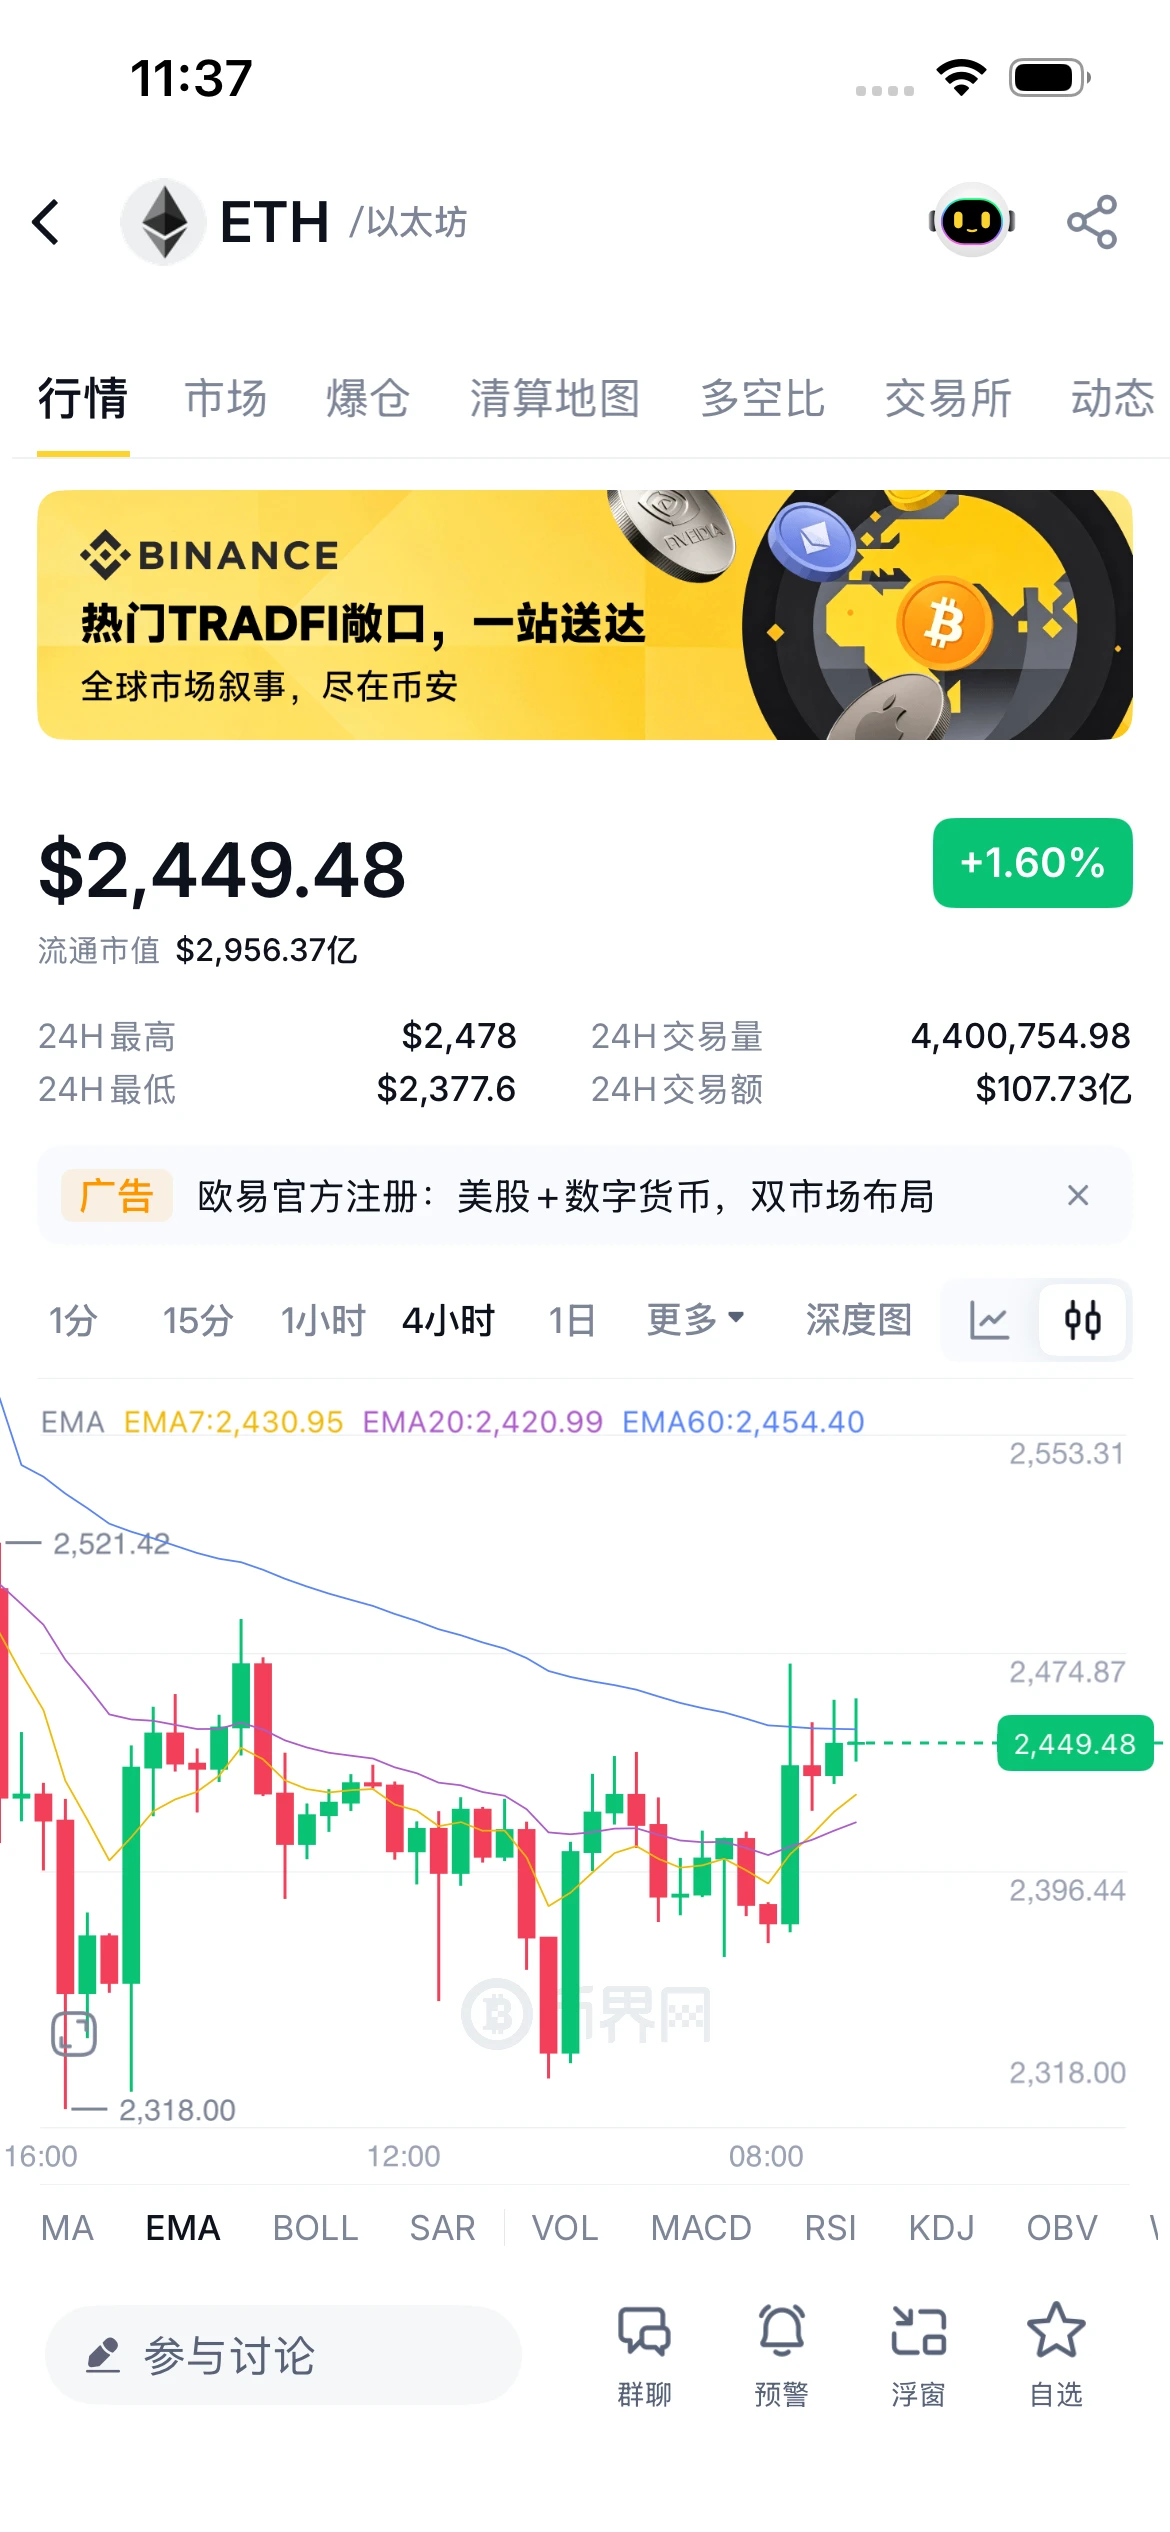
Ethereum is moving sideways
It’s very suitable for short-term trading
Watch the previous high and low
You can still make some profit by swing trading
I really don’t want to keep trading in and out
I’m afraid of missing the move and falling into a trap
I just made a short-term trade and took some profit
It was pretty good
I’m currently holding 0.5 ETH
As long as Ethereum doesn’t break below 2400
I won’t touch this long position$ETH
ETH+1.39%
9.17|SOL Short-Term Strategy
Short on a rebound to 99.3‑99.9, with defense at 100.5
Targets: 98.0 → 95.8

The 1-hour chart shows an oversold rebound recovery, but the overall downward structure has not reversed. The Bollinger Bands are narrowing, with concentrated resistance at 99.3‑99.9 and heavy selling pressure. Another decline is expected after the rebound encounters resistance.
Do not chase longs. Use strict stop-losses and manage risk carefully. #Gate广场中秋团圆局 #Solana生态Meme币普涨 $SOL
SOL+2.83%
☀️ GM! 25bp is served,
The market woke up first instead. ☕️
The rate hike has landed, but BTC didn’t stay down—the market is starting to recover upward.
👇 Do you think this cup of “rate hike coffee” can still keep you energized?
💬 Come chat on Gate Square:
https://www.gate.com/post.
post-image
GateSquare
☀️ GM! 25bp is served,
The market woke up first instead. ☕️
The rate hike has landed, but BTC didn’t stay down—the market is starting to recover upward.
👇 Do you think this cup of “rate hike coffee” can still keep you energized?
💬 Come chat on Gate Square:
https://www.gate.com/post.
repost-content-media
BTC+0.86%
🔴 $XRP SHORT SETUP
XRP is hovering around $1.30 with the $1.30–$1.31 area acting as resistance after the recent selloff. Selling volume remains elevated and a break below $1.28 could expose the $1.26 area.
Entry: $1.295–$1.310
TP1: $1.280
TP2: $1.268
TP3: $1.260
SL: $1.318
I’d want to see rejection around $1.30–$1.31 before considering the short. A reclaim above $1.318 weakens the setup.
#XRP #Crypto #Trading
$XRP ‌
post-image
XRP+0.40%
$ZEC I said some time ago that this person is an institution’s alt account! Look at his smart-money trades: he only started trading in May, and all his profits came from ZEC. He has already accumulated over 30 million in profits! Why post every day and generate hype? Because when retail traders see how much he has made, they can’t help but take the opposite side and short, ultimately becoming his fuel! 🤣 What do you guys think?
post-image
ZEC+22.07%
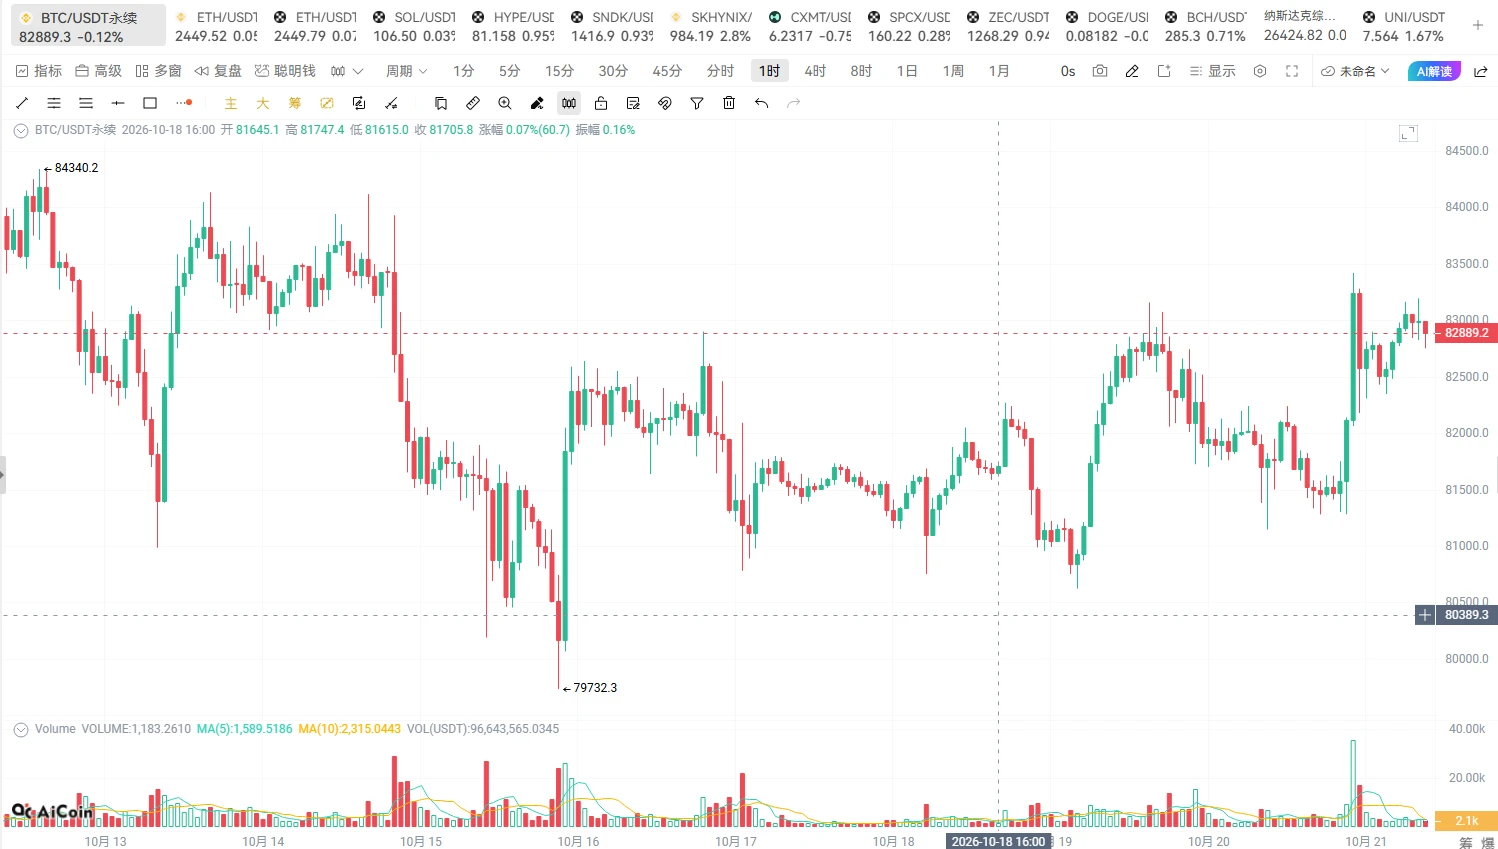
9.17 Bitcoin analysis
Analysis: Short near 76500-77000 on the rebound, with 77400 as the defense level; first target 75800, second target 75200
On the 1H chart, price has oscillated lower from the 77323.6 swing high, then began an oversold rebound recovery after dipping to the 74909.4 swing low. The price has gradually recovered and moved above the Bollinger middle band, with short-term bullish momentum somewhat restored, but the overall downtrend structure has not clearly reversed, so the rebound remains a consolidation recovery following the decline. The Bollinger Bands’ downward expansion h
post-image
BTC+0.86%
Load More

Join 40 M users in our growing community

⚡️ Join 40 M users in the crypto craze discussion

💬 Engage with your favorite top creators

👍 See what interests you

Trending Topics

FedHikes25bpsForFirstTimeIn3Years

30.28k Views6.11k Discussing

The Fed raised rates to 3.75%-4.00%, its first hike since July 2023, in a 12-0 vote. The dot plot signals another hike this year, with Warsh saying inflation is "too high and has lasted too long". BTC briefly fell to $75,355 before recovering near $75,800, down nearly 4% on the week; gold slid to $4,278, and all three major U.S. indices closed lower. Rate hikes are back — have you adjusted your positions?

GateTrenchesExclusive0GasTrading

45.79k Views564 Discussing

ArcEcosystemAndMemeCoinsPlunge

13.35k Views504 Discussing

View More