




















#BTC大跌 The $3.5 billion exchange theft is just a “smokescreen”! What really pinned BTC at $77,000 was economic data that was “too good to be true”
A hot wallet theft, CZ speaking out, more than $3 billion frozen—everyone is focused on the hacker. But what sent the price tumbling from $80,000 to $77,000 wasn’t those transfers; it was the same day’s GDP reading of 3.4% and core PCE reading of 3.1%.
I. First, the market: It wasn’t “the news” that fell—it was “leverage”
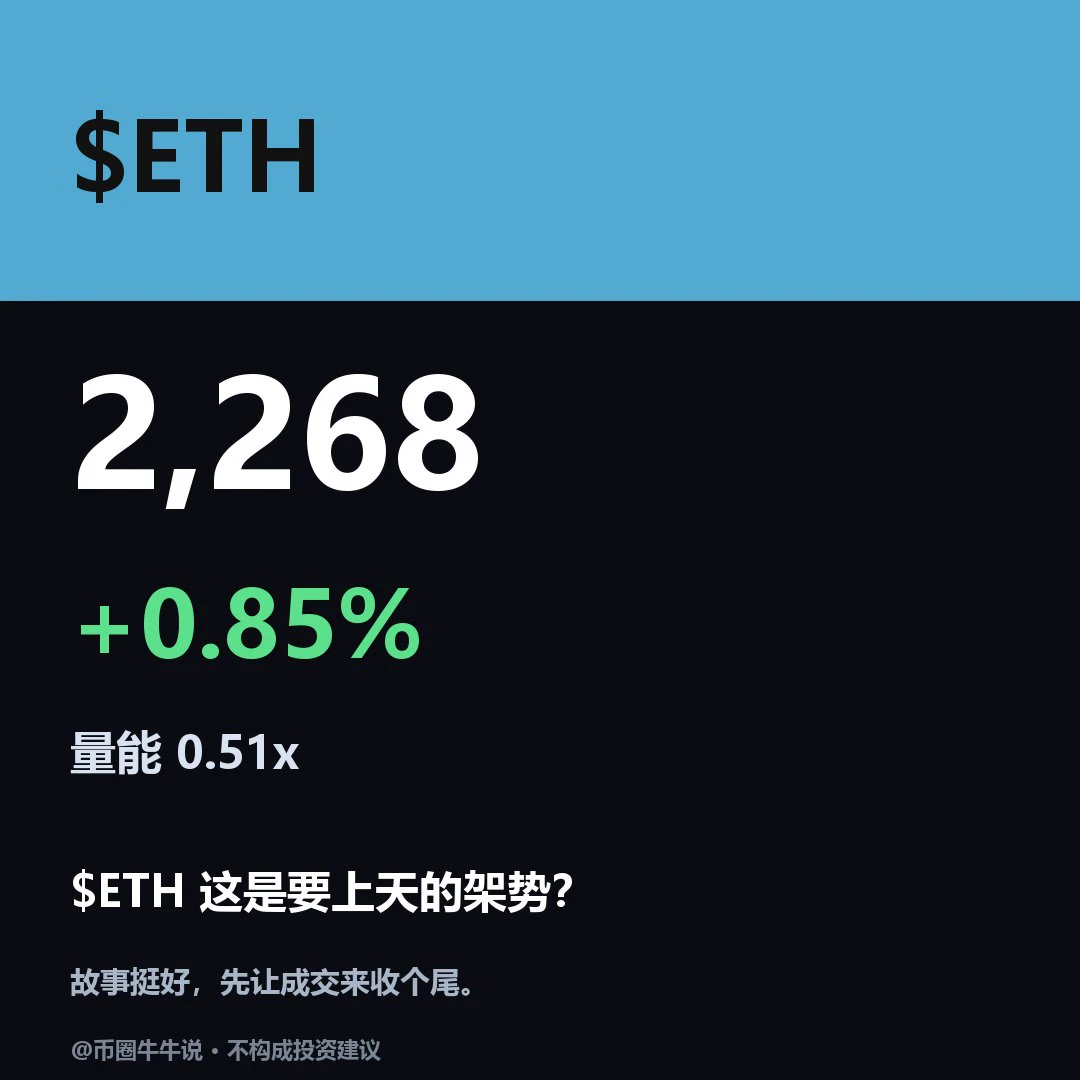
Over the past 24 hours, Bitcoin slid from around $81,000 to $76,769, down about 4.97%; Ethereum fell to $2,238, down 4.19%. Solana fell 5.35%, HYPE 3.46%, and XRP 2.75%.
Liquidation data are even more alarming than prices. About $1.347 billion was liquidated across the market over 24 hours, including $1.167 billion in long positions, or 86.68%—long liquidations were 6.5 times short liquidations. Bitcoin liquidations totaled $595 million, with longs accounting for 84%; Ethereum liquidations totaled $356 million, with longs accounting for 88%.
This wasn’t “panic selling in the spot market”; it was “leveraged longs being forcibly liquidated.” The drop to $77,000 was driven by liquidations, not a sudden deterioration in fundamentals.
II. The An'an incident: The amount was huge, but it was an “accelerant,” not the “engine”
According to blockchain intelligence platform Arkham, from 20:10 to 23:05 (UTC) on October 29, addresses associated with An'an's hot wallet transferred about $6.01 billion across nine chains, with about $4.9 billion moved in 15 minutes. Issuers subsequently froze about $2.8 billion of it, leaving about $2.9 billion in assets that could still be transferred.
An'an's co-founder disclosed that the net amount of affected funds was in the billions of dollars, representing just over 2% of user assets and publicly disclosed reserves. User funds are SAFU, and withdrawals were suspended to ensure asset security.
But there’s one crucial detail: prices had already started falling before the first wallet alert appeared. The An'an incident was more like “another kick when leverage was already fragile” than “the spark that set it all off.” What truly caused leveraged longs to collapse en masse was the macroeconomic data released that same day.
III. The real “engine”: GDP at 3.4% + core PCE at 3.1%—the worst combination
US Q3 real GDP rose at an initial annualized quarterly rate of 3.4%, above expectations of 3.2% and the previous reading of 2.2%. September PCE rose to 3.6% year over year, while core PCE rose 3.1% year over year and 0.3% month over month, with both rates accelerating from the previous month.
In other words, the economy is strong, but inflation is still high.
For crypto markets, this is the most painful combination. A strong economy → the Fed isn’t worried that rate hikes will wreck the economy; inflation above 3% → the Fed has no reason to stop. “The economy is strong enough to comfortably withstand rate hikes” is worse for risk assets than “the economy is weak enough to be heading into a recession.”
Market pricing for a December rate hike has already climbed above 80%. Warsh’s remarks at the press conference also left room for further hikes: “Except in a crisis, don’t believe forward guidance,” and he said credit conditions had tightened somewhat but that he was “unwilling and unable to say that conditions are restrictive.”
In other words: holding rates steady in October was just “catching a breath.” The market is already pricing in that December cut in advance.
IV. The “split” in fund flows: Big players are selling, ETFs are buying
This is the comparison most worth examining today.
Large on-chain players are reducing their positions. Large trades accounted for 66.4% of total volume over 24 hours, but the flow was bearish: large players saw net outflows of about 3,307 BTC, major funds saw net outflows of about $23.47 million, and the share of active buying was just 48.2%.
But spot ETFs are buying. On the most recent trading day, BlackRock’s IBIT saw net inflows of $150 million, while Fidelity’s FBTC saw net inflows of $24.32 million, for a combined total of about $174 million. Earlier data showed net inflows of about $424 million into BTC spot ETFs over three days.
In other words, short-term leverage and active selling are retreating, while passive ETF buying is absorbing the supply. With these two forces moving in opposite directions, the price is seesawing around $77,000 instead of collapsing in a straight line.
Another structural signal worth watching: A whale with a 93,000-coin long position was forced to close 36,500 coins, with new liquidation prices around 2,122 and 2,129. The area around 2,120 for ETH is the “tail-risk zone” for this wave of liquidations.
V. Key levels: $73,000 and $81,000 are the two “nuclear buttons”
Coinglass’s liquidation map marks the two most extreme levels right now:
Downside: At $73,560, $1.274 billion in long positions would be liquidated
Upside: At $81,196, $2.189 billion in short positions would be liquidated
In translation: $73,560 is the “line in the sand” for leveraged longs in this cycle; a break below it would trigger even larger-scale cascading liquidations. $81,196 is the “rallying point” for shorts; if the price can reclaim it, the short squeeze would be more powerful than this round of long liquidations.
BTC is currently around $77,000, right between the two “nuclear buttons.” The short-term direction depends on which side gets triggered first.
$73,560 and $81,196—these are the two nuclear buttons. Whichever gets pressed first will determine the short-term direction. Don’t make decisions based on emotion while the price is between them. 🚀#BTC跌破77000美元 #每周来晒