Share crypto content and earn up to 60% commissions through content mining.
placeholder
gatefun
[New Streamer] Bitcoin Chart Watch | Live Stream
gate liveLIVE
1,900
  • Reward
  • Comment
  • Repost
  • Share
Some of this week’s Shi Pan records, with a stable 90% win rate➕, all have corresponding posts and are available for review!#GateLaunchpool瓜分141万枚DOS $XAUT
XAUT0.04%
View Original
post-image
post-image
post-image
  • Reward
  • Comment
  • Repost
  • Share
🐋 WHALE WATCH : The stablecoin market cap just dipped below where we started on Jan 1st.
When on chain dollar liquidity shrinks its not just noise its a clear signal that capital is sitting on the sidelines or exiting the ecosystem. Bull runs dont start without liquidity expansion.
Watch the stablecoin supply closely. No new stables = no continuous upside. Protect your risk.
post-image
  • Reward
  • Comment
  • Repost
  • Share
$BOME ‌ is flashing some serious momentum at 70/100, making it one of the stronger setups on today's board. The price is in a clear uptrend, with higher highs and higher lows confirming bullish structure. Resistance at $0.000891 is the next major test — a breakout above that level could trigger a significant rally. However, volatility is elevated, and the breakout is still unconfirmed. This is a high-risk, high-reward setup that could pay off handsomely, but only if buyers can push through resistance.
Entry zone: $0.000828 – $0.000891 (breakout required)
Targets: TBD after confirmation
Stop l
BOME11.08%
post-image
  • Reward
  • 15
  • Repost
  • Share
MetalReliefRoboticArm:
Honestly, this position is quite awkward. There’s resistance at 0.000891 above; if it can’t break through, it’s all for nothing. Be cautious.
View More
🐕 $DOGE Technical Analysis
Price: ~$0.070 — current market data places DOGE around the $0.07 area.
📊 Market Structure
Short-Term: Neutral ⚖️
Mid-Term: Bearish → Recovery Attempt 🟡
DOGE is consolidating around $0.069–$0.071, with RSI near neutral. A clean break above $0.0715 could open the door to a stronger rebound.
🔑 Key Levels
🟢 Support: $0.069 → $0.067
🔴 Resistance: $0.0715 → $0.0737
🚀 Breakout: $0.075+
🎯 Scenarios
📈 Bullish:
Hold $0.069 and reclaim $0.0715 → potential move toward $0.0737–$0.075.
📉 Bearish:
Lose $0.067 → risk of a deeper move toward $0.063–$0.060.
⚡ Trading Bias
DOGE-0.65%
post-image
  • Reward
  • Comment
  • Repost
  • Share
JUST IN: Alibaba remains undervalued as AI/product revenue runs hot, with 11 straight quarters of double-digit AI revenue growth and 40% YoY growth for Alibaba Cloud external revenue. $BABA
BABA1.33%
post-image
  • Reward
  • Comment
  • Repost
  • Share
$BICO at 0.0225, gave away 30k for 75u. The poorer you are, the more cursed things get—what a piece of garbage.
BICO-12.46%
View Original
post-image
post-image
  • Reward
  • Comment
  • Repost
  • Share
BTC MARKET TRENDS
gate liveLIVE
1,736
  • Reward
  • 3
  • Repost
  • Share
CryptoLegend:
Ape In 🚀
View More
$NOT ‌is showing a bullish structure with momentum at 60/100, which is decent. Higher lows are forming, and resistance at $0.000402 is the key level to watch. A breakout above that could trigger a move higher. However, volume is very weak, which raises questions about the sustainability of the move. I'd wait for stronger buying pressure or a confirmed breakout before considering a position.
Entry zone: $0.000371 – $0.000402 (breakout required)
Targets: TBD after confirmation
Stop loss: TBD
Decent structure — but needs volume. Always DYOR.
#GateLaunchpool141MDOS #GateTop1GrowthInJuly
NOT2.84%
post-image
  • Reward
  • 18
  • Repost
  • Share
L2Farmer:
Momentum is only at 60, so it’s not particularly strong. Rising lows are a good sign, but without volume, it still feels like a paper tiger.
View More
#我的七夕交易分享 The $60k Defense: Why Does Crypto Have “Capital but No Trend” Recently?
ETF funds briefly flowed back in and macroeconomic data began to weaken, but Bitcoin still has not escaped low-level oscillation.
As of August 16, 2026, Bitcoin was hovering around $63k, while Ethereum was around $1,880. Over the past week, Bitcoin briefly recovered to around $65k, but soon fell back into the $62.5k—$63k range.
Cooling regulatory expectations, weakening ETF demand, and insufficient spot buying are the direct reasons the market has come under renewed pressure recently.
Recently, the total crypto m
ETH-0.06%
BTC-0.67%
View Original
post-image
ThisIsTranslateContent:
#我的七夕交易分享 $60k Defense Battle: Why Has Crypto Recently Had “Money but No Trend”?
ETF funds briefly returned, and macro data began to weaken, but Bitcoin still has not escaped its low-level range.
As of August 16, 2026, Bitcoin was hovering around $63k, while Ethereum was around $1,880. Over the past week, Bitcoin briefly rebounded to around $65k, but soon fell back into the $62.5k–$63k range.
Cooling regulatory expectations, weakening ETF demand, and insufficient spot buying are the direct reasons the market has come under renewed pressure recently.
Recently, the total global cryptocurrency market capitalization was approximately $2.26 trillion, with Bitcoin accounting for about 56.5%, Ethereum about 10.1%, and stablecoins about 13.4%. This shows that the current market remains highly concentrated in Bitcoin and stablecoins, with funds not spreading on a large scale toward small- and mid-cap tokens. The so-called “full-scale altcoin season” has yet to form.
The core judgment of this article is that the current market is neither the starting point of a new bull market nor the final panic-driven capitulation, but is closer to a low-level consolidation phase in the middle-to-late stages of a bear market.
There is still money in the market, but more of it is staying in ETFs, stablecoins, and derivatives, without forming sustained spot-buying momentum.
I. The main theme of 2026 is not a correction, but renewed compression of the valuation system
In the first quarter of 2026, total cryptocurrency market capitalization fell 20.4%, from approximately $3 trillion to $2.4 trillion; in the second quarter, it fell another 12.6% to approximately $2.1 trillion. In other words, the market has contracted for two consecutive quarters, rather than experiencing an ordinary correction caused by one or two short-term negative catalysts. Based on Bn’s public daily data, from January 1 to August 16, Bitcoin fell from approximately $88.8k to around $63.1k, a year-to-date decline of about 29%; Ethereum fell from approximately $3,004 to around $1,881, a year-to-date decline of about 37%.
However, calculated from the June low, Bitcoin has rebounded about 8.5% from approximately $58.1k, while Ethereum has rebounded about 25% from approximately $1,506. This has created a market environment that is easy to misjudge: the decline has already been substantial, and the local rebound is also evident, but the medium-term downtrend has not truly been reversed. Ethereum’s rebound has been larger than Bitcoin’s, but this does not mean Ethereum has already turned stronger; it is more because Ethereum had previously fallen further and has higher volatility.
A genuine trend reversal requires seeing the ETH/BTC exchange rate stabilize continuously, on-chain activity recover, and spot trading volume expand, rather than merely seeing the dollar price rebound from its low.
II. ETFs have seen renewed inflows, but without corresponding price elasticity
In early August, U.S. spot Bitcoin and Ethereum ETFs briefly saw significant fund inflows, with combined net inflows of approximately $1.1 billion for the week. Under normal circumstances, this level of incremental capital would be sufficient to drive a notable recovery in risk appetite, but Bitcoin only briefly rose to around $65k before falling back again. By mid-August, ETF demand had begun to weaken again, and prices also reacted tepidly to softer U.S. economic data. This indicates that ETF funds are currently serving more to absorb selling pressure and maintain the bottom than to drive a price breakout.
There are three reasons.
First, while ETF buying provides incremental demand, miners, early holders, corporate entities holding crypto, and some long-term funds may also use rebounds to reduce their positions.
Second, ETF funds are highly concentrated in Bitcoin, with limited spillover effects on Ethereum and small- and mid-cap tokens. Therefore, even if Bitcoin receives support, it may not lead the broader market to rise across the board.
Third, ETF inflows exhibit clear daily volatility. Only stable net inflows lasting several weeks, rather than concentrated buying over a few days, can constitute genuine trend-driven demand.
Therefore, at this stage, “ETF inflows” cannot simply be understood as meaning that “prices will inevitably rise.” What deserves closer attention is: **With continued inflows, can prices raise their lows in tandem?** If funds enter but prices do not rise, it usually means that substantial supply still exists overhead.
III. The macro environment has shifted from simple headwinds to a complex tug-of-war between bulls and bears
On July 29, the Federal Reserve kept the federal funds rate at 3.5%–3.75%. Notably, nine officials voted to keep rates unchanged, while three wanted a 25-basis-point hike, reflecting continued significant inflation concerns within the Fed. However, the U.S. July employment data released afterward weakened noticeably: nonfarm payrolls declined by 23k, the unemployment rate was 4.1%, and May and June payrolls were revised down by a cumulative 103k. The weakening labor market reduced expectations that the Fed would continue raising rates in September.
This has created an apparently contradictory environment for crypto: a weakening economy helps reduce expectations of further rate hikes, but economic weakness itself may also mean declining corporate profits, risk appetite, and demand for capital. Easing inflation benefits liquidity-sensitive assets, but energy and geopolitical risks could push inflation higher again.
Therefore, recent macro data is no longer simply “bullish” or “bearish,” but has created an awkward situation: the data is weak enough to prevent further rate hikes, yet not weak enough to force the Fed to ease rapidly. This is an important reason why Bitcoin has not reacted strongly to softer inflation and employment data. The market needs not “a single data point below expectations,” but a complete set of evidence confirming lower real interest rates, a weaker dollar, and sustained improvement in liquidity conditions.
IV. The most concerning issue is not falling prices, but the renewed accumulation of leverage
According to Bn’s public futures data, the notional value of open BTCUSDT contracts rose from approximately $6.49 billion in mid-July to approximately $7.03 billion on August 16, an increase of about 8.3% in one month. Meanwhile, Bitcoin’s price has generally not risen, and funding rates remained positive most of the past week. In other words: prices have not broken out significantly, but bullish leverage has begun accumulating again. Funding rates have not yet reached extreme levels of exuberance, so it cannot be said that the market will necessarily experience large-scale liquidations. However, “sideways prices, rising open interest, and positive funding rates” usually indicate that the market structure is becoming fragile. If spot capital suddenly strengthens, leveraged positions could drive prices rapidly higher; but if ETFs shift to continuous outflows, macro news deteriorates, or the area around $60k is lost, excessive long futures positions could also become fuel for the next decline. This is the greatest contradiction in the market recently: surface-level volatility has declined, but internal risk has not fallen accordingly.
V. Three possible paths for the coming weeks
Base case: Continued consolidation above $60k The most likely path remains Bitcoin fluctuating repeatedly within the broad $58k–$67k range, with $62k–$65k potentially continuing to be a dense short-term trading zone. Ethereum may continue fluctuating around $1,750–$2,000. As long as Bitcoin does not break below $60k and begin a sustained, high-volume decline, the market may maintain a bottoming structure characterized by “limited downside and no upside momentum.” This type of market often erodes sentiment more than a rapid crash, because it repeatedly creates minor breakouts and then repeatedly disappoints momentum-chasing capital.
Bullish scenario: Spot capital regains pricing power A genuine strengthening cannot be judged solely by whether Bitcoin breaks above $65k on a given day. At least three conditions should appear simultaneously: Bitcoin recovers the $67k–$70k area on rising volume; ETFs record net inflows for several consecutive weeks; and spot trading volume grows faster than open interest. If Ethereum also holds above $2,000 and ETH/BTC stops making new lows, the market may gradually shift from a “Bitcoin defensive market” toward a broader recovery in risk appetite.
Bearish scenario: Losing $60k triggers deleveraging If Bitcoin loses $60,000 and retests the June low of approximately $58.1k while open interest remains high, the market may experience a new round of forced deleveraging. At that point, close attention should be paid to whether ETFs record continuous outflows, whether funding rates turn negative, and whether the stablecoin supply continues to decline. If all three occur simultaneously, it would indicate that the decline is no longer merely a technical pullback, but may represent a new round of capital contraction. The ranges above are market-structure observation levels, not personalized trading instructions.
The next genuine major trend will not be determined by a positive news event on any single day, but will be confirmed jointly by ETFs, stablecoins, spot trading volume, and macro liquidity. $BTC
repost-content-media
  • Reward
  • 1
  • Repost
  • Share
ThisIsTranslateContent::
Just send it 👊
Stock investors hope the bull will come, and so do people in crypto!
“Bull Is Coming” grossed only a few thousand yuan early in its theatrical run, then unexpectedly became a viral hit thanks to netizens’ memes, curiosity, and derivative creations.
When no one is discussing it, it may be worthless; when everyone starts discussing it, the price itself becomes a vehicle for attention.
The same goes for memes—and bull markets!
Attention comes first, then consensus; once there is consensus, people finally start studying the value.
MEME-0.37%
View Original
post-image
post-image
  • Reward
  • Comment
  • Repost
  • Share
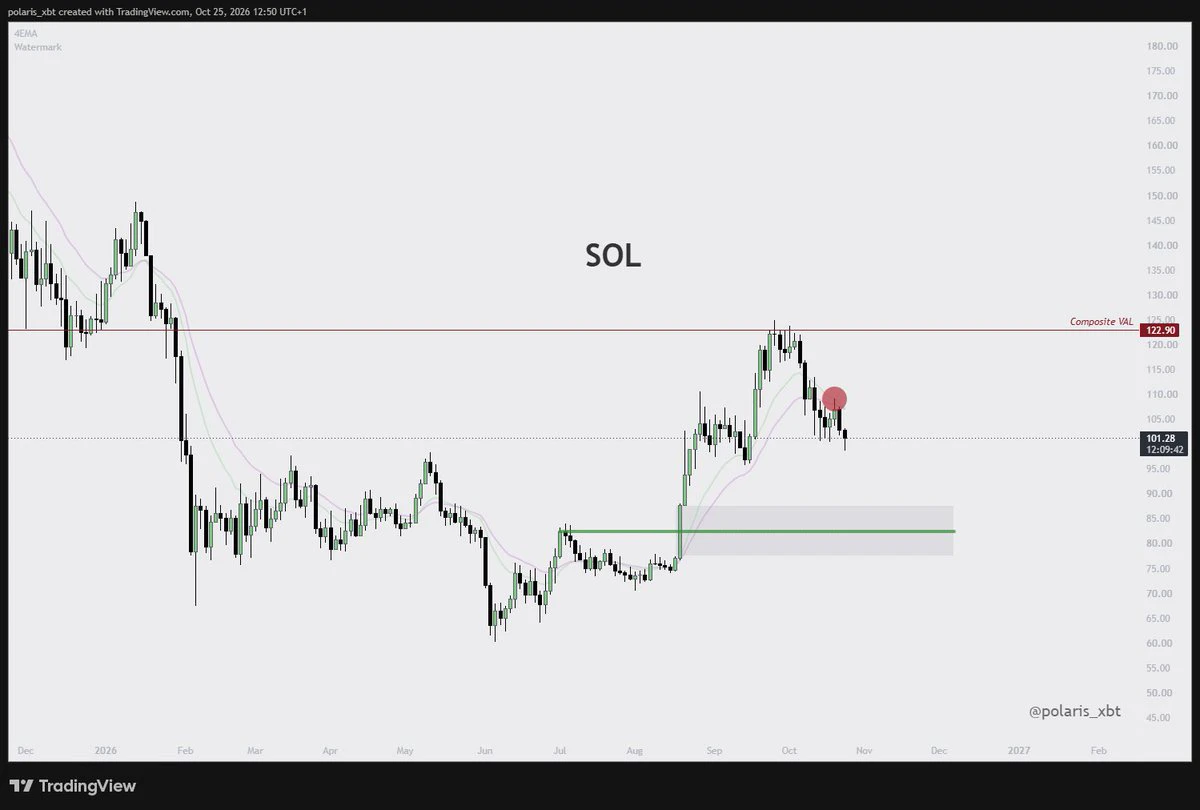
$SOL Signal】Long + 1H MACD expansion/4H volume contraction
$SOL 1H MACD bullish momentum continues, while 4H bearish momentum narrows; the 1H Bollinger upper band is slightly opening, and the price is holding above the middle band. The order book buy ratio is 0.75, deep-water sell pressure is -14%, with a negative funding rate and stable OI, indicating that shorts lack momentum. RSI is 54.6 on 1H and 49.9 on 4H, with a neutral-to-bullish bias. The risk/reward ratio is 1.5, making it worth targeting.
🎯Direction: Long
⚡Entry/limit order: 75.4330 - 75.5800
🛑Stop-loss: 74.8242
🚀Target 1: 76.71
SOL0.04%
DOS-10.64%
View Original
post-image
  • Reward
  • Comment
  • Repost
  • Share
BTC is really done for; liquidations are only around 100 million now.
Continue resting over the weekend#btc $BTC
BTC0.01%
View Original
post-image
  • Reward
  • Comment
  • Repost
  • Share
$VANRY holders on local exchanges 🤑
$VANRY holders on foreign exchanges 🤯
VANRY17.33%
View Original
  • Reward
  • Comment
  • Repost
  • Share
#AIP #Gate7月增长Top1
In August 2026, a piece of news sent shockwaves through Wall Street.
Goldman Sachs disclosed that it had acquired ETF management firm NEOS Investments for up to $2.25 billion. A high-yield Bitcoin ETF managed by NEOS, with $1 billion in assets under management, offers yields as high as 27%, surpassing similar products from BlackRock. The deal will lift Goldman Sachs’ actively managed ETF assets to approximately $80 billion, while total ETF assets under supervision will exceed $130 billion. Goldman Sachs has rewritten its role from a “cautious observer among traditional inve
View Original
post-image
  • Reward
  • Comment
  • Repost
  • Share
My Take (Market Context) on $GT
· Price Action: GT is trading at $6.69**, down -0.30% on the day, hovering near the **24h Low of $6.63. It is currently below the MA5 (6.69), MA10 (6.70), and MA30 (6.71), which is a bearish short-term structure.
· Momentum: The MACD is negative (all lines near -0.00), indicating weak bearish momentum with no clear divergence.
· Volume: Spot volume (71.70) is significantly below the MA5 (467.55) and MA10 (358.63), suggesting low participation – this is a range-bound, low-volatility environment, not a strong trend.
· Key Levels:
· Support: $6.63 (24h Low / r
GT-0.59%
post-image
  • Reward
  • Comment
  • Repost
  • Share
This explanation feels much more reasonable.
In the past, everything in the construction industry could be used to repay debts.
View Original
post-image
  • Reward
  • Comment
  • Repost
  • Share
My Take (The "Why") on $H
This is a strong bullish breakout scenario. The price has surged +35.79% and is currently trading near the 24h High (0.16307). The volume is high (103M), confirming buyer interest. However, the price is now significantly extended above the MA30 (0.13888) and facing a key psychological resistance level. A short-term pullback (retracement) is highly probable before the next leg up, but the overall trend remains bullish.
Trade Plan (Long Setup)
I will look to enter on a pullback, not a chase.
· Entry Zone: 0.1470 – 0.1500
(This is the area of the previous breakout a
H39.07%
  • Reward
  • Comment
  • Repost
  • Share
$PI If you’re bullish on it (Pi), find a suitable price and place a limit order there. I’ve placed a buy order at 0.8!
PI-3.04%
View Original
post-image
post-image
  • Reward
  • 1
  • Repost
  • Share
liu118:
I think listing it at 0.04 would be better.
$TAO – Early downtrend momentum persists
TAO SHORT
Entry: 196.45 – 196.57
Stop Loss: 200.44
TP: 192.58 - 188.65 - 184.72
Plan & Logic
The 15‑minute and 5‑minute charts both confirm a clear downtrend, indicating continued pressure. Price action is reacting near an important level, so risk management matters here. The setup depends on confirmation around the entry zone and follow-through after the move.
Trade TAO here
TAO-1.11%
post-image
  • Reward
  • Comment
  • Repost
  • Share
Load More

Join 40 M users in our growing community

⚡️ Join 40 M users in the crypto craze discussion
💬 Engage with your favorite top creators
👍 See what interests you
  • Pinned