Square
Following
Hot
News
Profile
Share your thoughts
placeholder
Article
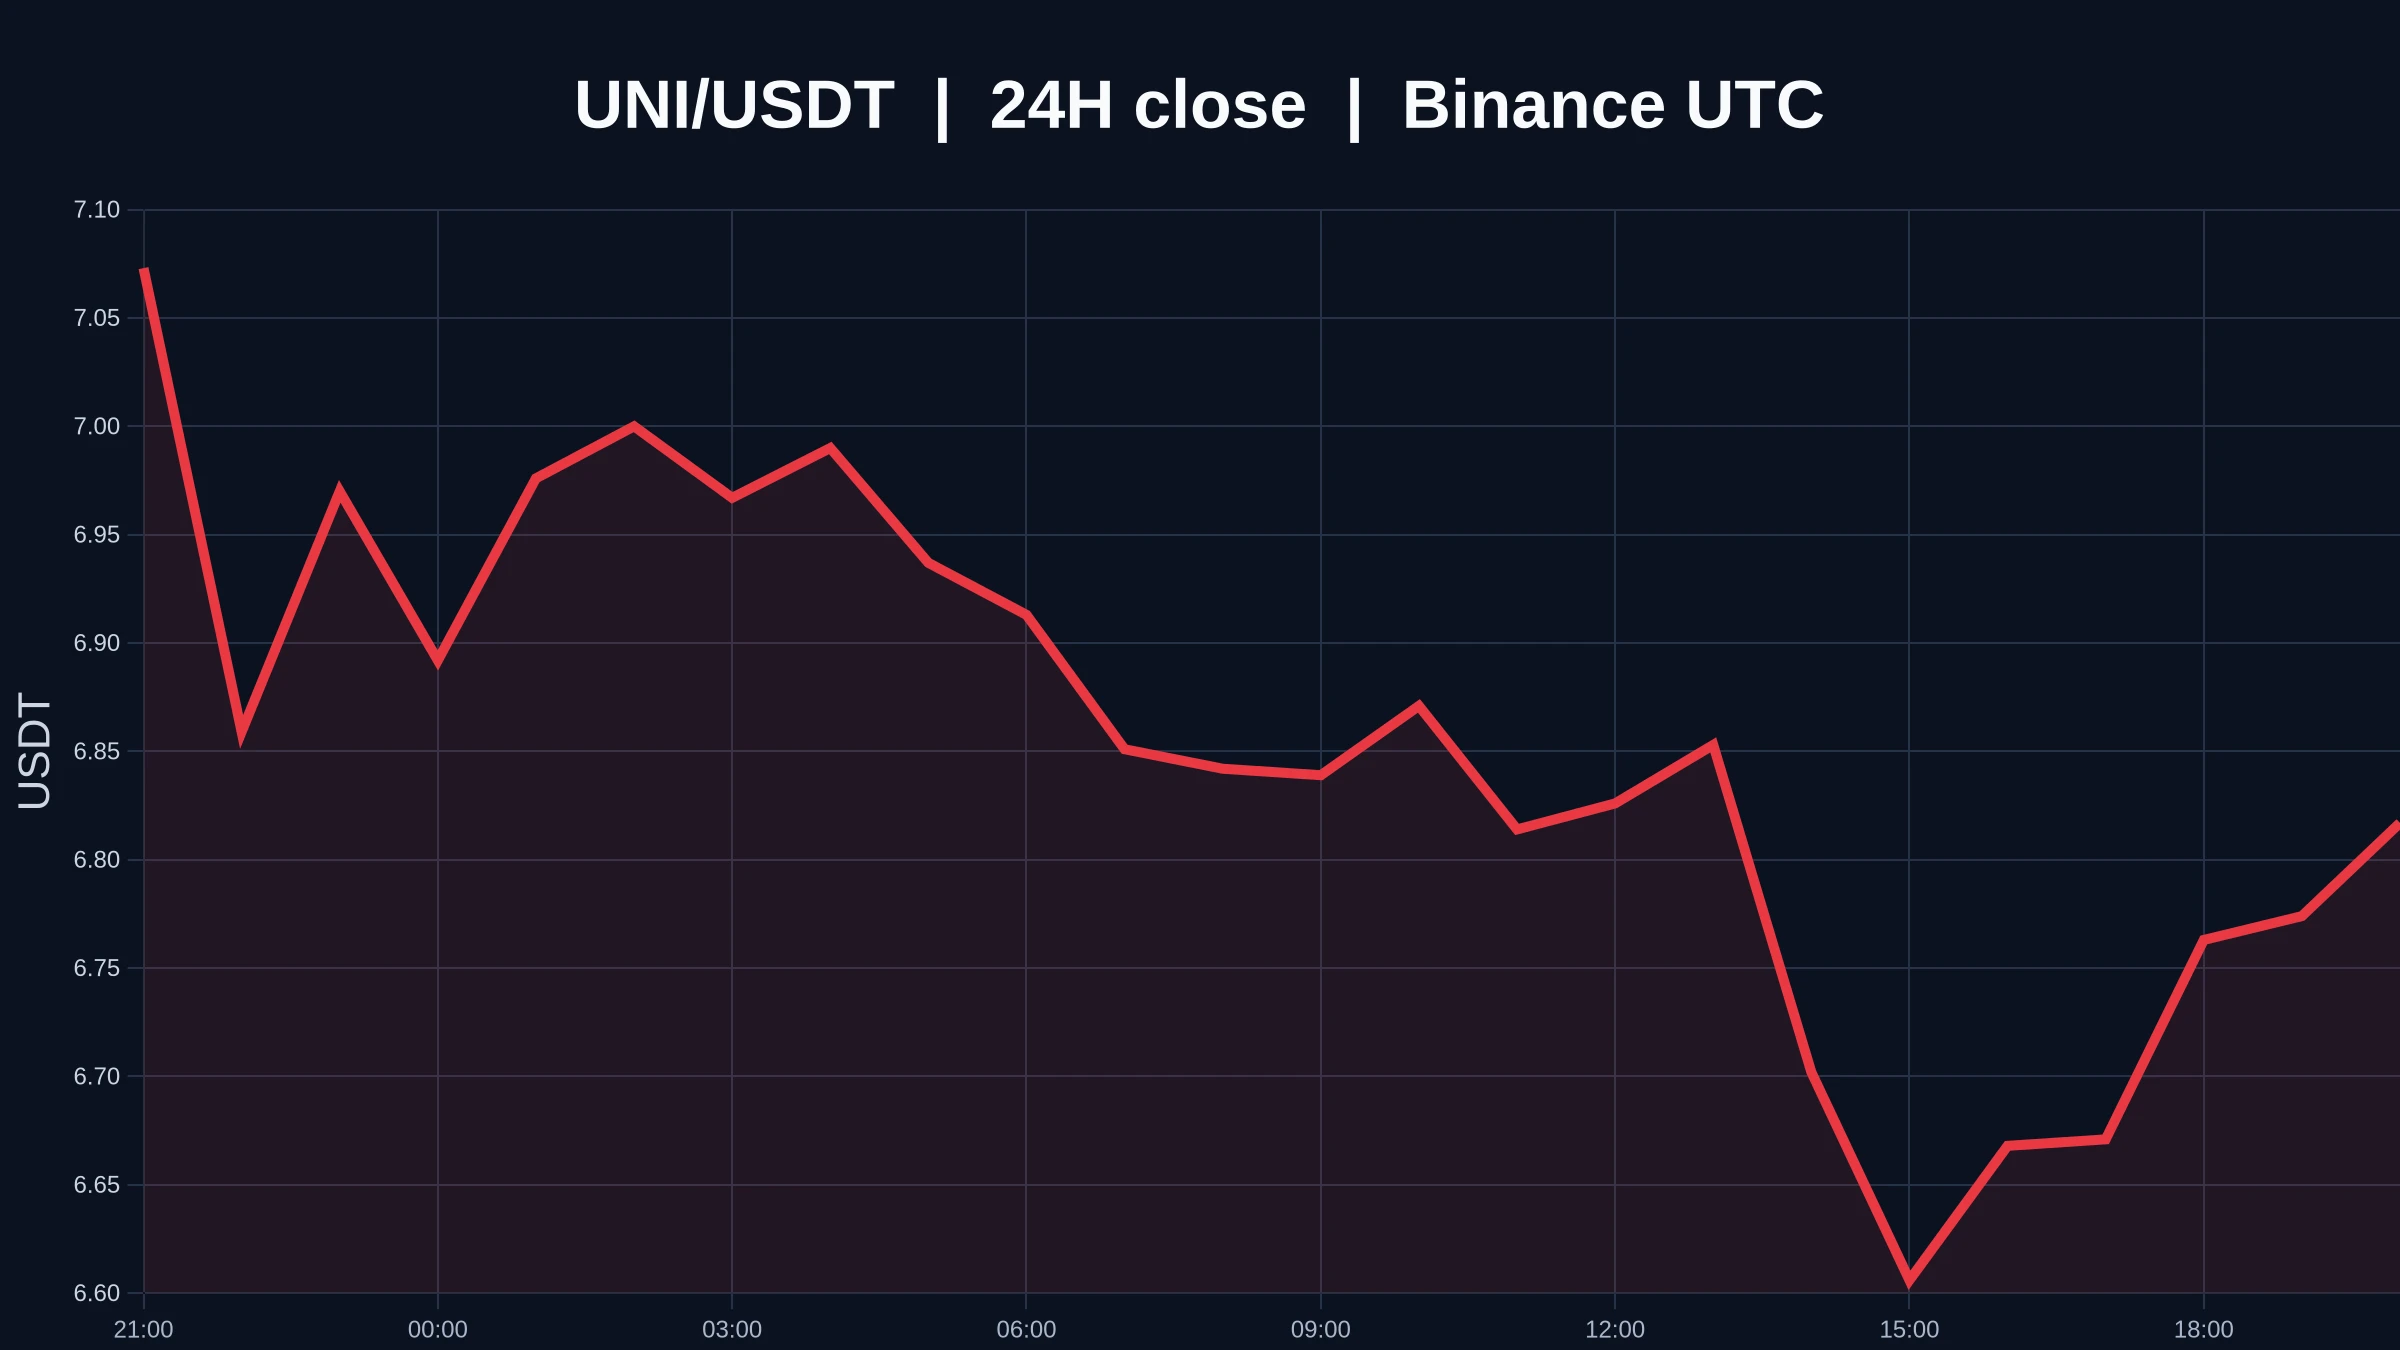
$UNI The most interesting thing right now is not guessing whether prices will rise or fall, but seeing who will be forced to change their stance first.
The bulls' test is at 7.634, while the bears' test is at 6.784. $UNI is currently at 7.416, up 4.32% in 24 hours. The 1-hour support is 6.784, resistance is 7.634, and current volume is 0.47 times the average volume of the past 20 or so candles.
I’ll first note that the $UNI price has already moved, but trading activity and volume have not caught up, because the direction can be trusted for now, while continuation cannot be assumed in advance;
post-image
UNI+4.54%
2026 Pi Goal: Write it: "By Dec 2026 I will have ___ migrated Pi and ___ businesses accepting Pi" #PiNetwork #Gateio #Gate60MUsers #ShareWeekly
PI+0.34%
High Oil Price Scenario One (2026.10.17))
post-image
🐋 WHALE WATCH : Whale alert: Arthur Hayes just went shopping.
Over the last hour his wallet took down $460K of $AERO $232K of $PENDLE and $197K of $ZAMA .
High beta DeFi and privacy narrative rotation is quietly heating up while everyone else is distracted.
Position accordingly.
AERO+2.74%
PENDLE-0.52%
ZAMA+10.41%
[New Streamer]whales Moves in Sync!
live-cover
LIVE1,898
Is it really that funny?
All I see is a desperate grilled fish.
Interactive Brokers enters Ethereum's $110B staking market as institutional demand surges
Interactive Brokers is now offering Ethereum staking to eligible clients through zerohash, as institutional and custodial platforms capture an increasing share of validator deposits.
On Oct. 13, the brokerage announced that qualifying Interactive Brokers LLC customers can stake ETH via its Client Portal, with crypto infrastructure provider zerohash handling the service. Rewards are credited in ETH and can compound while holdings remain staked.
⚠️ Personal market analysis only. NFA — manage risk and DYOR.
post-image
ETH+0.82%
Retail investor: Oil’s back over $100 & they’re hitting tankers in Hormuz again. I’m thinking about going to cash till it calms down
Me: When does it calm down?
Retail investor: idk... when the war’s over?
Me: Brent oil hit around $118 back in March when the strait shut down. Everybody was saying exactly what you’re saying...
Retail investor: & what happened?
Me: Nasdaq made a new all time high a few weeks later and now up over 30% from that point.
Retail investor: with all this still going on??
Me: Yep. The market doesn’t wait for the all clear. It moves as soon as it figures out earnings are
post-image
BZ-0.32%
NDAQ+1.41%
$ACU
The wick down to 0.0900 shows buyers stepping in, but the trend hasn't flipped yet.
My spot plan is to wait for a dip into 0.0925 to 0.0945. Stop below 0.0875. Targets are 0.1032, 0.1105, then 0.1165.
If price closes above 0.1035 on the 4h first, that's the trend flip, and I'd reassess from there.
Volume is thin, so I'd use limit orders only.
Not financial advice.
post-image
ACU+3.24%
  • 2
  • 1
☠️ $SIREN — CRAZY DOWNSIDE, CRAZY POTENTIAL
Look at that chart. After a brutal collapse, price is still sitting near the lows.
Could we see another massive leg down before any real recovery? Absolutely.
⚠️ More blood may be coming. Don't assume the bottom is in just because it's already down so much.
High risk, high volatility. Let the chart confirm before jumping in. 🩸
post-image
SIREN+4.89%
The best trade I've made these past few days is actually $CRCL
post-image
CRCL+7.80%
US economic data delivered a clear message: inflation is running hotter than expected, yet consumer demand and parts of the manufacturing sector remain surprisingly resilient.
🔹 This combination creates a difficult position for the Federal Reserve. After Wednesday's above-forecast CPI, today's producer-level data reinforced the case for rates staying higher for longer.
📊 The data on the table:
🔹 Core PPI: +0.7% MoM (forecast: +0.3%). The largest monthly increase since March 2022.
▪️ Headline PPI: +1.3% MoM (forecast: +0.6%), +6.3% YoY (forecast: +5.3%). The highest annual reading since Dece
post-image
User_any
✨ US equity futures traded mixed on October 15 as technology and AI-related stocks faced renewed pressure.
🔹 Futures tied to the tech-heavy Nasdaq 100 fell about 1.2%, while S&P 500 futures slipped 0.3%. Dow Jones Industrial Average futures held relatively firm, trading slightly positive. The divergence reflects a selective risk rotation rather than a uniform selloff.
📊 The data behind the market's sharp reaction:
🔹 Inflation pressures are broadening
▪️ US September PPI rose 1.3% month-over-month and 6.3% year-over-year, far exceeding the 5.3% forecast and marking the largest annual increase since December 2022.
▪️ Core PPI, excluding food and energy, rose 0.7% MoM and 5.0% YoY, also above expectations.
▪️ The September CPI report released a day earlier showed headline inflation accelerating to 3.7% YoY, with core CPI at 2.6%.
▪️ Energy prices surged 10.8%, accounting for over 80% of the goods price increase, with gasoline jumping 20.3%.
🔹 AI and semiconductor stocks face a reality check
▪️ Memory chip names continued to slide, with Micron down about 4% and AMD falling roughly 3.5% premarket. CoreWeave dropped another 5% after plunging 15% on Wednesday.
▪️ Investor concerns focus on whether the massive capital expenditures required for AI data centers will generate sufficient returns, particularly as debt-financed expansion raises sustainability questions.
▪️ Reports of progress by China's CXMT on next-generation DRAM technology have also pressured memory stocks by raising competitive concerns.
🔹 TSMC's cautious 2027 guidance amplifies uncertainty
▪️ TSMC reported its sixth consecutive quarter of record profit, with net income up 69% YoY to NT$763.1 billion. It raised its 2026 revenue growth forecast to approximately 44%.
▪️ However, CEO C.C. Wei struck a cautious tone on 2027, citing macroeconomic uncertainties and rising component costs affecting price-sensitive end markets.
▪️ The cautious outlook, despite strong AI demand, reinforced concerns about future growth visibility across the semiconductor supply chain.
⚖️ Structural perspective:
🔹 From a long-term structural perspective, the current market dynamic reflects a recalibration of valuations rather than a deterioration in underlying industrial demand. TSMC's cautious 2027 planning is best understood as prudent expectation management amid macro uncertainty, not a signal of weakening AI fundamentals.
▪️ The transmission chain from energy costs to broader pricing is becoming clearer: crude oil → gasoline → transportation and warehousing services → wholesale and retail margins. This broadening inflation narrative keeps the Fed's restrictive policy path in focus, pressuring high-duration growth assets.
▪️ Meanwhile, capital is rotating defensively — into Treasuries and dividend-paying instruments — rather than exiting risk entirely. The 10-year Treasury yield dropped sharply to around 5.05%, a three-week low, reflecting strong safe-haven demand.
▪️ Bitcoin fell to near $80,500, down about 3.6% over 24 hours, with market-wide liquidations approaching $977 million, predominantly from long positions. The $80,000 level remains a critical support zone to watch.
▪️ Gold recovered above $4,150, up over 1.3%, as falling yields and a softer dollar supported precious metals despite the hot inflation print.
▪️ The dollar index retreated from its 18-month high toward 102.0, giving back most of its post-CPI gains as rate-hike expectations eased slightly.
🔹 The key variable ahead is whether the Fed signals patience at its October 27-28 meeting or adopts a firmer tone. Markets currently price roughly a 49% probability of an October hike, up sharply from about 22% before the CPI data. Until that guidance arrives, markets are likely to remain in a selective recalibration phase.
💬 When inflation pressures broaden beyond energy and AI valuations face scrutiny, do you prioritize defensive positioning or long-term structural exposure? 👇
#USStocks #Inflation #USSeptemberPPIBeatsExpectations
#美国9月PPI大超预期 #USSeptemberCPITopsEstimates
Not financial advice.
repost-content-media
BTC+0.90%
ETH+1.02%
XAU+1.50%
XAG+2.86%
XRP+1.15%
Reverse money printer formations coming in... 🔥
post-image
#BTCBreaksBelow82K
BTC Breaks Below $82K: Is Bitcoin Heading Toward $80K or Preparing for a Powerful Rebound?
Bitcoin has entered a critical phase after breaking below the psychological $82,000 level. The market is now facing an important question: Will BTC continue its correction toward $80,000 and below, or can buyers regain control and push the price back toward $83,000–$85,000?
As of October 15, 2026, Bitcoin has experienced significant selling pressure, with its price moving toward the $80,000–$81,000 region. The decline reflects a combination of macroeconomic uncertainty, inflation conc
BTC+0.90%
2026.10.15 Early BTC/ETH/XAU/SNDK Analysis
The market wiped out $BTC million overnight, leaving 108019 people bankrupt and wiped out!
Last night, the major bearish CPI news came in above expectations, igniting short-seller enthusiasm, especially in XAU/XAG!
Last night, I went against the trend and established core long positions in XAU/XAG. XAU should be around 4100; you can reduce your position and move your stop to protect profits now. XAG at 56.8 is slightly underwater at the moment, so hold it for now. Whichever of the two you traded, follow the corresponding strategy!
BTC support/r
post-image
BTC+0.98%
ETH+0.82%
XAU+1.50%
XAG+2.86%
SNDK-3.13%
✨ US Data Update: What Today's Numbers Signal for Markets
🔹 A dense set of US economic data released today painted a picture of an economy that remains resilient, but with inflation pressures proving more persistent than expected. The combination of hot inflation, strong consumer spending, and a tight labor market is reshaping rate expectations.
📊 The data on the table:
🔹 PPI (Producer Price Index): September PPI rose 1.3% MoM and 6.3% YoY, far exceeding the 0.5% and 5.3% forecasts. This is the largest monthly increase since March 2022. Core PPI, excluding food and energy, rose 0.7% MoM and
post-image
User_any
#美国9月PPI大超预期 ✨ US PPI Inflation Surges to 6.3%, the Highest Since Late 2022
🔹 The US September Producer Price Index (PPI) rose 1.3% month-over-month and 6.3% year-over-year, significantly exceeding the consensus estimate of 5.3%. This marks the largest monthly increase since March 2022 and the highest annual reading since December 2022.
📊 The data behind the print:
🔹 Core PPI: Excluding food and energy, core PPI rose 0.7% MoM and 5.0% YoY, both above expectations.
▪️ Energy: Energy prices surged 10.8%, accounting for more than 80% of the broad-based increase in goods prices. Gasoline jumped 20.3%.
▪️ Context: The reading follows Wednesday's CPI report, which also came in above forecasts at 3.7% YoY headline and 2.6% core. Retail sales for September rose 0.8% MoM, beating the 0.3% estimate.
⚖️ Market impact:
🔹 Bitcoin: Briefly fell below $80,000 to $79,800 before rebounding to near $82,000. Market-wide liquidations reached approximately $930 million over 24 hours, with long positions accounting for $780 million. The $80,000–$81,500 zone remains a critical support area, overlapping with the estimated ETF cost basis.
▪️ US Equities:The S&P 500 and Nasdaq 100 traded mixed, with tech and semiconductor names under pressure. The Philadelphia Semiconductor Index fell over 4% in the prior session. Cyclical sectors and the Dow Jones outperformed as investors rotated toward defensive positioning.
▪️ Treasuries & Dollar: The 10-year Treasury yield dipped to approximately 5.04% from 5.10%, as safe-haven demand for bonds offset the inflation surprise. The dollar index retreated from its 18-month high toward 102.0.
▪️ Gold & Silver:Spot gold recovered above $4,150, up over 1%, while silver rebounded above $56.9 per ounce, gaining more than 2.4%. The recovery was driven by falling yields, a softer dollar, and renewed safe-haven demand.
⚖️ Structural perspective:
🔹 The PPI acceleration broadens the inflation narrative beyond consumer-level price pressures. With producer costs rising across energy, transportation, and services, the data reinforces the case for the Federal Reserve to maintain a restrictive stance. Markets now price roughly a 29% probability of a rate hike at the October 27-28 meeting, with December tightening expectations remaining elevated.
▪️ For risk assets like Bitcoin, the primary pressure channel is the rate outlook: higher-for-longer borrowing costs reduce the relative appeal of non-yielding assets. Gold and silver, however, face a more layered dynamic, balancing safe-haven demand against real-rate headwinds.
▪️ The key variable ahead is whether the Fed signals patience at the October meeting or adopts a firmer tone. Until that guidance arrives, markets are likely to remain in a recalibration phase, with capital rotating selectively between growth, defensive, and hard-asset exposure.
🔹 How are you assessing the market's response to two consecutive inflation surprises? 👇
#PPI #Inflation #Bitcoin #Gold
Not financial advice.
repost-content-media
BTC+0.90%
US500+0.31%
NAS100-0.15%
Ok what the hell one more time!
LFG!!!!
Strive Buys $280M in Bitcoin, but BTC Per Share Rises Only 1.72%
Strive bought 3,311 BTC during Oct. 5–9 while its cash balance rose, showing accumulation alongside replenished liquidity.
Strive’s gross Bitcoin per effective common share rose 1.72%, while additional SATA shares increased claims ahead of common holders.
⚠️ Personal market analysis only. NFA — manage risk and DYOR.
Educational content, not investment advice or a recommendation to buy, sell, deposit, or withdraw any asset. No paid promotion or referral/affiliate links.
post-image
ASST+2.43%
SATA-0.23%
BTC+0.90%
  • 1
At midday, the trend outlook for both BTC and ETH remained firmly bearish. BTC rebounded to the 81,700 resistance level and met resistance, while ETH rebounded to 2,390 and came under pressure, so short positions were opened simultaneously. BTC was targeted below 80,000, while ETH was targeted around 2,320. As the U.S. stock market opened, the market moved downward as expected, with prices continuing to retreat. BTC hit a low of 79,818, while ETH pulled back to around 2,320, securing 1,300/40 points of room and banking 24,000/16k U! #美国9月PPI大超预期 $BTC ‌
BTC+0.98%
Load More

Join 40 M users in our growing community

⚡️ Join 40 M users in the crypto craze discussion

💬 Engage with your favorite top creators

👍 See what interests you

Trending Topics

USSeptemberPPIBeatsExpectations

91.35k Views1.86k Discussing

US September PPI came in at 6.3% YoY, well above the 5.3% market expectation, pointing to renewed producer-side inflation pressure. Weekly jobless claims were 199K, broadly in line with forecasts. Could hotter inflation further reduce room for rate cuts, and what does it mean for $BTC, US stocks, and gold?

DrLinHanSpeaksAtOxfordUnion

135.63k Views1.86k Discussing

JapanAndKoreaStocksPlunge

47.27k Views1.75k Discussing

View More