Share your thoughts
placeholder
Article
I just casually hit refresh, and it went up on its own, leaving me in a very passive position. $BCH was incredibly decisive this time. After placing the order at 247.31, I barely checked it. The last time I looked before bed, it was still moving sideways, but now it’s directly showing 257.68, with a +294.29% profit. It feels like the market is chasing me to feed me.

I noticed it during the repeated intraday swings: someone stepped in to buy every dip, and the key levels were gradually moving higher. If that wasn’t a shakeout, what was it? I even specifically mentioned at the time: the more s
post-image
BCH+1.04%
BNB+7.61%
ETH+0.85%
Everyone’s staring at the wrong side of DOGE while the 4h chart whispers a trap.

$DOGE /USDT - SHORT

Trade Plan:
Entry: 0.09084 – 0.09122
SL: 0.09335
TP1: 0.08929
TP2: 0.08812
TP3: 0.08638

Why this setup?
Why now? RSI on the 15m is screaming at 72.87—overbought in a range. The primary signal says SHORT at 0.09103, targeting 0.08812, but the alt path flips long to 0.09327. With 77% confidence and a tight 0.000745 ATR, the market is coiling. This isn’t a breakout; it’s a liquidity grab waiting for late longs.

Debate:
If the daily is range-bound, do you fade this 4h pump to 0.09122 or rid
DOGE+7.07%
This $CHIP long position made it this far not because I was especially brave, but because the protective stop kept me disciplined. After entering, the price surged for a while. I didn’t rush to exit everything, but took partial profits in batches. With a lighter position, my mindset stabilized. I moved the protective stop higher for the remaining position. Although the subsequent pullback triggered many people’s stop-losses, my position remained open because the price never touched the protective stop I had moved up.
Most pullbacks in the market are caused by people being unable to hold their
post-image
CHIP+7.44%
ETH+0.85%
SNDK+1.98%
Everyone’s watching Bitcoin, but $LTC /USDT’s 15m RSI just screamed at 73—and nobody’s talking about the trap.

$LTC /USDT - SHORT

Trade Plan:
Entry: 54.7 – 54.9
SL: 56.6
TP1: 53.4
TP2: 52.5
TP3: 51.2

Why this setup?
- 4h bias is SHORT with 77% confidence—this isn’t a coin flip.
- 1D trend is *range*, so we’re not chasing a breakout; we’re fading a local pump.
- RSI 15m at 73.16 = overheated micro-move. Mean reversion is the play.
- Entry zone 54.7–54.9, with TP1 at 53.4. Why now? The range ceiling is rejecting momentum, and ATR 1h (0.57) gives us room to breathe.

Debate:
If price
LTC+6.99%
Everyone’s staring at Bitcoin—but ETH just printed a 4h trap that smells like October 2025.

$ETH /USDT - SHORT

Trade Plan:
Entry: 2473.11 – 2478.15
SL: 2499.86
TP1: 2457.46
TP2: 2445.34
TP3: 2427.17

Why this setup?
- 1D is range, not trend—so this is a scalp, not a story.
- RSI (15m) at 67.49 = overheated micro-momentum, fading into the 4h short bias (55.4 conf).
- Entry 2475.63 sits right under invalidation 2460.15—tight risk, asymmetric payoff to TP1 2457.46.
- Why now? The 1h ATR (10.09) is compressing—breakouts are violent, and the range is squeezing toward the lower band.

De
ETH+0.85%
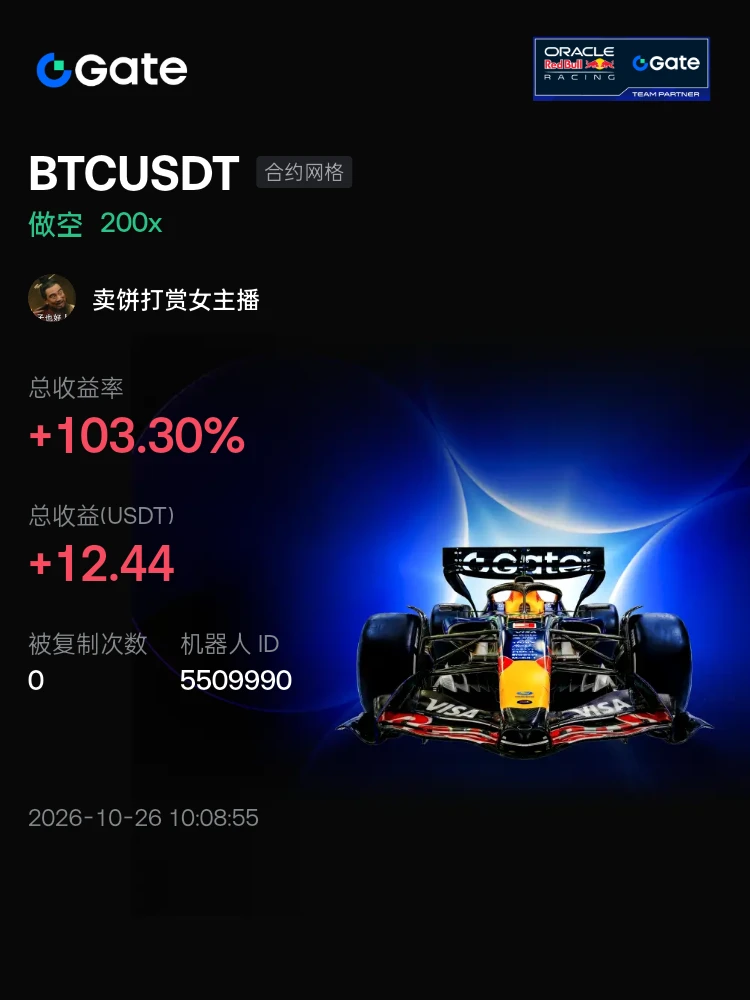
#交易机器人 I’m using the ETHUSDT Futures Grid Bot on Gate. Come copy-trade with me!
post-image
Others are fighting tooth and nail in the hot-coin pond, while I’m lying flat in the corner of $USELESS USDT (the useless coin). Its name is literally “Useless,” and I thought, isn’t that just me? Then my 50x leveraged long took off! Entry price: 0.15986; latest price: 0.28769; ROI: +3853.67%!
During the sideways movement, I almost uninstalled the app, thinking even the market makers couldn’t be bothered to scam anyone with this coin. Then it suddenly got a shot of adrenaline, and before I could react, my account had grown 38x. Livermore said money is made by sitting and waiting; I was sitting
USELESS+16.95%
BTC+0.15%
ETH+0.85%
This week brought new releases from OpenAI (GPT-6 Astra), Anthropic (Claude Fable 5.1 and Mythos 5.1), and Google (Gemini 3.8 Flash), expanding what AI can do in coding, research, cybersecurity, and tool use.
Working with AI saves time and lets us attempt things we could hardly tackle alone.
Yet a photograph of a sunset rarely feels like being there. It keeps the colors, but not the breeze, the silence shared with someone beside us, or the feeling that made us stop. The photo is not wrong. It just cannot hold the whole evening.
Something similar can happen when we work with AI. We get faster,
post-image
TOWN+1.80%
  • 1
  • 1
🌈 #GateLiveStreamingInspiration — September 5
Today’s Gate Live topics cover everything from macro trends and trading psychology to insider-trading activity, whale movements and major protocol developments.
Topics worth discussing:
• Fed rate expectations and yen trading logic
• BONK trading strategies and trend reversals
• Suspected insider positioning in $SLINK
• $907K loss from two FOMO trades
• Arbitrum clarification on the Robinhood outage
• $CRV whale activity and 20.86M CRV transfer
• Linera’s $LNRA community round
• Router Protocol shutdown and 303M $ROUTE burn
Choose a topic, go liv
post-image
ROUTE-63.96%
  • 11
gave you this at $15K.
$150K now, .
keep fading.
post-image
[$牛来 Signal] 1H Funding Rate Anomaly + 4H MACD Bullish Expansion, Targeting the Pullback Low
$牛来 4H MACD histogram widened to 0.0056, while the 1H funding rate was elevated at 0.0633%. The price pulled back from 0.14079 to 0.12569, landing right at the upper edge of the recommended entry zone. Buy orders are supporting around 0.1253, while order book depth imbalance is -38.38%, indicating that selling pressure has not been fully absorbed.
🎯Direction: Long
⚡Entry/Limit Orders: 0.1253129 - 0.1256900 (dip-buy within the range at the current price)
🛑Stop-loss: 0.1244331
🚀Target 1: 0.1275754
🚀T
post-image
牛来+42.11%
BTC+0.14%
ETH+0.83%
SOL+1.65%
September Trading Volume Starts Building! Could BTC & ETH Break From the Current Range?
live-cover
LIVE1,163
Everyone’s long SNDK, but the 4h chart just whispered a secret the crowd missed.

$SNDK /USDT - SHORT

Trade Plan:
Entry: 1762.72 – 1768.80
SL: 1794.96
TP1: 1743.86
TP2: 1729.26
TP3: 1707.36

Why this setup?
- RSI 15m at 62.25 shows fading momentum, not strength.
- ATR 1h at 12.16 means volatility is tight—waiting to snap.
- Price pinned at 1765.76 with TP1 at 1743.86: a clean 1.2% drop zone, no noise.
- Why now? Range-bound 1D trend + SHORT bias = mean reversion is the only game in town.

Debate:
Is the 1768.80 high the bull trap that sends us to TP1, or do we fade the fade?

⚠️ Pe
SNDK+1.98%
Financial News, Crypto Updates, Real-World Strategies
live-cover
LIVE1,258
No vision, can’t hold on—the profits on this move were paper-thin, but I loved every bit of it.
During the repeated intraday swings, $DGAI repeatedly retested 0.6959 without breaking down. It was forming a base, but the bottom kept rising, and the volume-price action was healthy. I judged at the time that this was accumulation, not distribution, so I decisively went long and held on.
On the latest update, the price has reached 0.7906, working out to +267.57%. Time to enjoy a good meal. It was truly sluggish at first, but the result feels just as good.
Take profits when it’s time. First lock i
post-image
DGAI+0.55%
LAB+1.76%
ADA+2.86%
Everyone’s long XRP at 1.42, but the 15-minute RSI just screamed 72—who’s the exit liquidity?

$XRP /USDT - SHORT

Trade Plan:
Entry: 1.4192 – 1.4238
SL: 1.4432
TP1: 1.4052
TP2: 1.3944
TP3: 1.3781

Why this setup?
XRP is stalling inside a 1D range, and the 4h signal flips SHORT at 1.4215.
- RSI (15m) at 72.61 = overheated, ripe for a snap-back.
- ATR (1h) is razor-thin (0.009) → volatility is coiling; the first push often fails.
- Entry zone 1.4192–1.4238 is a magnet, but TP1 at 1.4052 offers a 1.1% scalp *before* the daily trend decides.
Why now? The clock says 18:14 UTC—liquidity
XRP+1.10%
Brad cannot say a price. He is a CEO.
So he follows exactly 589 accounts.
The XRPL Foundation cannot say a price either.
So it hid 5, 8 and 9 in a picture.
589 was never a number. A password.
It is the sentence nobody in the room is allowed to say out loud.
1.3M followers is a bonus.
Most traders think XLM is dead—what if the range itself is the trap?

$XLM /USDT - SHORT

Trade Plan:
Entry: 0.18423 – 0.18501
SL: 0.18837
TP1: 0.18181
TP2: 0.17993
TP3: 0.17712

Why this setup?
- 4h bias is SHORT with 55% confidence—not a slam dunk, but a lean.
- Price sits at 0.18462, right at the range midpoint—no momentum, just indecision.
- RSI 15m at 58 shows weak bounce, but ATR 1h (0.00156) says volatility is shrinking—breakouts will be sharp.
- Targets: TP1 at 0.18181, TP2 at 0.17993—that's a 2.5% drop from here. In a range, the middle is the worst place to be long.

Debate:
post-image
XLM+2.82%
Everyone’s watching HYPE bleed—but the 4H chart just whispered a secret the crowd missed.

$HYPE /USDT - LONG

Trade Plan:
Entry: 85.409 – 85.721
SL: 84.072
TP1: 86.685
TP2: 87.431
TP3: 88.551

Why this setup?
Why now? The 1D trend is bullish, and the 4H MTF is *Armed* with 95% confidence. RSI on 15m sits at 58.18—not overheated, just warming up. ATR (1h) at 0.622 suggests volatility is coiled. Entry zone: 85.409–85.721. Targets: TP1 86.685, TP2 87.431. The invalidation line at 82.117 is your safety net. This isn’t a gamble—it’s a precision setup with a 2.4R to first target.

Debate:
If pr
HYPE+0.57%
Which #MemeCoin will do a 100X in 2026?
post-image
MEME+5.88%
  • 1
Load More

Join 40 M users in our growing community

⚡️ Join 40 M users in the crypto craze discussion

💬 Engage with your favorite top creators

👍 See what interests you

View More