

Square
Following
Hot
News
Profile
Share your thoughts
placeholder
Article
The U.S. stock market crash started with Nvidia.
I’m more curious about what happened.
post-image
NVDA-5.21%
  • 1
U.S GDP Beats expectation could a strong economy delay interest rate cuts ?will the federal reserve
live-cover
LIVE1,363
Trenches
PEPE
P
bade
b
PEPE
0x69...1933
Market Cap
$.
Change
.
24h Vol
$.
Holders
.
ZIG
Z
bade
b
ZIG
0x8c...1145
Market Cap
$.
Change
.
24h Vol
$.
Holders
.
SAFU
S
bade
b
SAFU
0xdd...7777
Market Cap
$.
Change
.
24h Vol
$.
Holders
.
GTA6
G
bade
b
GTA6
4kjr...zDnz
Market Cap
$.
Change
.
24h Vol
$.
Holders
.
IDOL
I
bade
b
IDOL
0x3b...ab07
Market Cap
$.
Change
.
24h Vol
$.
Holders
.
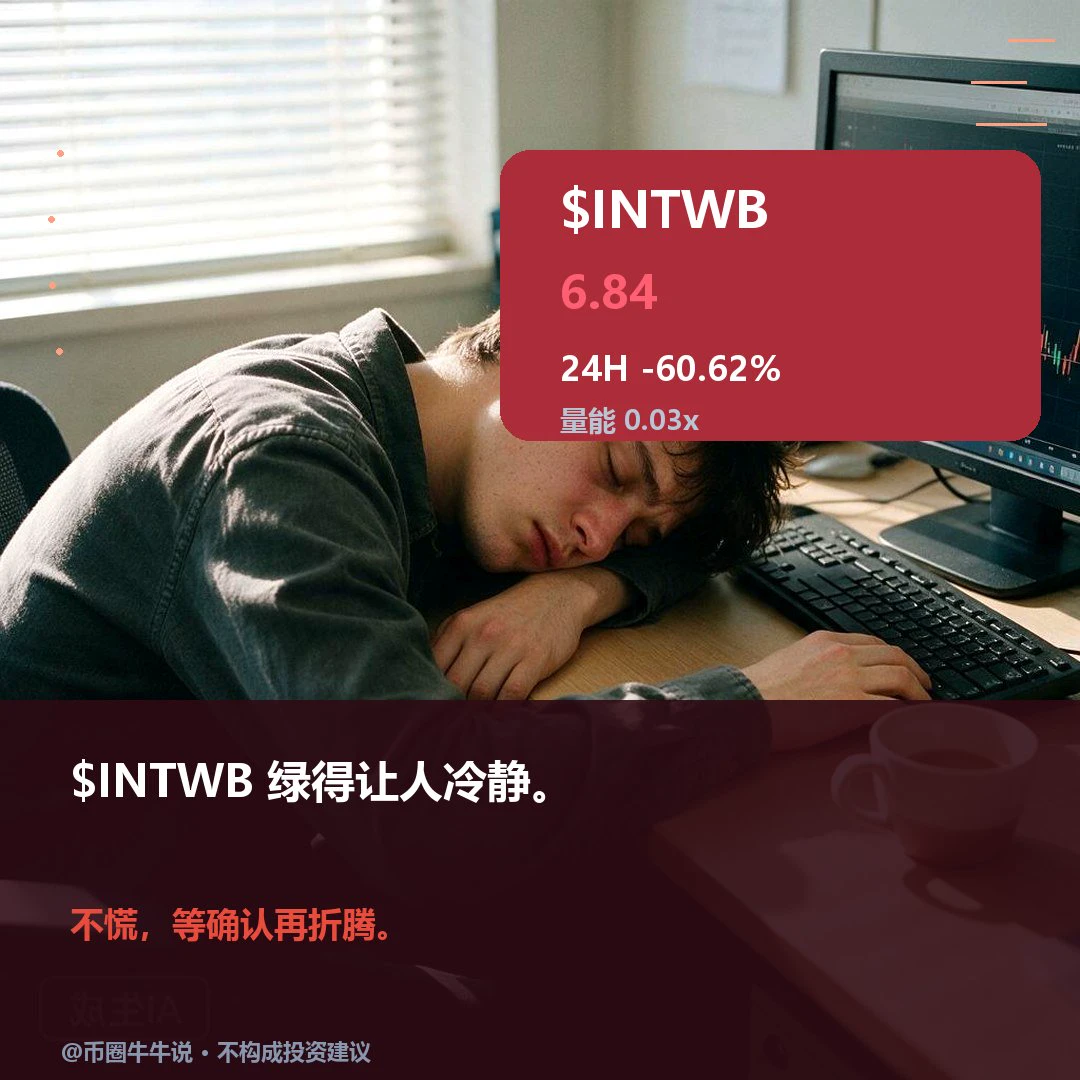
$INTWB Currently trading at 6.84, down 60.62% over 24H (range: 6.61–17.82). The 1H trend is weak, with an RSI of 16; the 4H trend is weak, with an RSI of 8. If it breaks above 17.82 decisively, the upside may warrant further monitoring; if it falls below support at 6.61, the short-term structure may weaken. The market is highly volatile; for observation only.
post-image
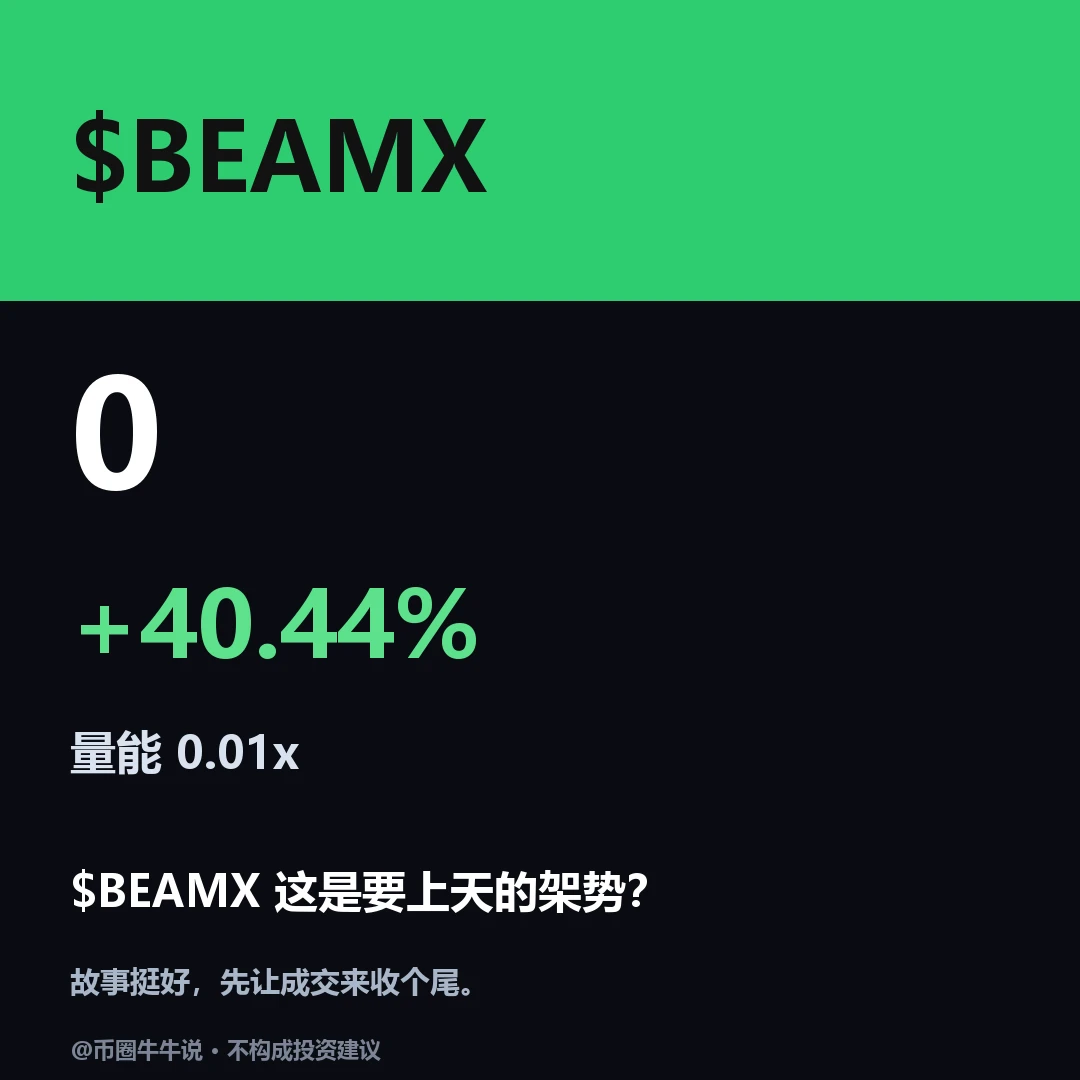
Leaning bullish. $BEAMX is currently at 0.004806. The trend remains strong, but the price is already approaching resistance at 0.0053. The real question is who will step in during the first pullback. The hourly and four-hour charts are both strong, but the short term is clearly crowded, making it increasingly costly to chase at these highs, while trading volume has not continued to expand. If the price approaches this resistance but still fails to produce decent volume, can this strength really be taken as confirmation of a continued move?
My view: the direction still leans bullish, but the cr
post-image
BEAMX+5.82%
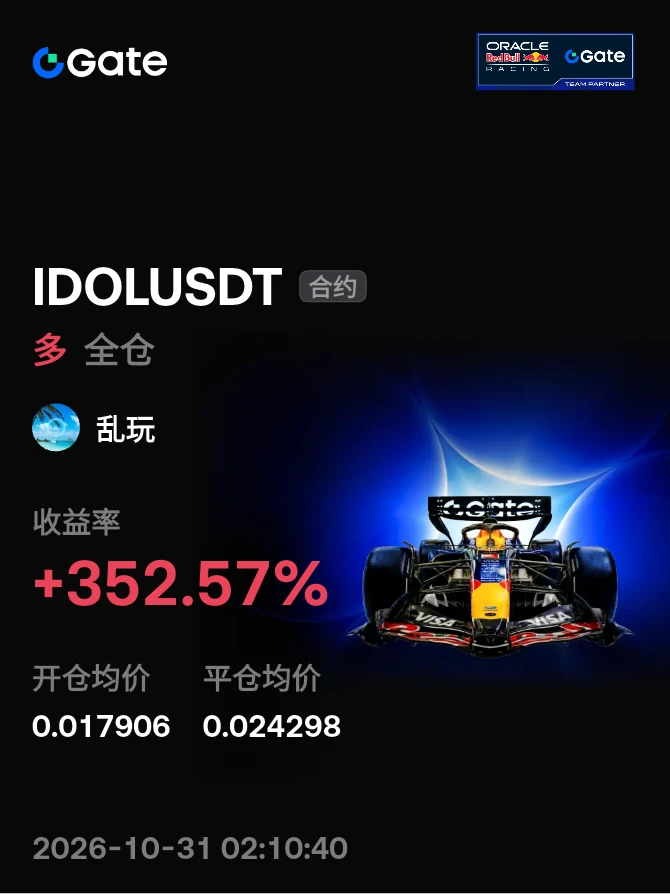
#晒出我的合约收益 Not looking good—it ran out of steam after just one push
post-image
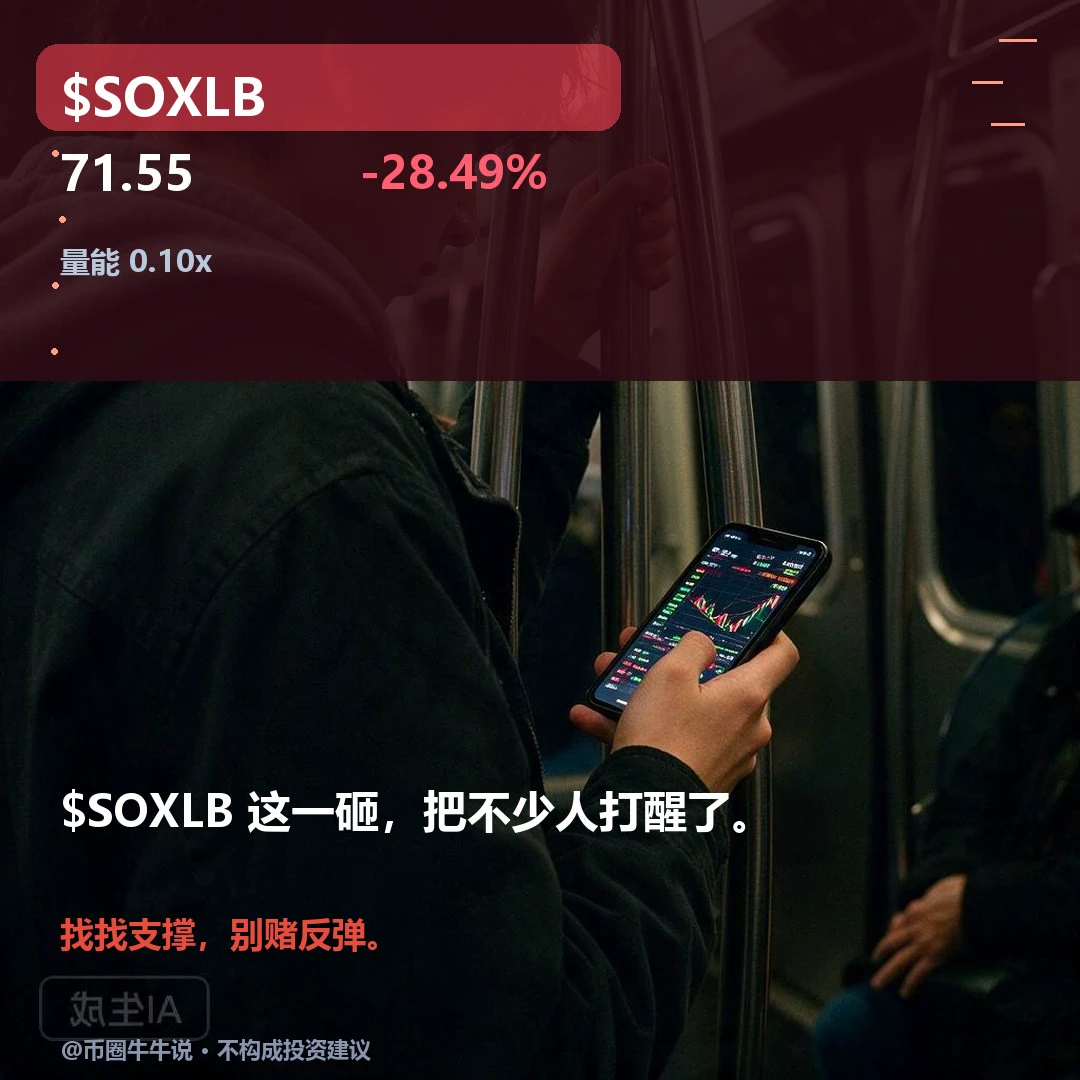
Weak. $SOXLB is currently at 71.55. The one-hour RSI has fallen to 8.62, and the four-hour RSI is just 19.66, but one-hour volume is less than 10% of normal, with no meaningful buying follow-through after the oversold reading.
When the price approaches support at 70.37 but still can't produce volume, can this oversold condition be treated as a bottom signal? Oversold is merely evidence that selling pressure has occurred, not proof that the price is cheap.
My view: the direction remains weak, and being oversold won't automatically trigger a reversal; only if meaningful volume returns while the
post-image
MARKET OVERVIEW
live-cover
LIVE1,061
Recap: On the afternoon of October 28, I went long and exited at breakeven. It rallied to 2280. We shorted at 2265, but got out when things didn’t look right. Then it dropped 70 points. When the US stock market opened that evening, I livestreamed two trades with everyone: SanDisk and ETH. I told everyone to set their stop-losses a little wider. SanDisk made a huge profit. I personally exited ETH at breakeven a little after 5 a.m. I posted in the strategy group telling everyone to exit at breakeven. By the time you woke up, it had already plunged, so you actually made a huge profit too. But sin
post-image
SNDK-14.83%
ETH-1.26%
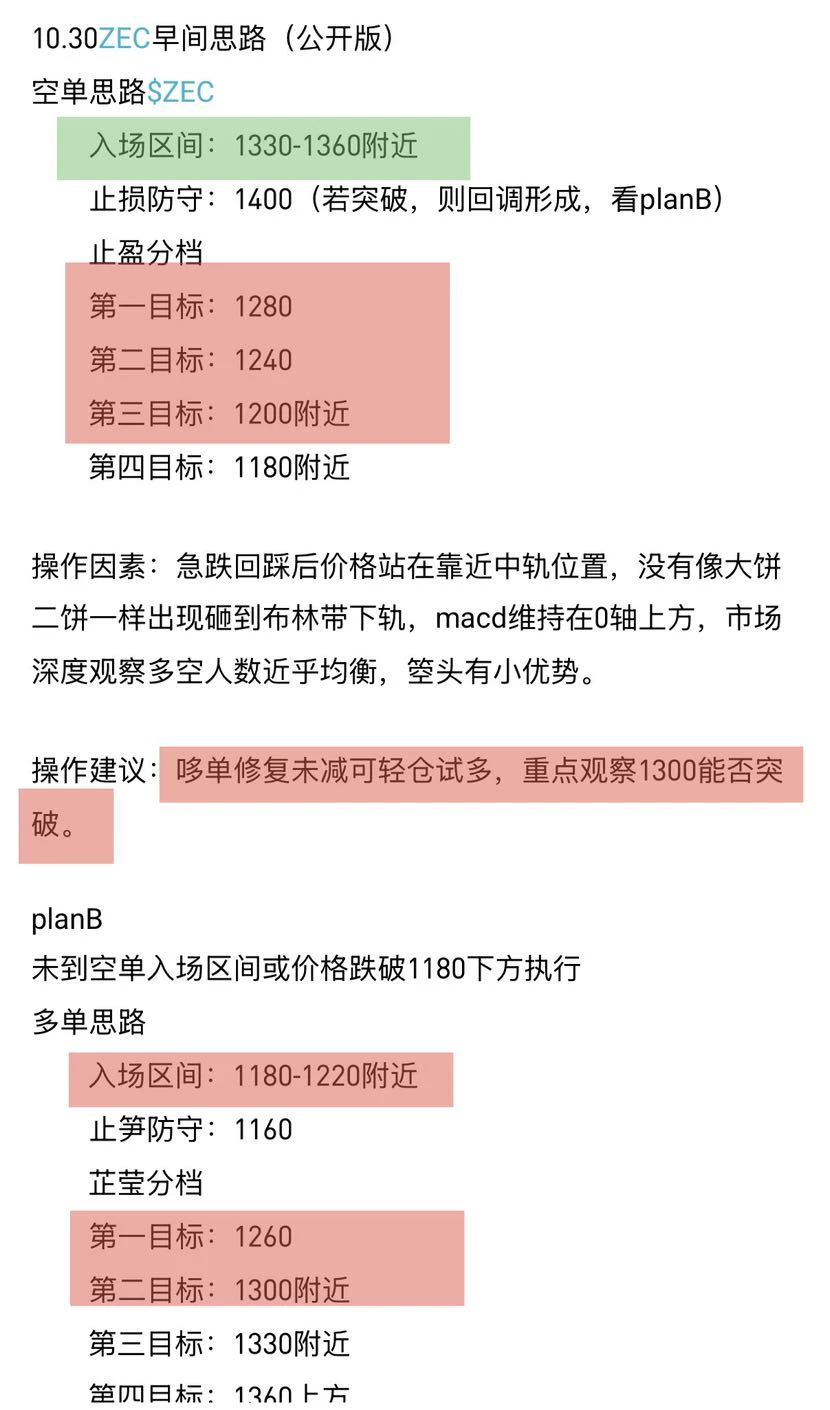
10.30 ZEC Long/Short Outlook Review
Strategy review, current market analysis, and trading recommendations:
Strategy review: $ZEC
Short entry at 1330 did not materialize; the third target at 1200 was reached
Long entry near 1180; the second target near 1290 was reached
A 15-point margin of error, within a reasonable range.
Current market: The main focus today was whether price could retest above 1300. Clearly, it did not, indicating the larger trend remains downward. The price pullback was too large, suggesting the price could be pushed higher to facilitate large holders' selling. Market depth
post-image
ZEC+1.29%
$SOXL - 19b of semis for rebal flow
post-image
SOXL-28.20%
  • 1
The market already knows Trump is going to lose the election and is front-running the move.
Saw Logan’s remarks while scrolling early this morning
The Dallas Fed president said at least two more 25-basis-point hikes are needed
After another 50bp in cumulative hikes, pause and assess; she called inflation not returning to 2% “unacceptable”
This week, she voted to hold rates at 3.75%-4.00%, but verbally nudged the endpoint higher
Skipping meetings without changing the endpoint; gradualism is to avoid tightening the economy too hard
Risk assets can only slow their pace for now
post-image
Enter the environment like fighter jet ✈️...proof of work saved me here🫠
W team 👨‍🍳🔥
post-image
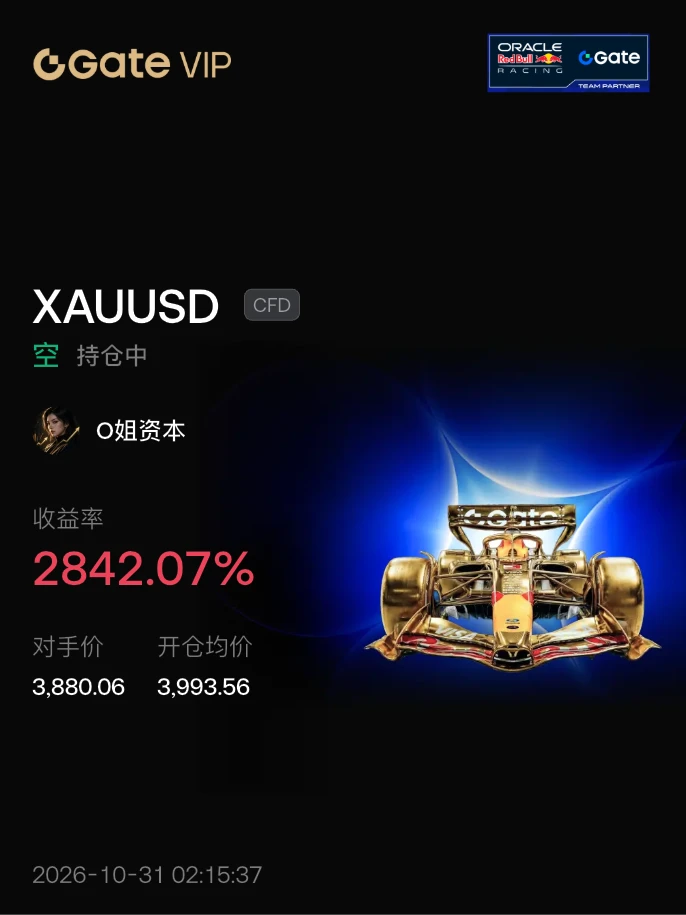
#晒出我的持仓收益 Gold CFDs, U.S. stock contracts, and ETH—you’ve been making a killing these past few days, huh
post-image
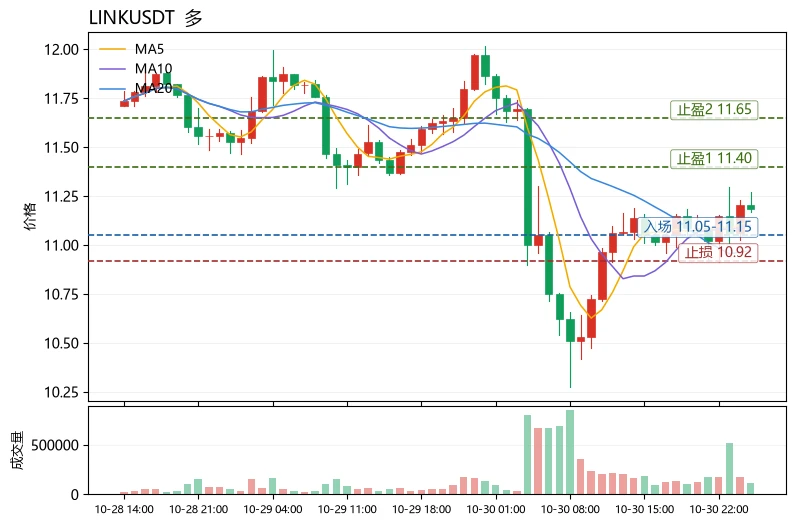
$LINK Current price: 11.186, down 4.70% in 24h, trading volume 77.2M, funding rate +0.0053%, Fear and Greed Index 30. The price pulled back from the upper Bollinger Band at 11.396 but remains above MA5 (11.1244) and MA20 (10.971), with the moving averages in bullish alignment. The MACD histogram remains positive at +0.0425, and RSI is neutral at 51.2. These figures indicate a short-term pullback, while the medium-term trend structure remains intact.
Here’s a reusable method using this coin as an example: use moving averages to judge whether a trend is healthy. Check three things: first, align
post-image
LINK-0.18%
XRP-1.15%
I strongly recommend this episode of the podcast featuring Altman; after listening, I was left with very mixed feelings.
I just finished listening to Sam Altman's latest interview, and a few details really made me feel that we may be going through a change even more intense than the internet revolution.
What moved me most was Altman describing something that happened inside OpenAI.
One weekend, they got a new model, and researchers excitedly threw at AI, one after another, the hardest math and science problems of their academic careers.
And the result? The AI actually solved them one after ano
post-image
AMZN-2.01%
“Market is down 1,000 points, please stop this bloodbath.”
post-image
Load More

Join 40 M users in our growing community

⚡️ Join 40 M users in the crypto craze discussion

💬 Engage with your favorite top creators

👍 See what interests you

Trending Topics

BTC大跌

150.86k Views39.42k Discussing

$BTC briefly fell below $77,000 and remains under pressure around the $77K zone, with its 24-hour decline still above 4%. With risk appetite weakening and Fed uncertainty rising, where is the next key support after losing $80K?

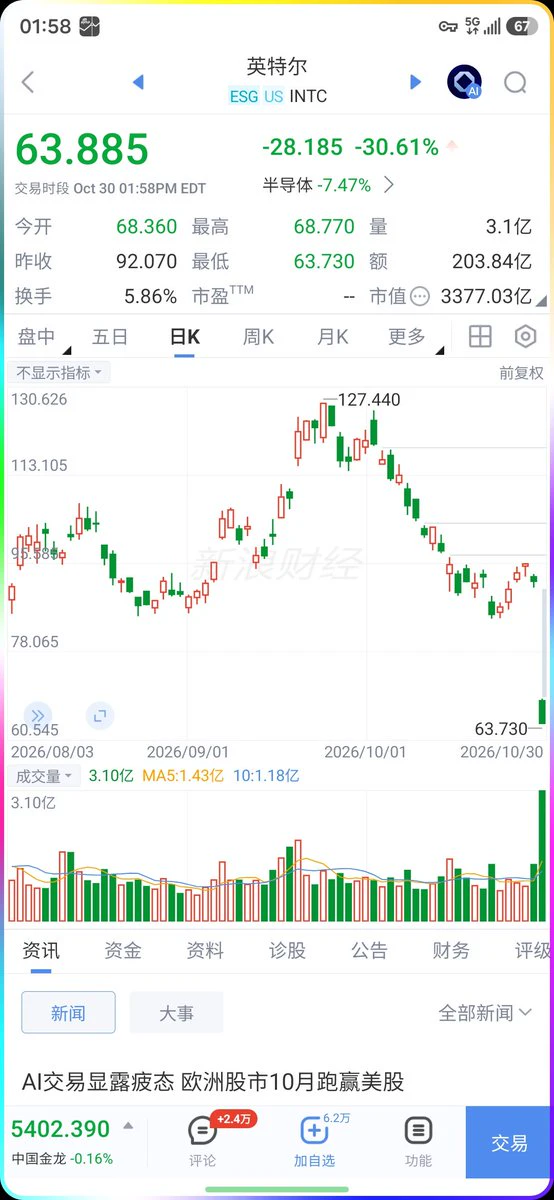
IntelBeatsEarningsButStockPlunges

11.48k Views698 Discussing

StrategySTRCNears100ParValue

14.19k Views4.02k Discussing

View More