





Square
Following
Hot
News
Notifications
Profile
Share your thoughts
placeholder
Article
market position
live-cover
LIVE1,886
$BTC
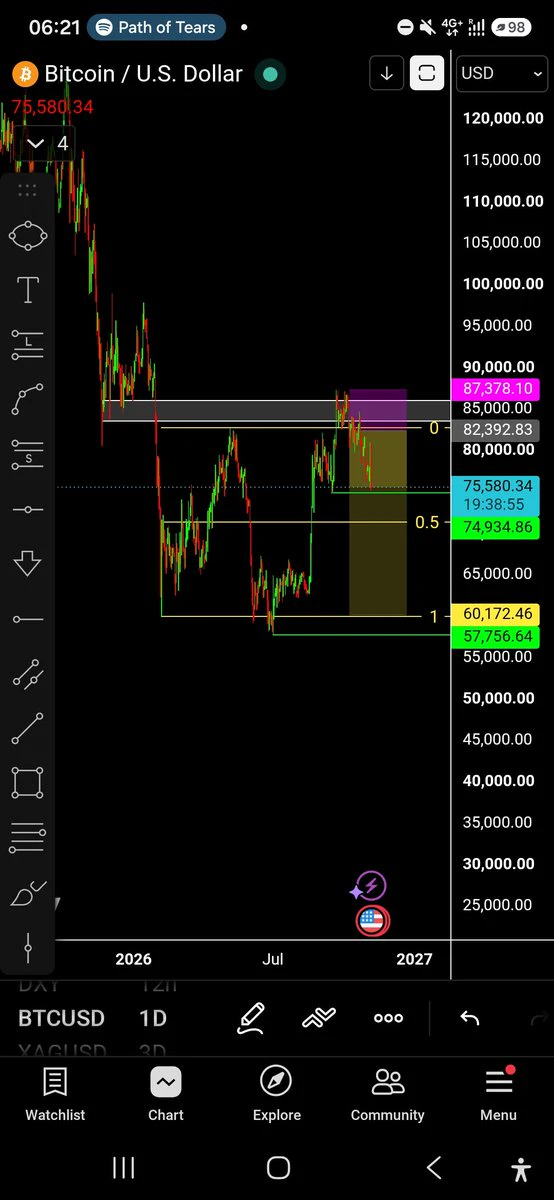
My hedge short setup
And levels I'm interested in looking for longs:
Deviation/SFP of upper green line = long
0.5 fib - bounce or deviations = long... Least favorite, 0.5 Fibs usually bring chop
Deviation/SFP of lower green line = long
NOTE: SFP's can get SFP'd
post-image
BTC-0.67%
Trenches
fxUSD
f
bade
b
fxUSD
0x08...d8f6
Market Cap
$.
Change
.
24h Vol
$.
Holders
.
ZIG
Z
bade
b
ZIG
0x8c...1145
Market Cap
$.
Change
.
24h Vol
$.
Holders
.
BTC
B
bade
b
BTC
C5xp...pump
Market Cap
$.
Change
.
24h Vol
$.
Holders
.
CORLA
C
bade
b
CORLA
0xba...7777
Market Cap
$.
Change
.
24h Vol
$
Holders
.
STONK
S
bade
b
STONK
6GmA...UNgx
Market Cap
$.
Change
.
24h Vol
$.
Holders
.
#CryptoMarketUnderPressure
‍#DailyStandouts #ShareWeekly $ETH $XRP $SOL
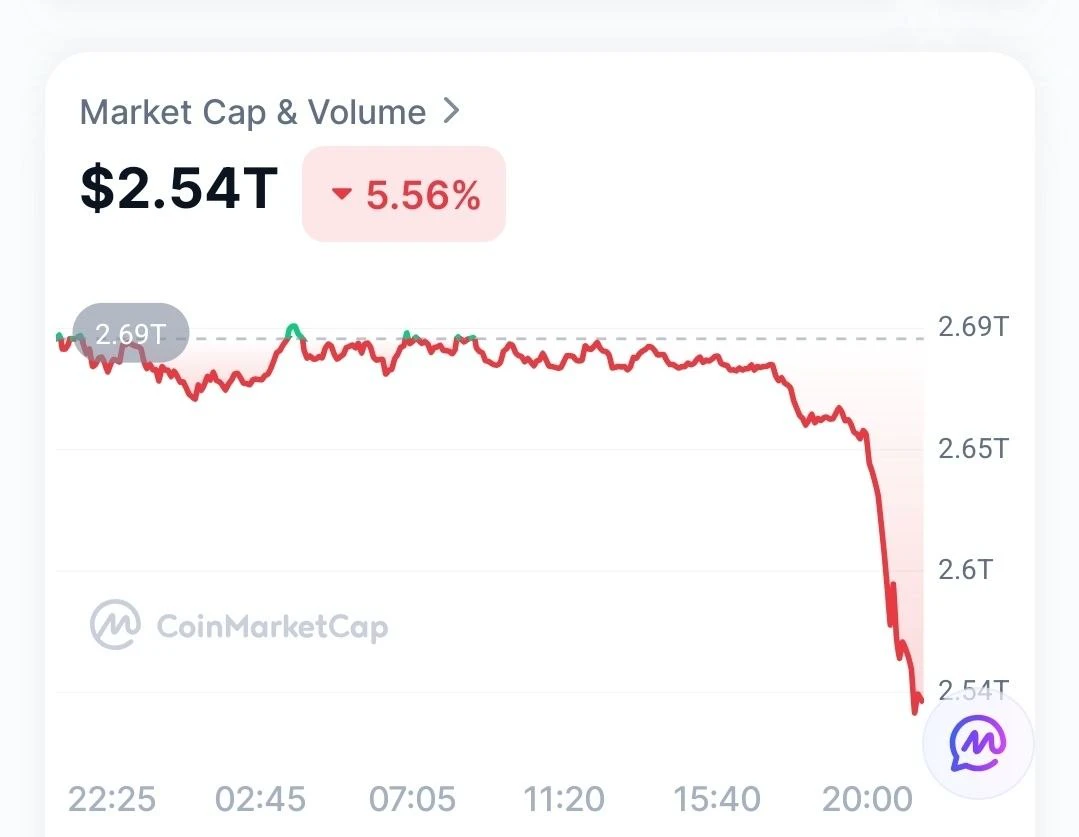
Crypto Market Under Pressure: Macro Selloff or Internal Liquidity Stress?

Crypto is facing pressure from two directions at the same time. Bitcoin, Ethereum, Solana and XRP have all moved lower as global risk appetite weakened, but the decline is exposing something deeper: the crypto market's own liquidity and positioning conditions are not particularly strong either.

I would not treat this as just another temporary reaction to falling technology stocks.

The macro connection is becoming harder to ignore

The November 5
post-image
ETH-1.23%
XRP-1.12%
SOL-0.74%
What is pairs trading? How can you determine whether two crypto assets are suitable for a trading pair, and avoid mistaking superficial correlation for a stable relationship?

In the cryptocurrency market, some assets often rise and fall together, but that does not mean their price relationship will remain stable. Pairs trading seeks opportunities by exploiting relative price deviations between two assets. It involves opening long and short positions simultaneously to reduce dependence on the overall market direction.

First, what is pairs trading?

Pairs trading is a common statistical arbitr
post-image
Market update
live-cover
LIVE1,928
  • 1
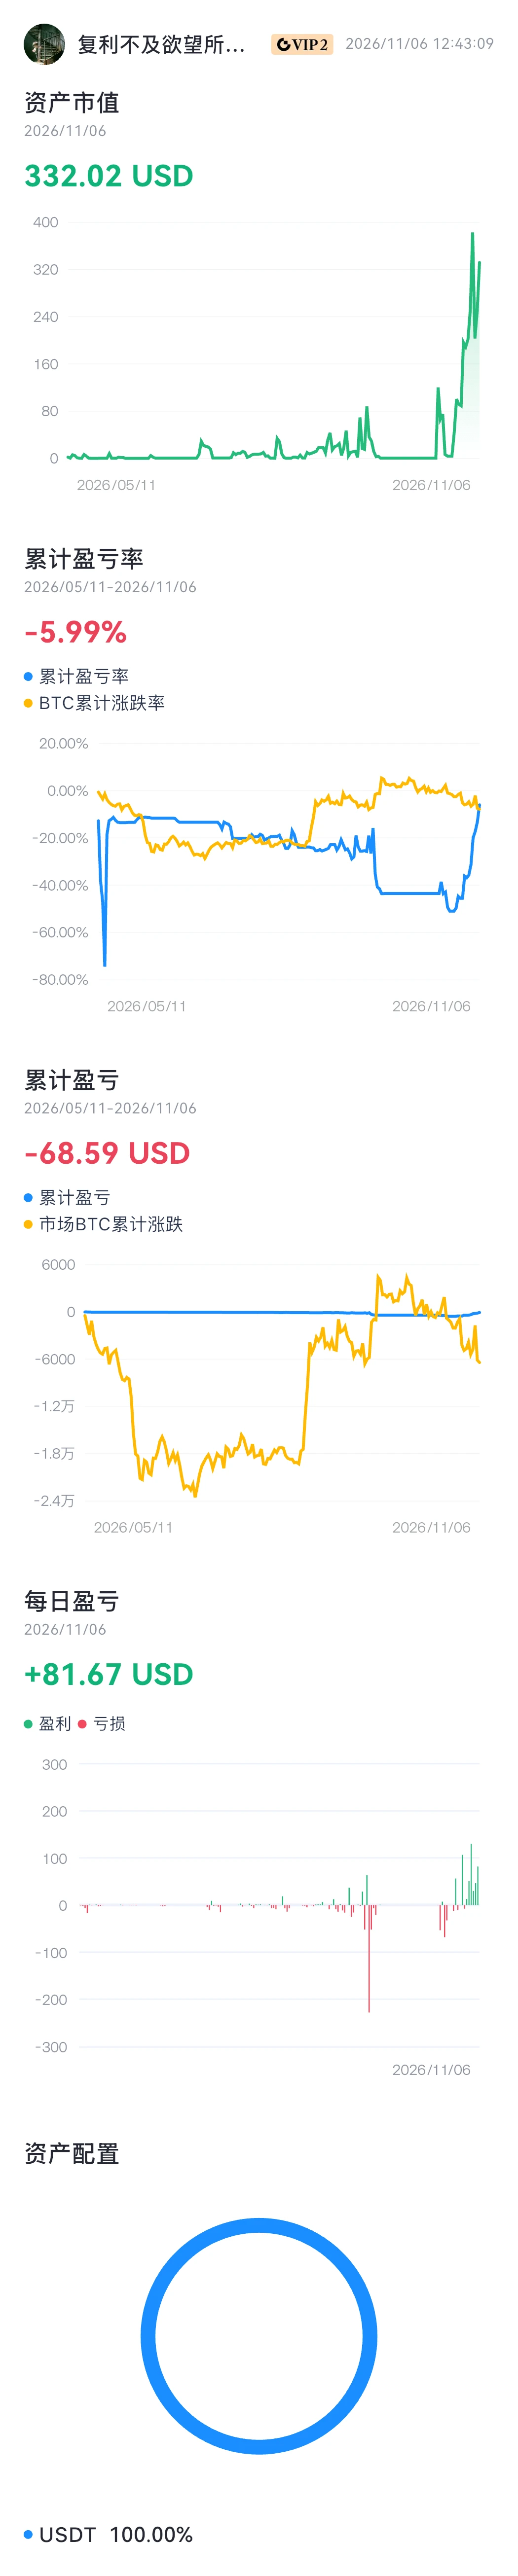
#资产分析 https://www.gate.com/wallet/assetsAnalysis
Breaking even and turning things around are just around the corner. The right timing, favorable conditions, and support are all indispensable. Starting copy-trading mode is truly a poor strategy! With no other choice, we’ll wait until the day we soar and see the light!
post-image
A heartbreaking drop? Don’t rush—take a look at this on-chain data first.
An ancient OG who got 1 million $ET through an ICO back in 2015 has been buying up crypto on-chain again over the past 8 hours—snapping up 2,221 ETH in one go for $4.99 million, at an average price of $2,248.

This veteran’s on-chain address currently holds over 122,000 ETH, worth more than $272 million at current prices.
While others are fearful, they’re greedy. Whales’ moves are often more convincing than the candlestick chart.
Risk warning: The above is solely an observation of on-chain data and does not constitute an
post-image
ETH-1.26%
That was the early sign. Now see and observe.

If I didn't have a time machine, I wouldn't have known either. Hahahahaj

Praise be to God, we tracked it ahead of time
post-image
  • 2
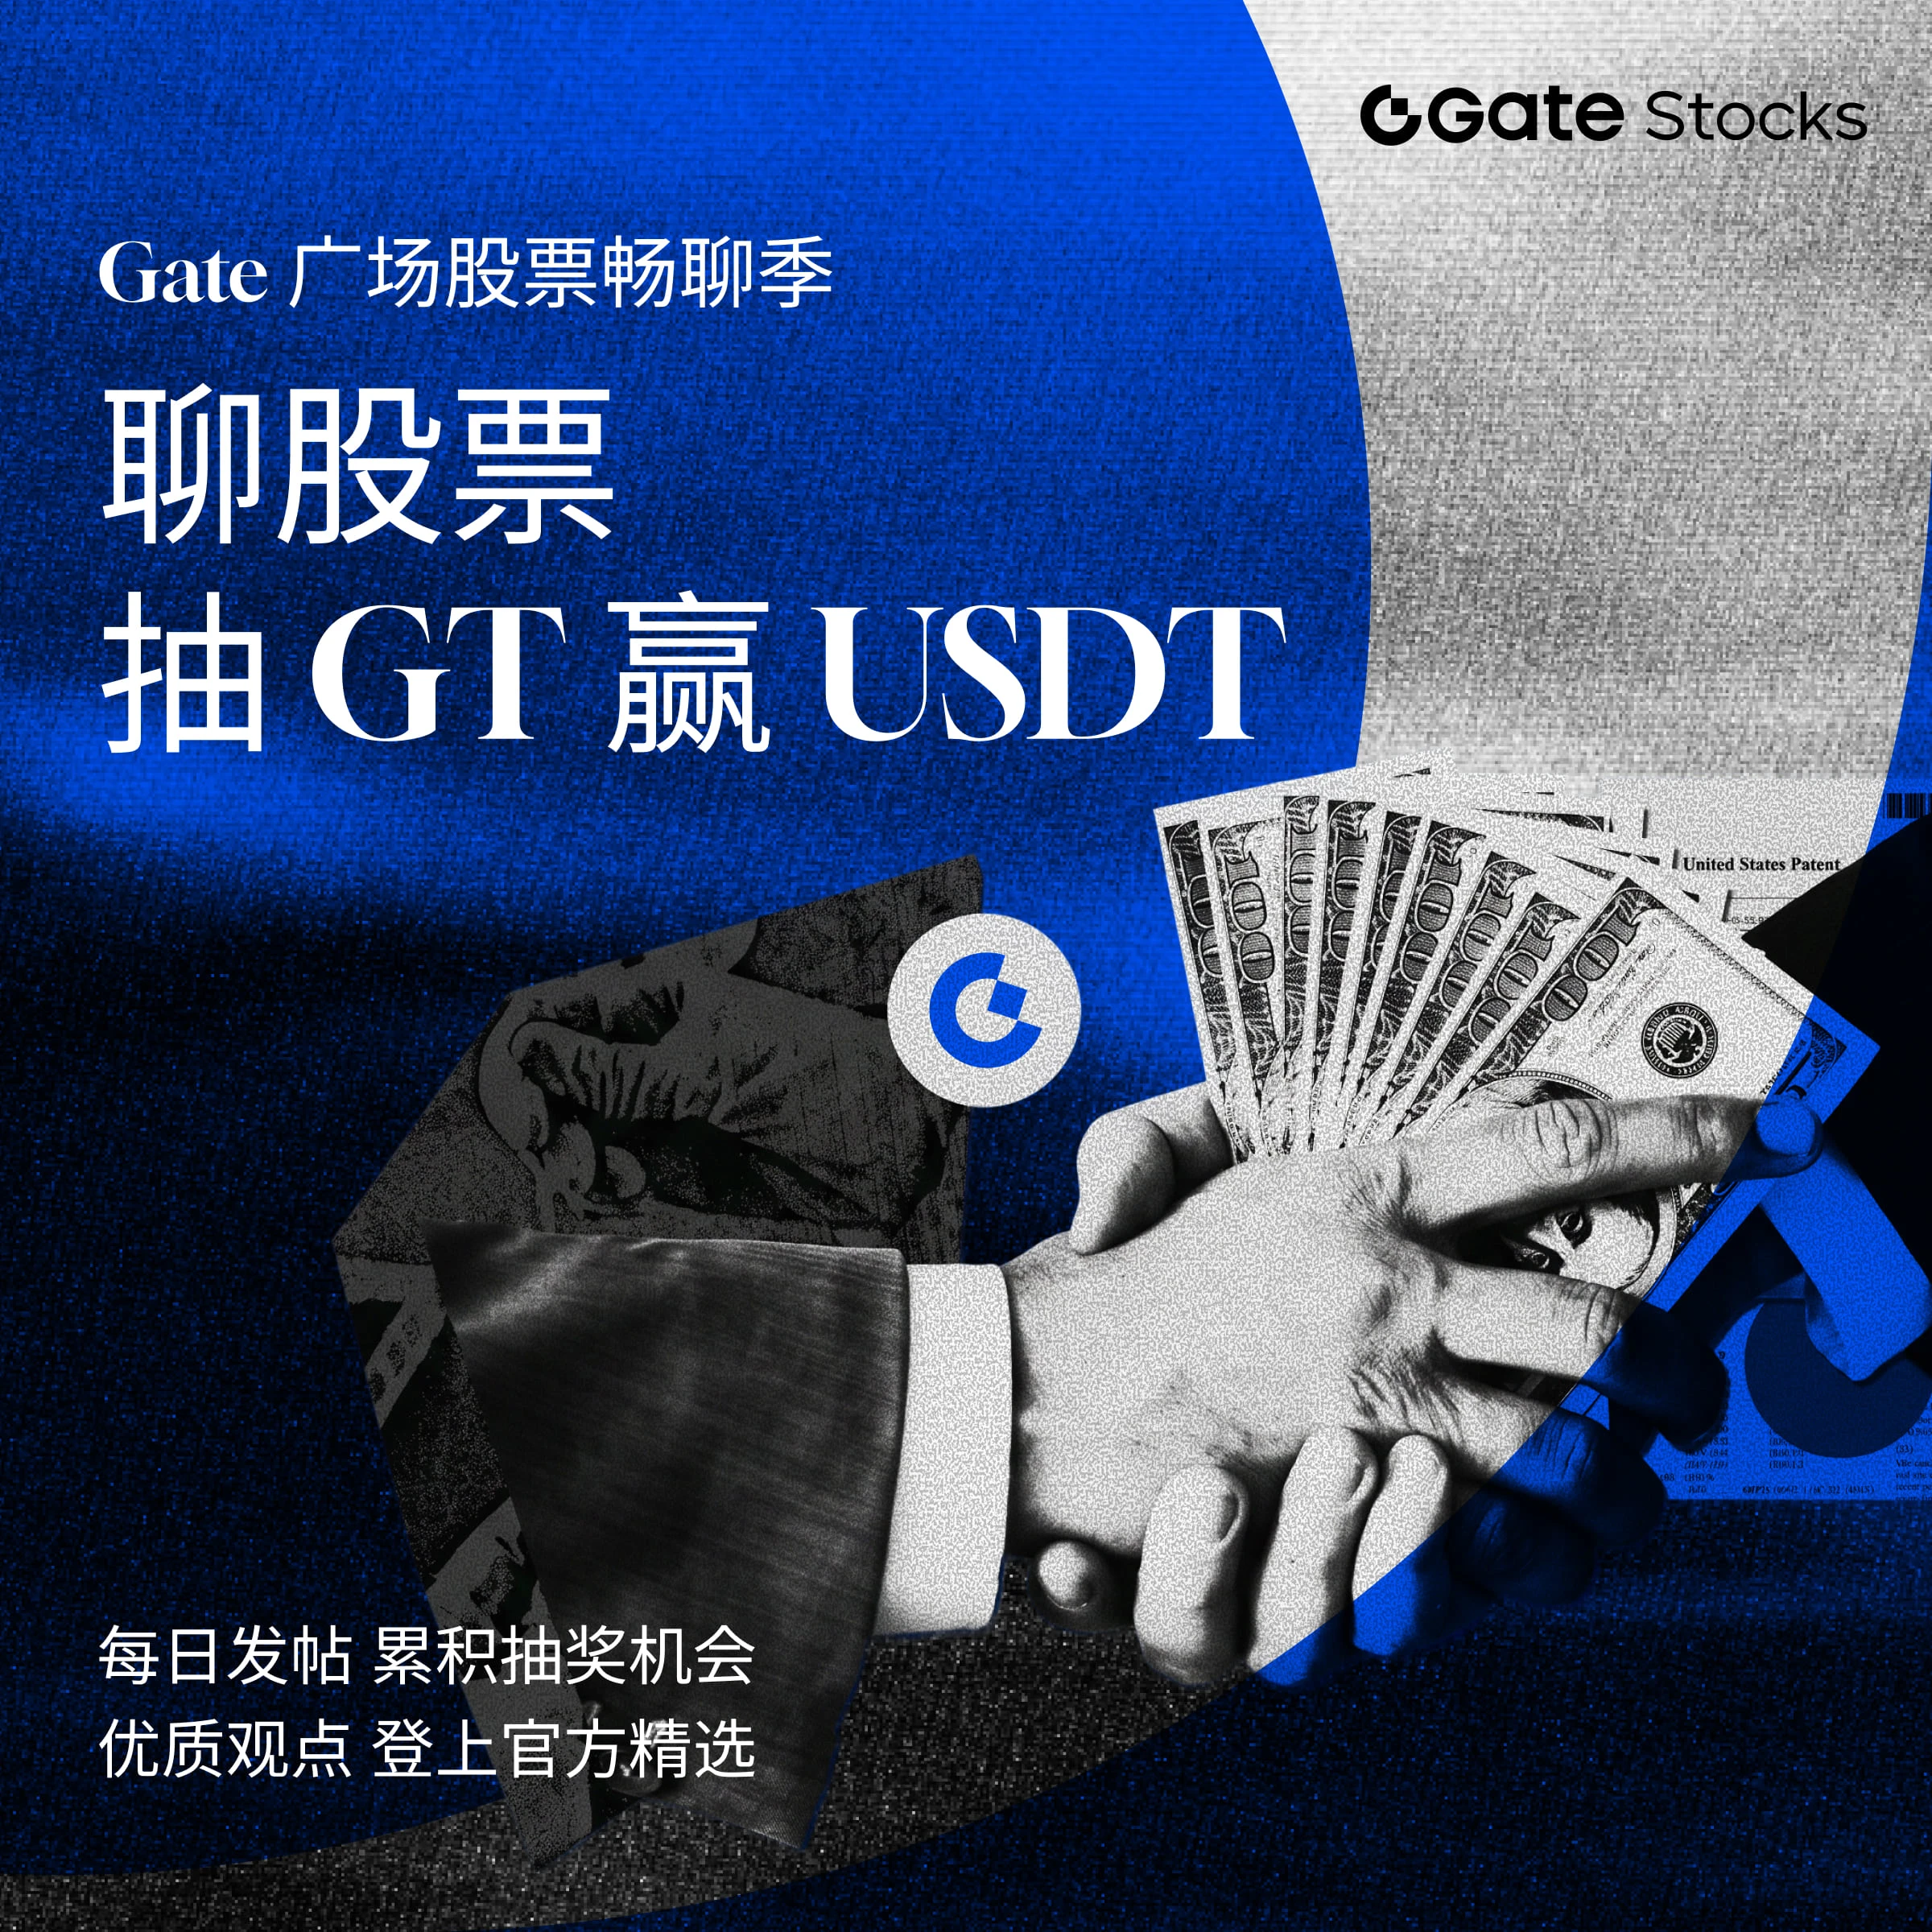
💰 Your stock insights deserve rewards—and to be seen
What signals do you look for when you’re bullish on a company? What concerns make you decide to keep waiting?

Join Gate Square’s stock discussion season to share your views and the reasoning behind them.
🌟 Each day, 3 quality creators will be selected to receive 5 USDT each, plus official featured placement to help more people see their valuable content.

Selection isn’t based on correctly predicting price movements or the number of posts. Well-supported opinions, valuable observations, and thoughtful reviews all have a chance to be selec
GateSquare
💰 Your stock insights deserve rewards—and to be seen
What signals do you look for when you’re bullish on a company? What concerns make you decide to keep waiting?

Join Gate Square’s stock discussion season to share your views and the reasoning behind them.
🌟 Each day, 3 quality creators will be selected to receive 5 USDT each, plus official featured placement to help more people see their valuable content.

Selection isn’t based on correctly predicting price movements or the number of posts. Well-supported opinions, valuable observations, and thoughtful reviews all have a chance to be selected.

Sign up first, then #Gate股票畅聊季 publish original content👇
👉 Sign up now:
https://www.gate.com/campaigns/6898
📄 Event details:
https://www.gate.com/announcements/article/102611
repost-content-media
  • 1
  • 1
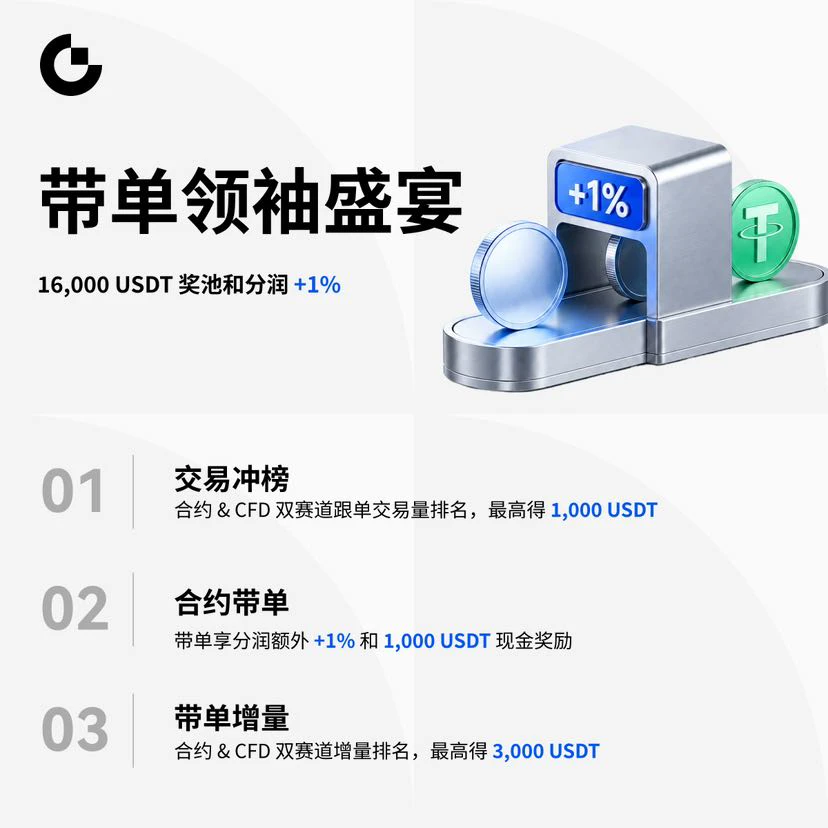
🔥 Copy Trading Pros, Take Note! Compete on Merit for a Share of the 16,000 USDT Prize Pool

🥇 Copy Trading Volume Leaderboard: Top 10 finalists can win up to 1,000 USDT
👑 Most Popular Trader: One winner takes home 1,000 USDT + an extra 1% profit share
🚀 Trading Growth Breakthrough: Top 5 in trading growth can win up to 1,500 USDT

🔗 Event link: https://www.gate.com/campaigns/6786
CopyTrading
🔥 Copy Trading Pros, Take Note! Compete on Merit for a Share of the 16,000 USDT Prize Pool

🥇 Copy Trading Volume Leaderboard: Top 10 finalists can win up to 1,000 USDT
👑 Most Popular Trader: One winner takes home 1,000 USDT + an extra 1% profit share
🚀 Trading Growth Breakthrough: Top 5 in trading growth can win up to 1,500 USDT

🔗 Event link: https://www.gate.com/campaigns/6786
repost-content-media
  • 3
Are you the same too?
Yesterday: a raging bull market
Today: play a 🐔 and hurry up and go to zero ​​​
#每周来晒
post-image
  • 2
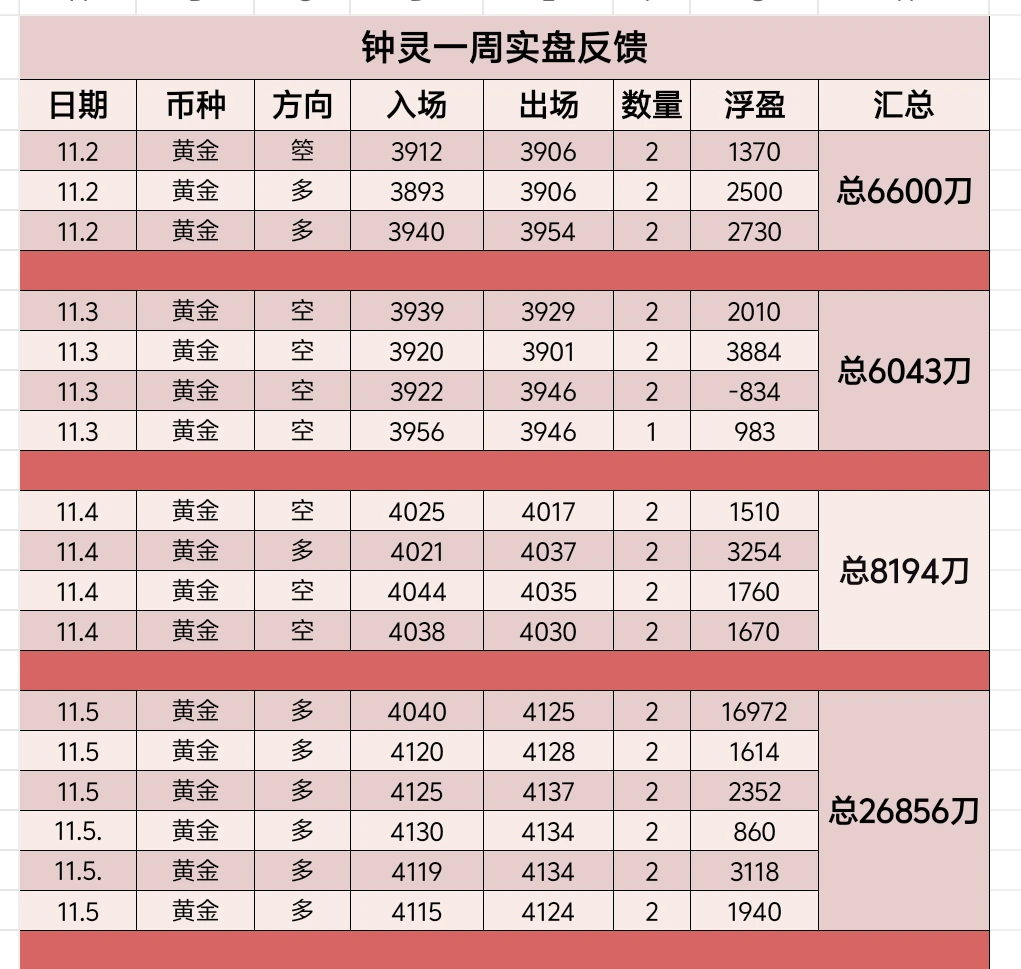
Market orders! Short-term trades! Swing trades! Yesterday, all three strategies were deployed together! All 6 trades hit take-profit!! Smoothly banked $26,856
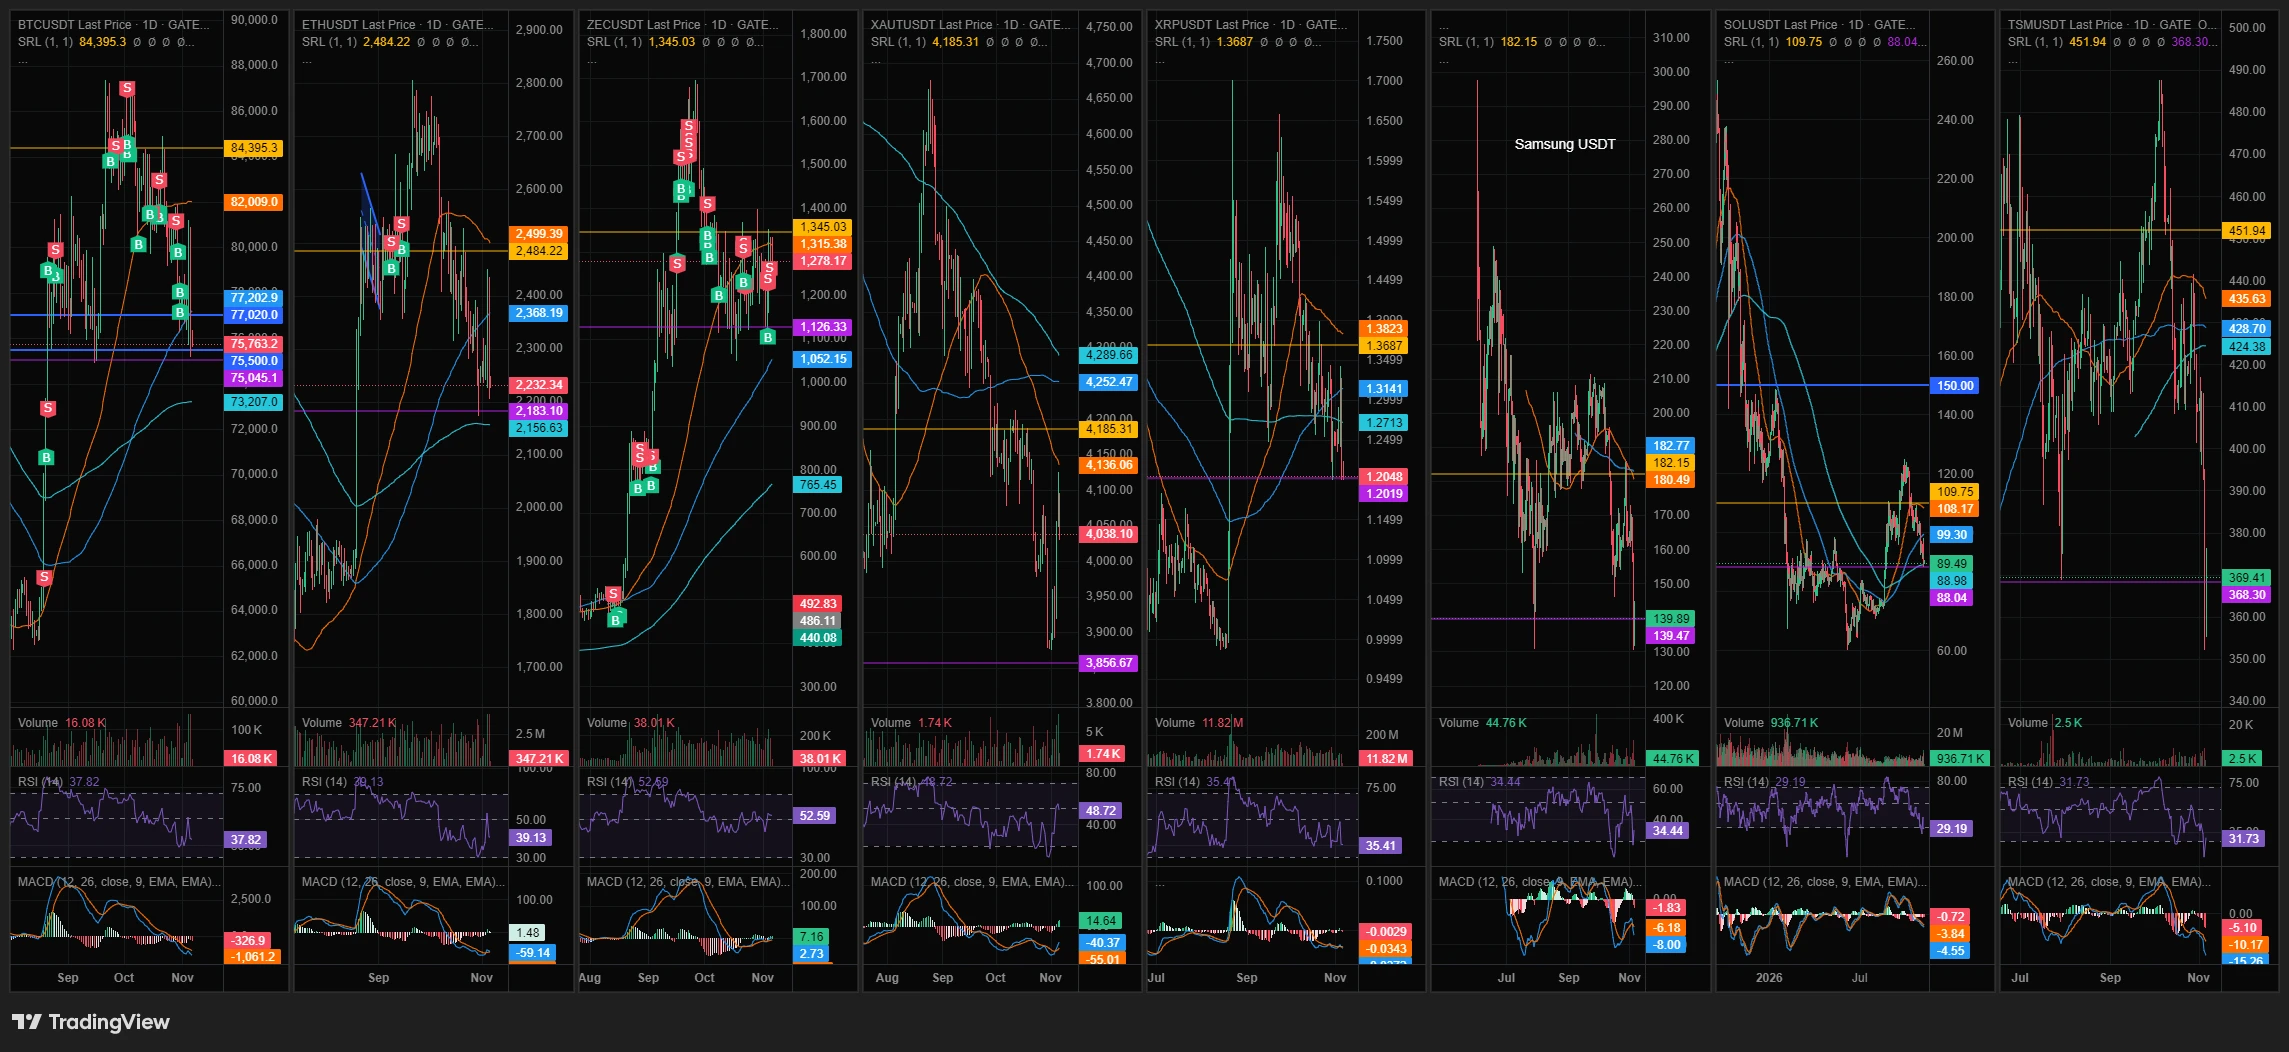
$XAU $BTC #美股史诗级抛售 #10月非农数据聚焦 #ETH跌5.5% #亚太股市集体重挫
post-image
XAU+0.38%
BTC-0.65%
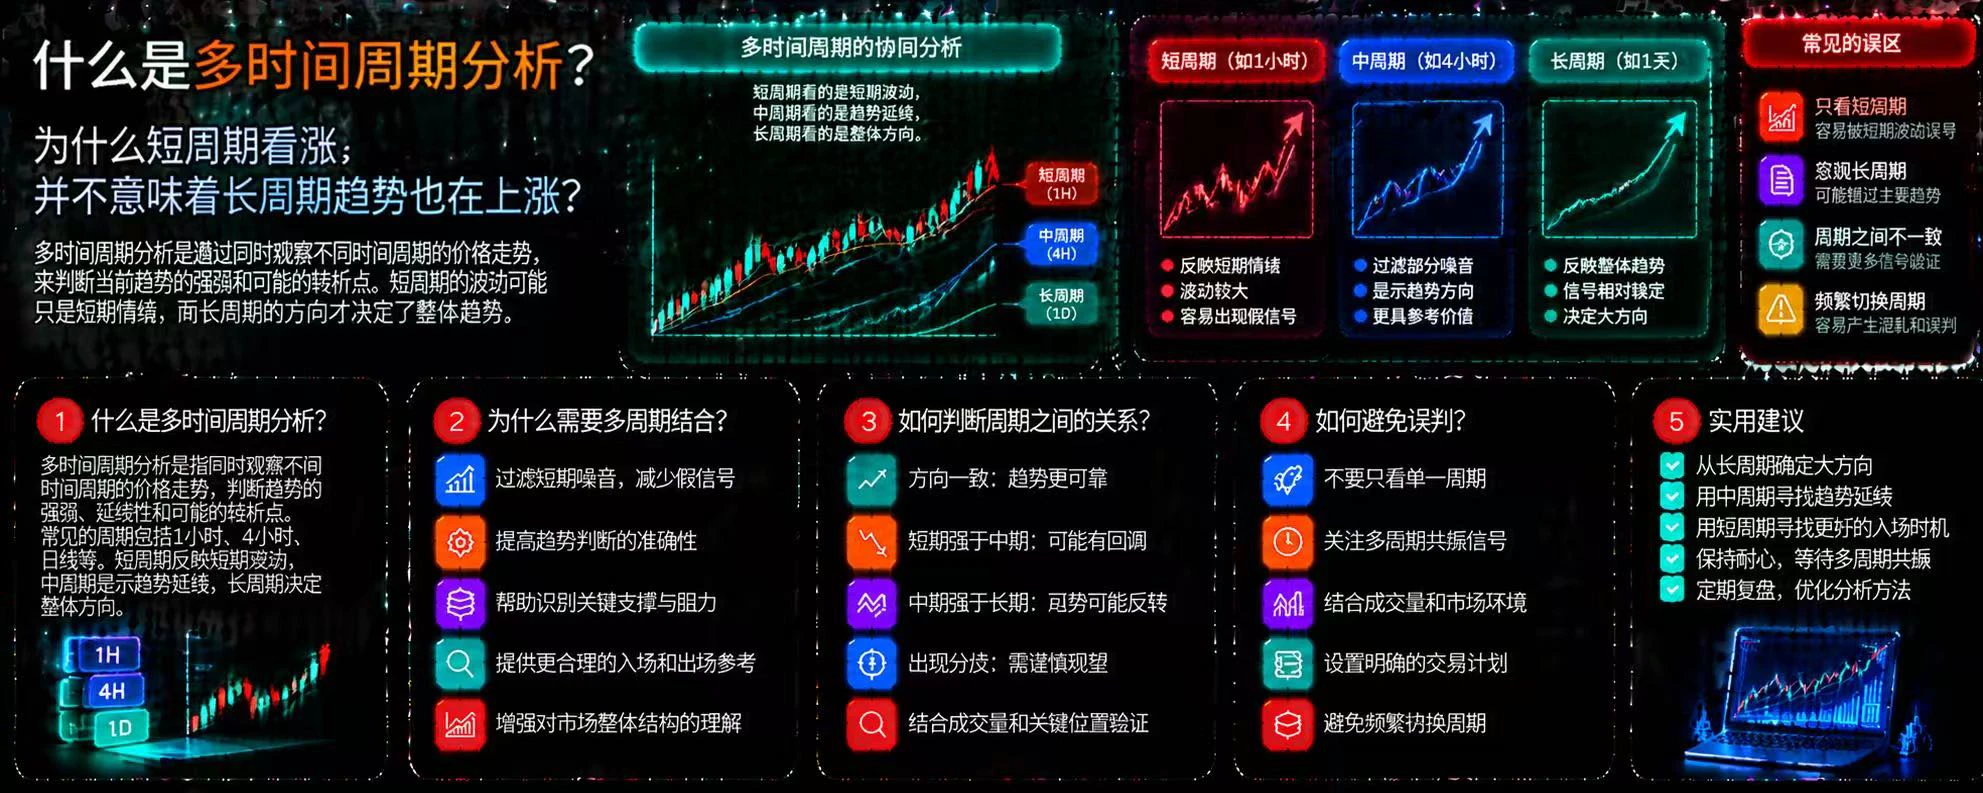
What Is Multi-Timeframe Analysis? Why Doesn't a Bullish Short Timeframe Mean the Long-Term Trend Is Also Rising?

In cryptocurrency trading, the same asset can show completely different price movements across different timeframes. The 15-minute chart may be rising, while the 4-hour chart remains in a downtrend, and the daily chart may show the market moving sideways. Looking at just one timeframe can easily lead you to mistake a brief rebound for a trend reversal.

First, what is multi-timeframe analysis?

Multi-timeframe analysis means observing price movements across different timeframes at
post-image
🔥 What are we discussing today? Trending topics on Gate Square have been updated!

🔹 #Epic Sell-Off in U.S. Stocks
Tech stocks are facing a wave of heavy selling. Will this correction continue?
🔹 #October Nonfarm Payrolls in Focus
The nonfarm payrolls report is due tonight. Will it trigger a market rebound or further losses?
🔹 #Crypto Market Under Pressure
$BTC and $ETH are following global risk assets lower. Is now the time to buy the dip or keep waiting?

Quality content can receive a traffic boost + featured recommendations.
💰 Got a take? Join the discussion:
https://www.gate.com/post
post-image
BTC-0.67%
ETH-1.26%
  • 13
  • 5
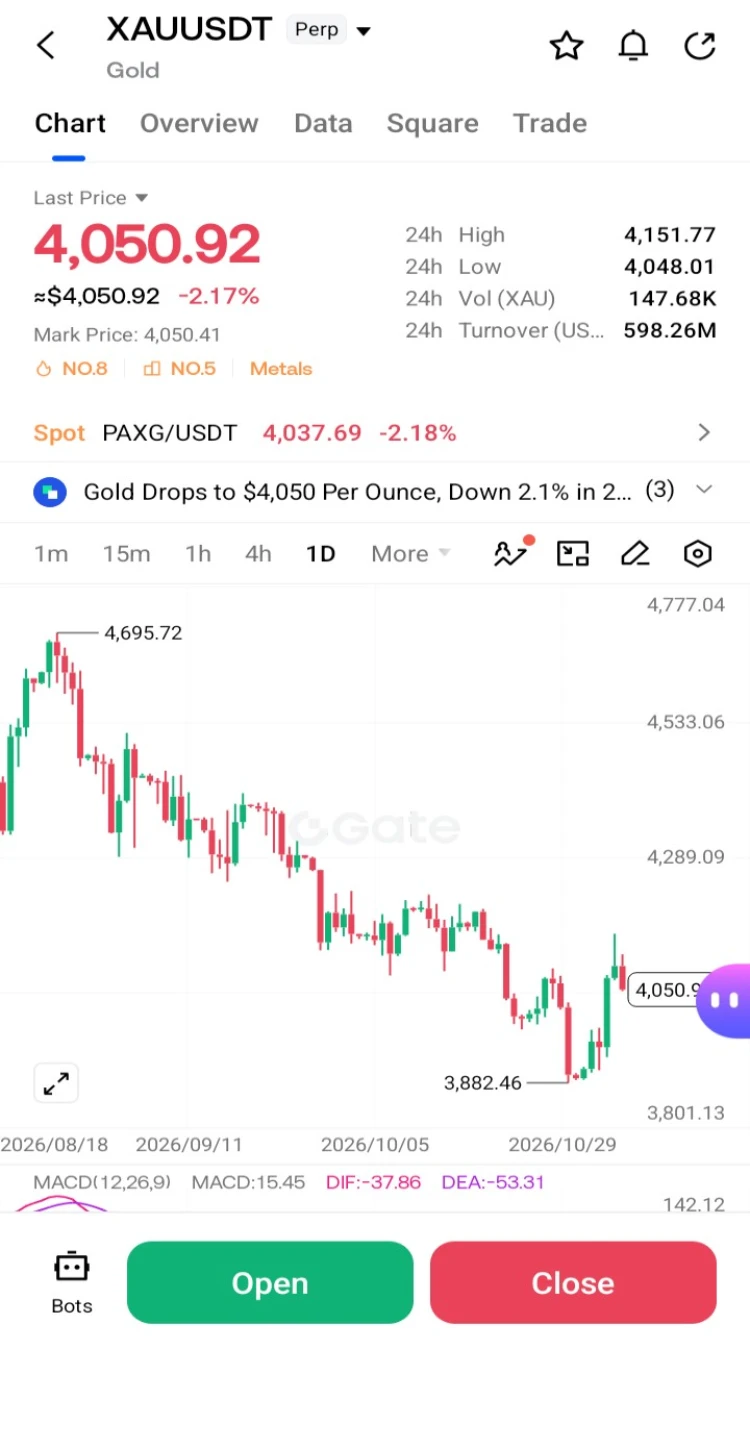
GOLD is showing signs of recovery, but the next resistance test could decide where the market goes from here.

After recent selling pressure, $XAU USD has bounced strongly, with a weaker US dollar and declining Treasury yields helping support the recovery.

Here are the levels I'm watching:

📍 Resistance: $4,113 – $4,150
📍 Support: $4,100 – $4,065
📍 Major downside area: $4,025 – $4,000

My market view:

If buyers manage to push Gold above $4,113 and hold that level, a move toward $4,150 could become possible.

However, losing the $4,065 support zone would weaken the recovery and bring selle
post-image
XAU+0.38%
  • 2
  • 1
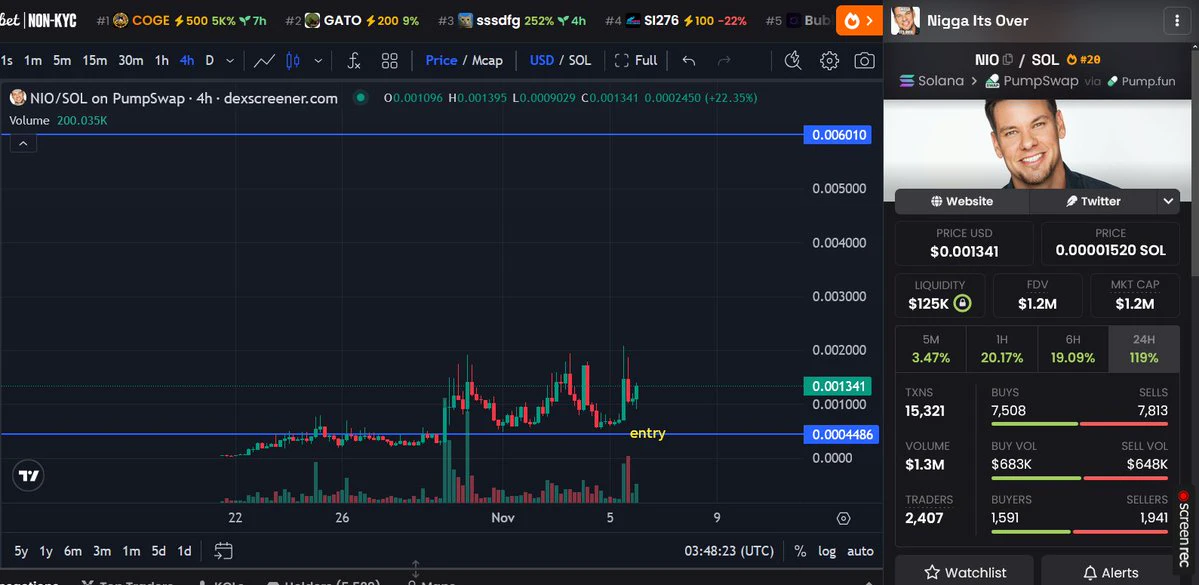
solana:7SL2VnfYsChvog5oQY9Nmtqu1wceaMiQzWoqoLQpump I haven’t sold. I remain optimistic.
post-image
SOL-0.77%
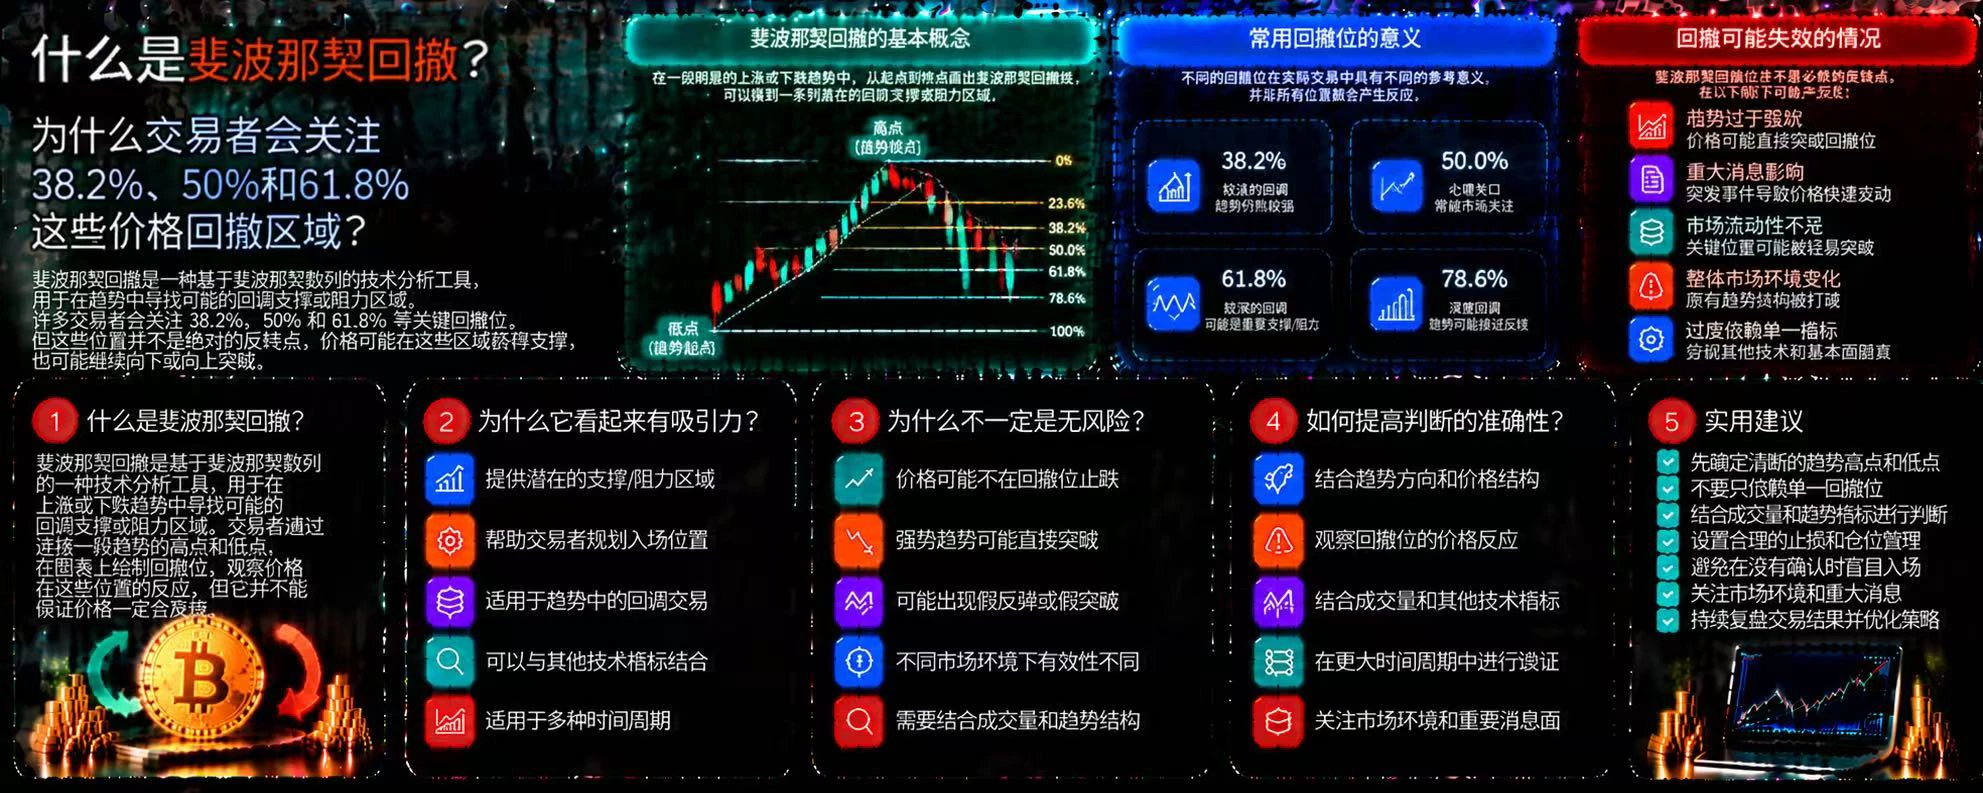
What Is Fibonacci Retracement? Why Do Traders Pay Attention to the 38.2%, 50%, and 61.8% Price Retracement Levels?

In crypto trading, prices often pull back after rising and may rebound after falling. Fibonacci retracement is a common technical analysis tool that traders use to identify potential support and resistance zones based on specific ratios. However, these ratios do not mark places where prices must reverse, nor do they guarantee profitable trades.

First, what is Fibonacci retracement?

It calculates different retracement levels between the start and end points of a significant pric
post-image
🪔 HAPPY DHANTERAS 2026 🪔
🙏 शुभ धनतेरस
✨ May Goddess Lakshmi bless you and your family with wealth, good health, happiness & prosperity.❤️
🙏 धनतेरस की हार्दिक शुभकामनाएँ!
❤️ With Love
🔥 TEAM CRYPTO AMAN 🔥
post-image
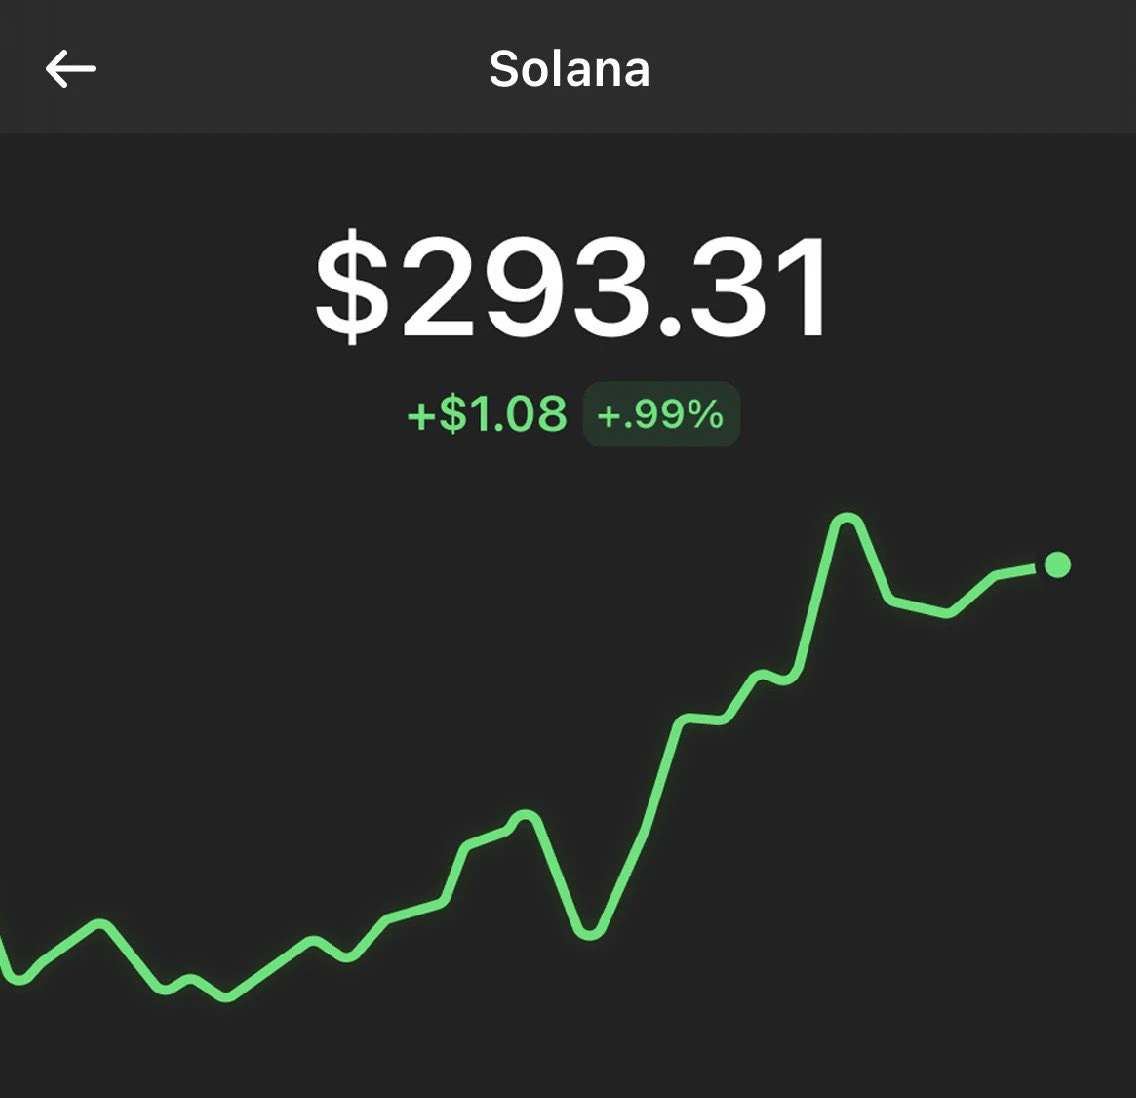
If sol can get back to these levels again I’m gonna throw so many people sol
post-image
SOL-0.77%
🔥 What are we discussing today? Trending topics on Gate Square have been updated!

🔹 #Epic Sell-Off in U.S. Stocks
Tech stocks are facing a wave of heavy selling. Will this correction continue?
🔹 #October Nonfarm Payrolls in Focus
The nonfarm payrolls report is due tonight. Will it trigger a market rebound or further losses?
🔹 #Crypto Market Under Pressure
$BTC and $ETH are following global risk assets lower. Is now the time to buy the dip or keep waiting?

Quality content can receive a traffic boost + featured recommendations.
💰 Got a take? Join the discussion:
https://www.gate.com/post
GateSquare
🔥 What are we discussing today? Trending topics on Gate Square have been updated!

🔹 #Epic Sell-Off in U.S. Stocks
Tech stocks are facing a wave of heavy selling. Will this correction continue?
🔹 #October Nonfarm Payrolls in Focus
The nonfarm payrolls report is due tonight. Will it trigger a market rebound or further losses?
🔹 #Crypto Market Under Pressure
$BTC and $ETH are following global risk assets lower. Is now the time to buy the dip or keep waiting?

Quality content can receive a traffic boost + featured recommendations.
💰 Got a take? Join the discussion:
https://www.gate.com/post/topic
repost-content-media
BTC-0.67%
ETH-1.26%
  • 2
  • 1
Load More

Join 40 M users in our growing community

⚡️ Join 40 M users in the crypto craze discussion

💬 Engage with your favorite top creators

👍 See what interests you

Trending Topics

USStocksFaceHistoricSelloff

1.63k Views3.51k Discussing

U.S. stocks suffered a sharp selloff on Thursday, with the Nasdaq closing down more than 5% and the Philadelphia Semiconductor Index falling over 12%. AI and chip stocks including $NVDA and $AMD were hit especially hard. Markets are reassessing AI valuations, data-center spending and future returns. Is this just short-term deleveraging, or the start of a deeper correction in the AI trade? Which sectors are you watching next?

GateLaunchesPoSECProofOfSecurity

12.56k Views574 Discussing

USNonfarmPayrolls

9.83k Views4k Discussing

View More