Square
Following
Hot
News
Notifications
Profile
Share your thoughts
placeholder
Article
Spot gold lost the $4,000 level this week under pressure from a strong dollar and U.S. Treasury yields, ultimately closing near $3,880. In terms of chart structure, the larger and smaller timeframes are locked in an intense bull-bear tug-of-war: the weekly chart formed a large bearish candle with a long body, erasing the gains from the previous rebound and confirming a broad medium-term consolidation as prices retreat from their highs; on the daily chart, prices broke below several key moving-average supports and are moving within a descending channel, with bears still in control. However, on
post-image
XAU+0.38%
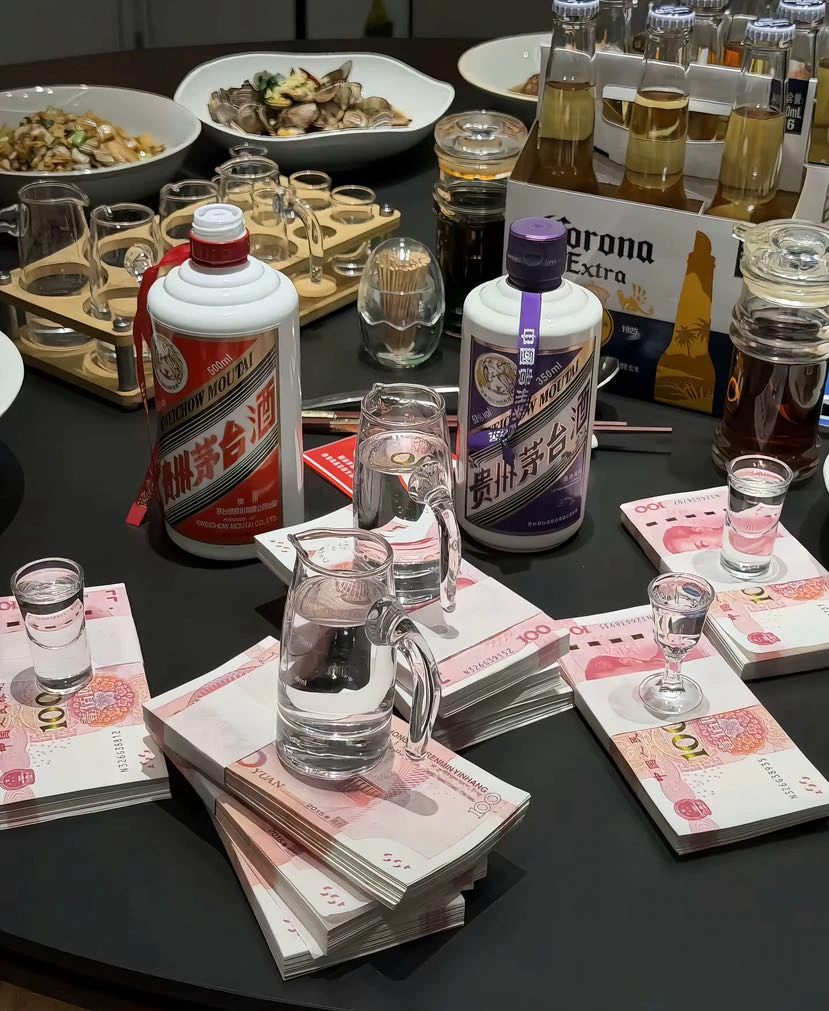
Hahaha, I hope there are situations like this every day, so I won’t have to gamble in crypto anymore#比特币跌破7万美元 #ETH一度跌破2000美元 #BTC #ETH
post-image
BTC-0.67%
ETH-1.26%
Trenches
mihao
m
bade
b
mihao
4Cxj...pump
Market Cap
$.
Change
.
24h Vol
$.
Holders
.
IDOL
I
bade
b
IDOL
0x3b...ab07
Market Cap
$
Change
.
24h Vol
$.
Holders
.
FOOD
F
bade
b
FOOD
FTu5...pump
Market Cap
$.
Change
.
24h Vol
$.
Holders
.
Sakura
S
bade
b
Sakura
9sFG...pump
Market Cap
$.
Change
.
24h Vol
$.
Holders
.
AGT
A
bade
b
AGT
0x5d...e274
Market Cap
$.
Change
.
24h Vol
$.
Holders
.
South Korean chip stocks rebound against the trend! KOSPI rises over 2, while SK Hynix and Samsung g
live-cover
LIVE2,510
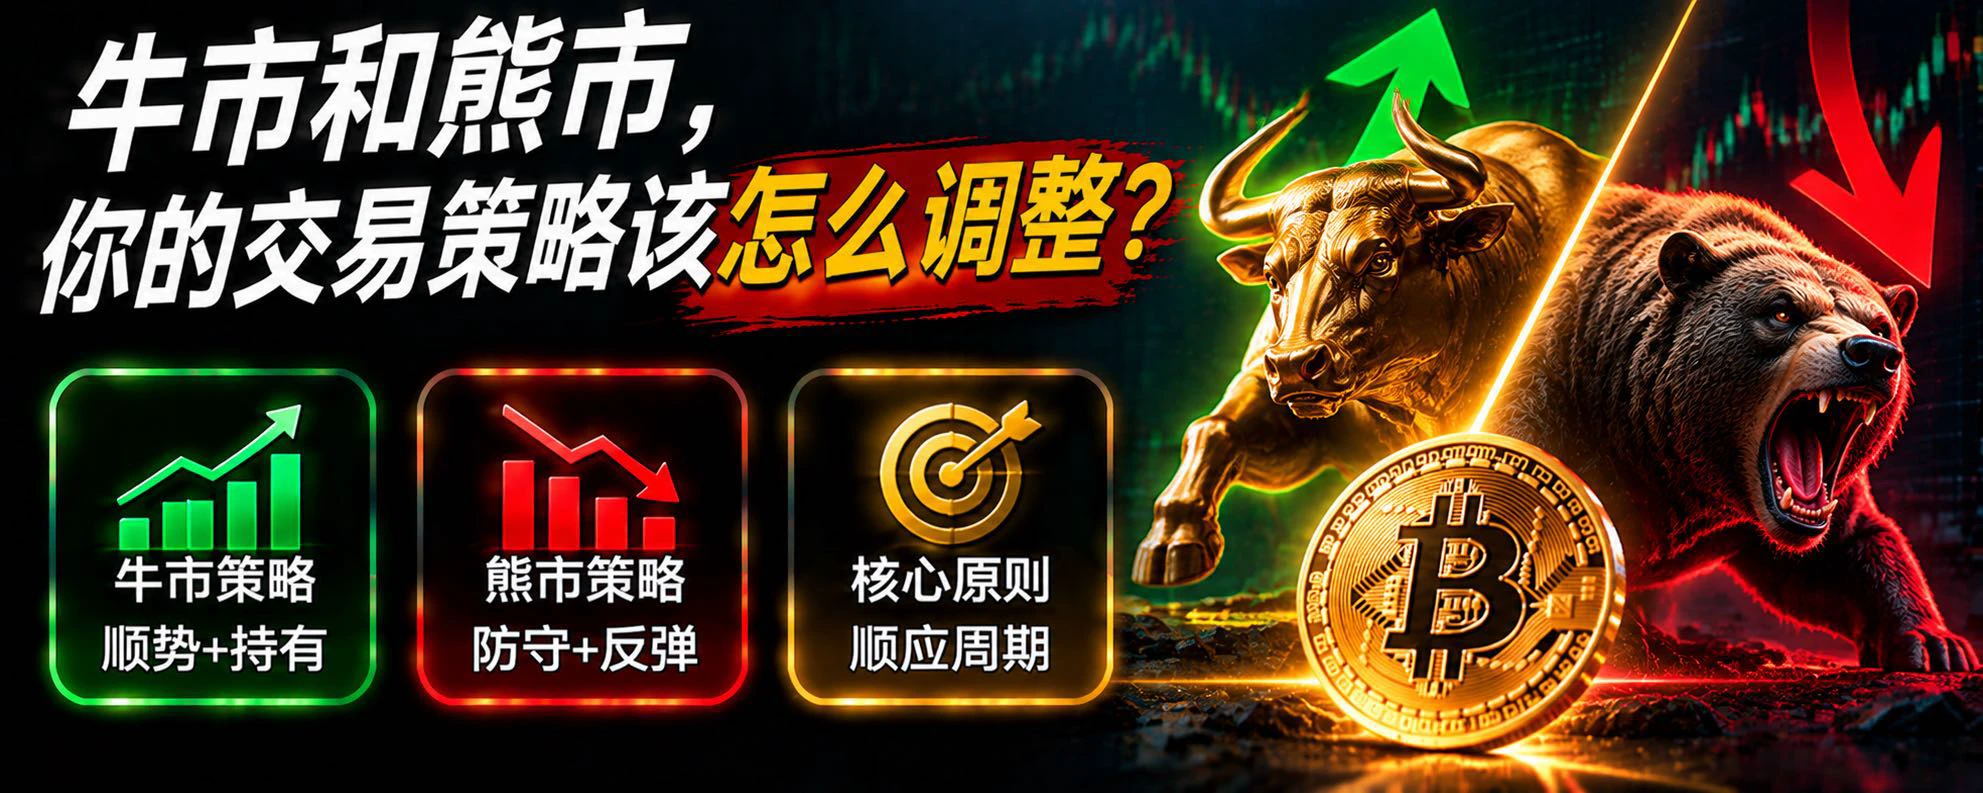
In the cryptocurrency market, many traders know some technical analysis methods, yet continue to lose money repeatedly in choppy markets. The reason may not be that their technical skills are lacking, but that they have failed to identify the current market regime.

The biggest difference between trending and choppy markets lies in how prices move.

First, in choppy markets, prices usually fluctuate repeatedly within a certain range, with resistance above and support below. If you follow a trend-trading approach, going long when you see prices rise and going short when you see them fall, you c
post-image
Does bearish divergence in BTC mean a decline is imminent?

In BTC technical analysis, bearish divergence is often seen as an early warning that an uptrend may be weakening. But many traders rush to short as soon as they spot bearish divergence, only for the price to keep rising instead of falling and ultimately move against them.

So, how should you interpret bearish divergence?

First, understand the basic principle behind bearish divergence. When the BTC price keeps making new highs, but the highs on indicators such as RSI or MACD gradually decline, bearish divergence may be forming. This s
post-image
BTC-0.67%
Ancestor worship is really a way for the living to put themselves at ease
post-image
Thanks @Turkcell
post-image
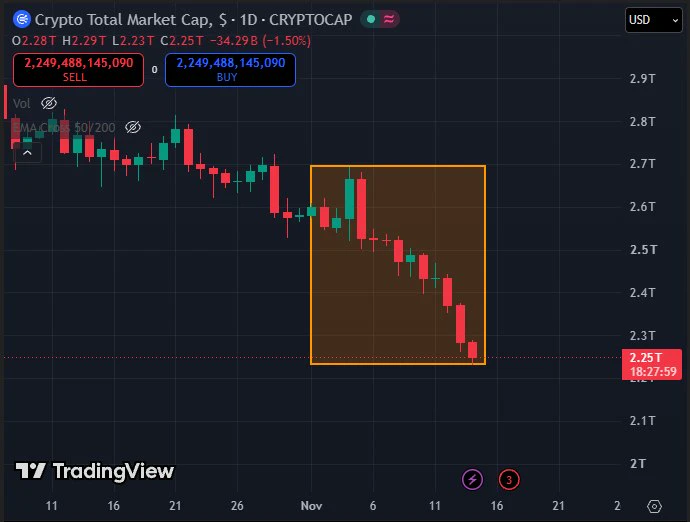
$330B gone from crypto in 2 weeks.
Fear is loud right now.
post-image
At the 850 level, $SNDK has to show its hand tonight. $SNDK contract looks bearish to me: down 6.1% in 24 hours, tumbling from 948 all the way to 850. Last night, 850 was tested three times; the low of 849.5 then recovered. It rebounded to 890.5 in the early hours, only to get pushed back down. Now at 865, it’s pressing near the lows again—the rebound hasn’t held, and the bears still have cards to play. There are just two scenarios: break below 850, with a take-profit target of 848.68; a break means a new low. Reclaim 890.5, and I’ll stop out and admit I was wrong—the bears can take a break
SNDK-0.18%
The rebound following this pullback has begun, and bullish sentiment has clearly recovered. In the short term, watch for opportunities to go long on several major and popular assets.
$BTC Perpetual futures long strategy: Consider entering in batches if the price pulls back to the 67,000–67,400 range. The first target is 67,800, the second is 68,300, and the third is 68,800. Exit strictly if the price falls below 66,400.
$ETH Perpetual futures long strategy: Set up long positions in the 1,890–1,910 range. Watch 1,925, 1,945, and 1,965 as take-profit levels, respectively. Place the stop-loss b
post-image
BTC-0.67%
ETH-1.26%
HYPE+0.24%
While scanning the news feed, I almost skipped this as just another data point
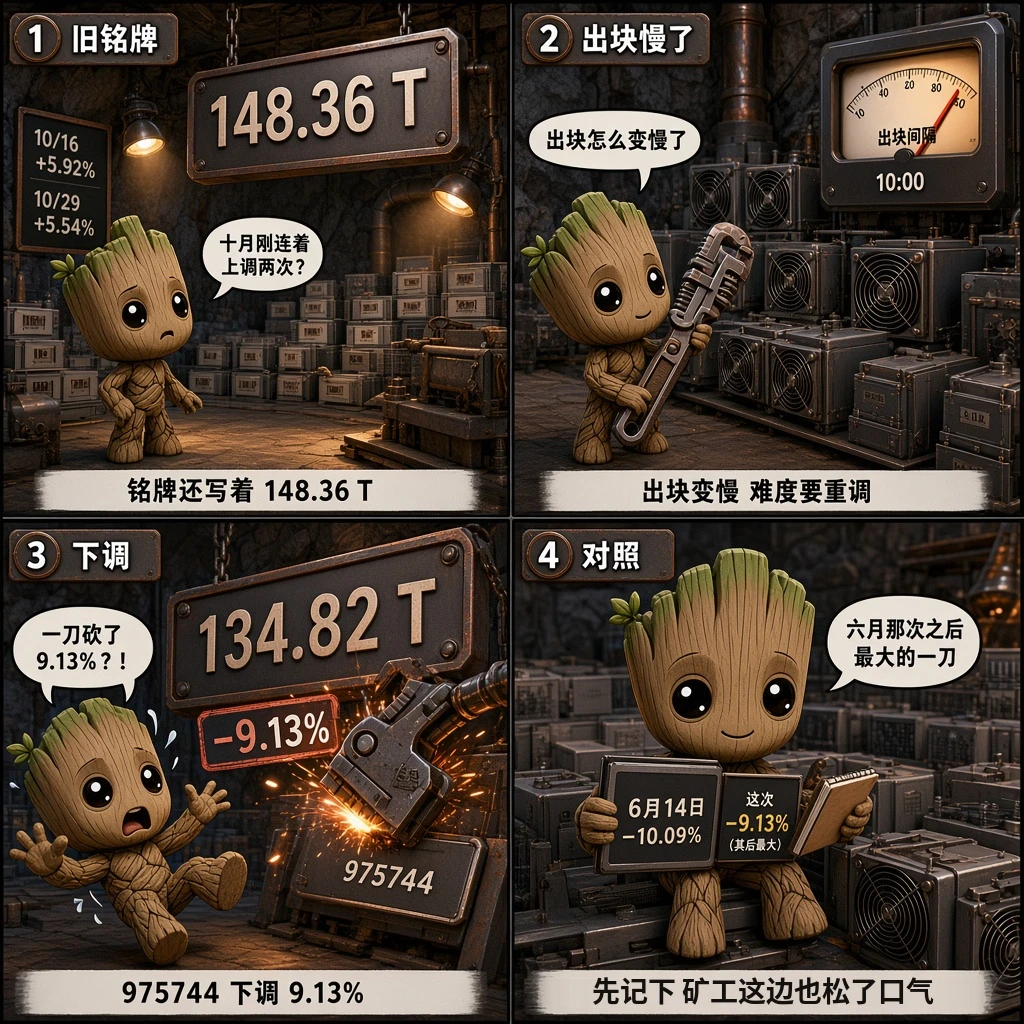
At block height 975744, mining difficulty dropped from 148.36 T to 134.82 T, a decrease of 9.13%
There was a 10.09% decrease on June 14; this is the largest since then, and it came right after two consecutive increases in October of 5.92% and 5.54%, respectively
When blocks slow down, difficulty automatically adjusts downward; no one makes the call—the rules run on their own
The price is still hovering around 67k, while miners have already eased off a notch; worth noting
post-image
$LN I don't care, I'm going for UTEXO. Anyway, I want to buy some LN because it's an RGB protocol asset. I want to buy even more PPRGB because it's the leading protocol asset, and people are scrambling for the limited supply! Haha!
post-image
LN-0.49%
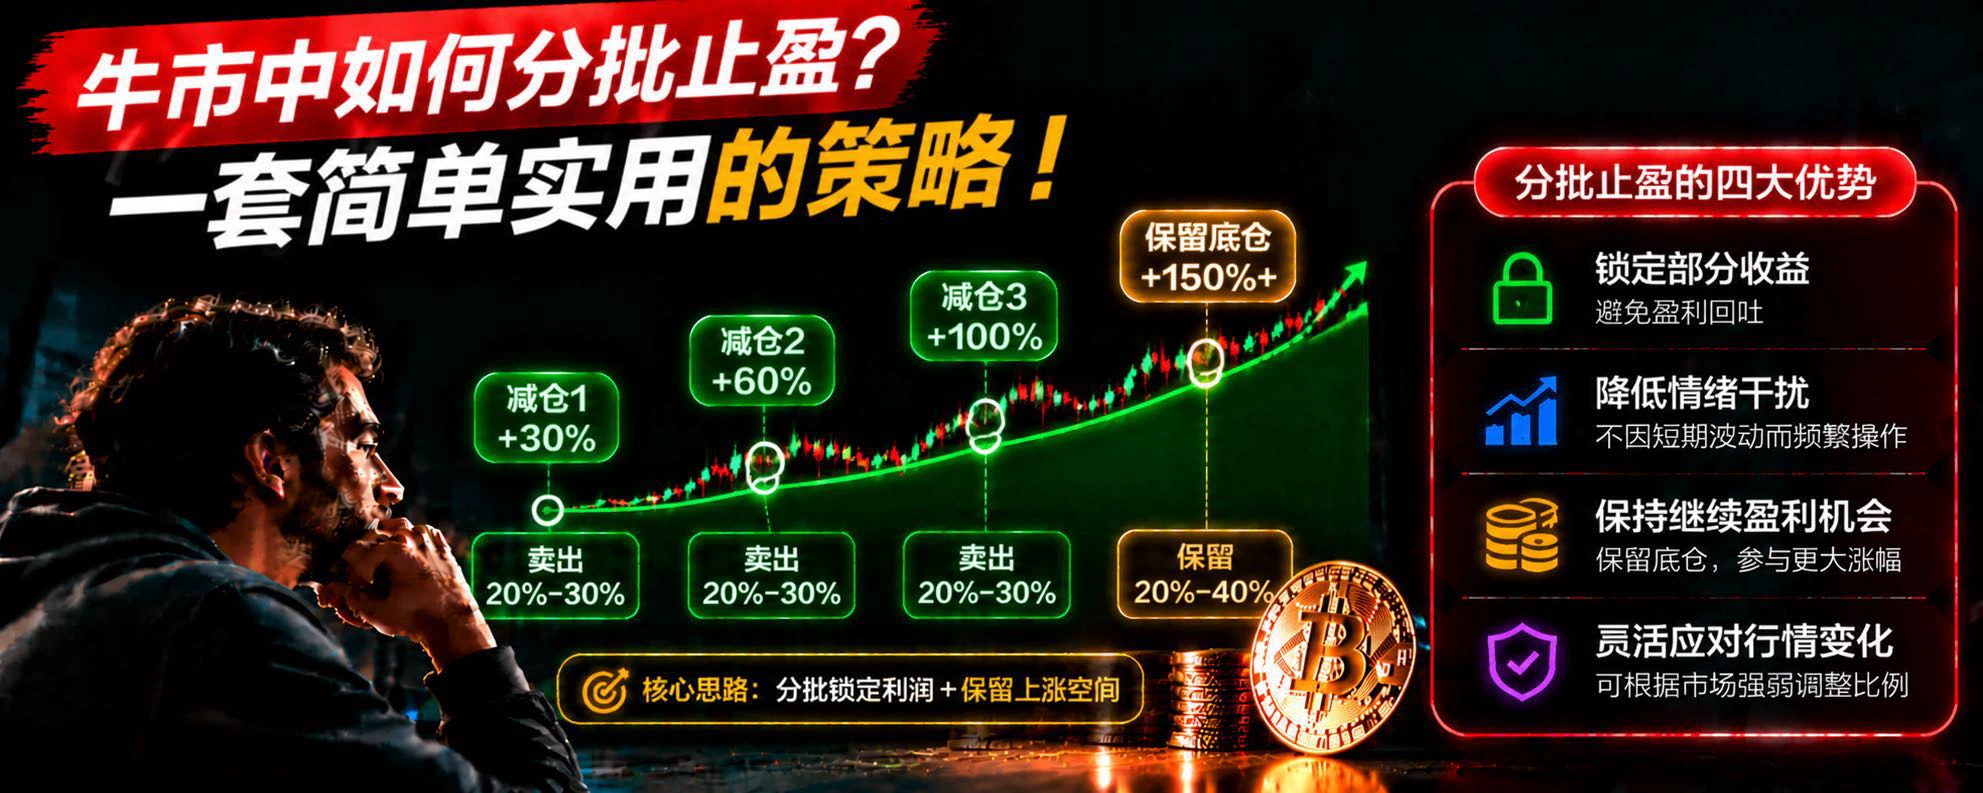
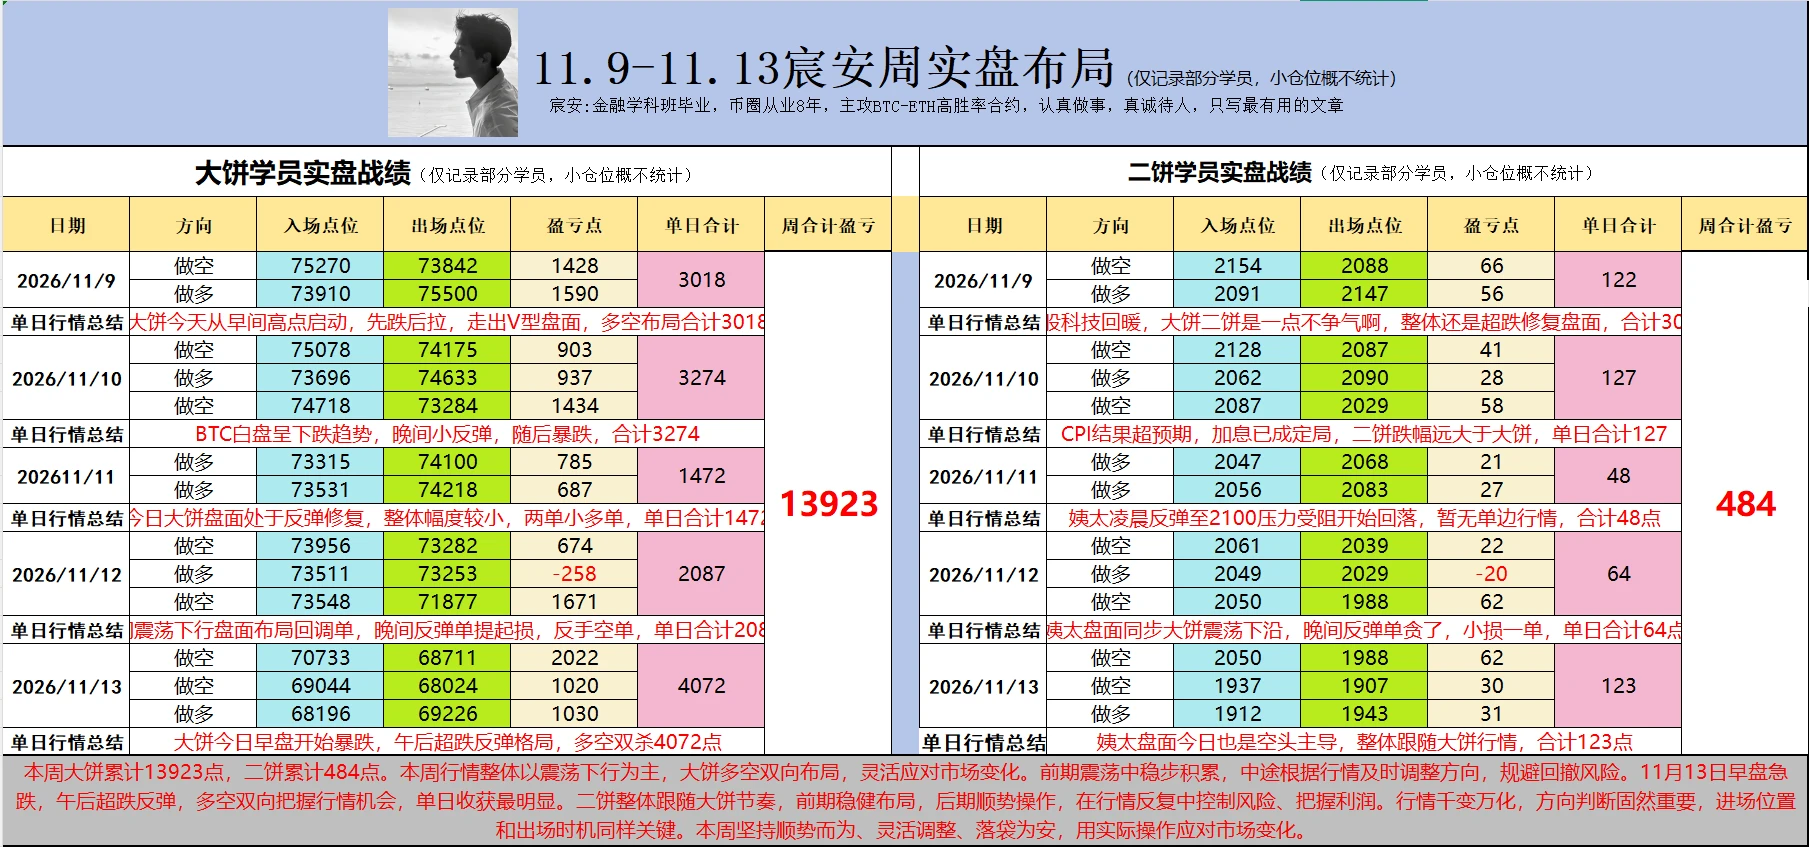
【This Week’s Trading Review】

11.9—11.13, this week’s five trading days have come to a close.

Overall, the market was mainly range-bound, with bullish and bearish momentum shifting quickly along the way. I adjusted my approach promptly to suit different market conditions, without blindly chasing rallies or fixating on a one-way view.

I recorded 24 entries and exits this week, with 22 producing positive results, for steady overall progress. Bitcoin gained a total of 13,923 points, and Ethereum gained 484 points.

Throughout the process, I stuck to one principle: adjust promptly when the direc
post-image
BTC-0.65%
ETH-1.23%
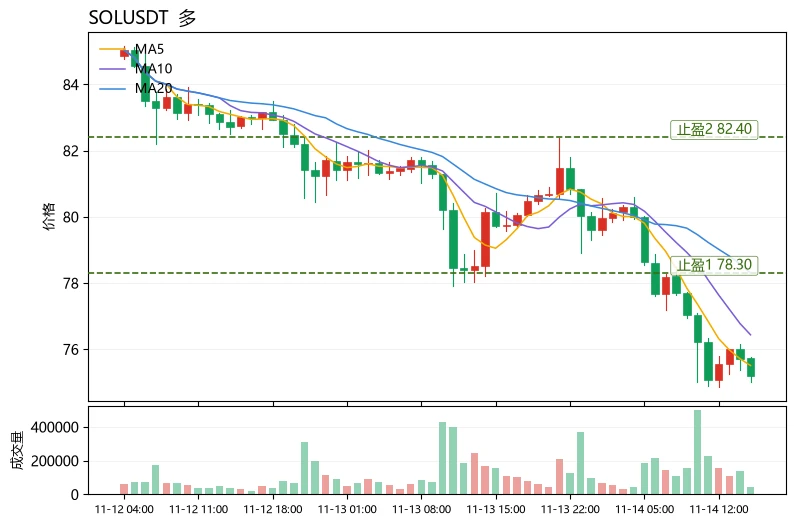
$SOL is currently trading at 75.94, down 4.19% over 24 hours (range: 74.85–82.38). The 1H RSI is weak at 27, and the 4H RSI is weak at 24. Direction may become clearer if price holds above the 82.38 resistance or breaks below the 74.85 support. In the next review, watch whether resistance holds and whether price can recover after losing support. Volume is only 0.45x, so a single break of either level needs confirmation of participation. Markets are volatile; for observation only.
post-image
SOL-0.77%
$SOL Current price: 75.16, down 6.82% in 24h, with a trading volume of 274.1M USDT. The moving averages are in a bearish alignment: MA5=75.508 is below MA20=78.305, RSI=28.2 has entered oversold territory, the MACD histogram at -0.275 remains bearish, and the price is near the lower Bollinger Band at 74.14. The funding rate is -0.0083%, and the Fear & Greed Index is 13 (Extreme Fear). The data is clear: the trend structure has not yet recovered, but the short-term combination of oversold conditions and negative funding has opened a rebound window. The directional bias is bullish, but this is
post-image
SOL-0.77%
BARD-1.24%
GM Legends
New day, new chance to get closer to the life you want.
post-image
[ NEW STREAMER ] MARKET UPDATE
live-cover
LIVE1,880
-500U to 50000U Challenge Series-
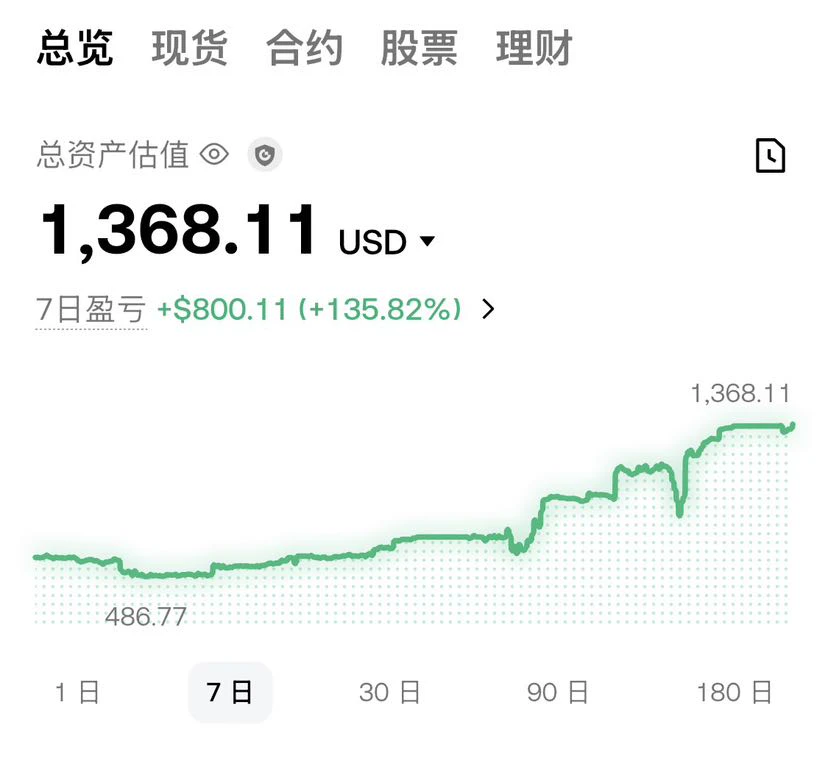
Total assets continue to grow exponentially🧬. Honestly, the recent market has been really tough, but whether trading short- or long-term, always follow the trend. I caught a great 350% rally in a meme coin$AKE 📈, with a short-term target of 0.018. Congrats in advance to everyone who comes across this!
Stay humble and composed, stay true to yourself, keep your own pace, maintain a strong mindset, and keep building positions and working hard. Welcome to follow along🌟
post-image
AKE+6.39%
$H This drop from 0.026 to 0.0206, down 15.46% in 24 hours—I just lost 2,300U on a similar setup last month, and that lesson hurt. But today, instead of ranting, I'll break it down with data—and this level is actually starting to look interesting.
First, volume: 24-hour trading volume is 19.5M. The low of 0.0198 wicked back up right around the 0.020 round-number level, suggesting panic sellers were absorbed in the 0.0198–0.0200 range. The price is down 15%, but volume didn't explode, so this looks like a wick after a slow decline on shrinking volume—not a high-volume collapse like a project te
  • 3
  • 3
Load More

Join 40 M users in our growing community

⚡️ Join 40 M users in the crypto craze discussion

💬 Engage with your favorite top creators

👍 See what interests you

Trending Topics

GateIPOAccessAnthropic

305.3K Views2.8K Discussing

Gate IPO Access Phase 3 features Anthropic (ANT), with USDT subscription interest starting from 100 USDT. Successful allocations will be delivered as real shares to Gate Stock Accounts. Indicative price: $70–$78/share Subscription: Nov 12–17 (UTC+8) Allocation is not guaranteed. Please manage risk accordingly.

Dr.HanOxfordUnionSpeech

147.2K Views586 Discussing

USOctoberPPIBelowExpectations

461.1K Views1.4K Discussing

View More