Square
Following
Hot
News
Notifications
Profile
Share your thoughts
placeholder
Article
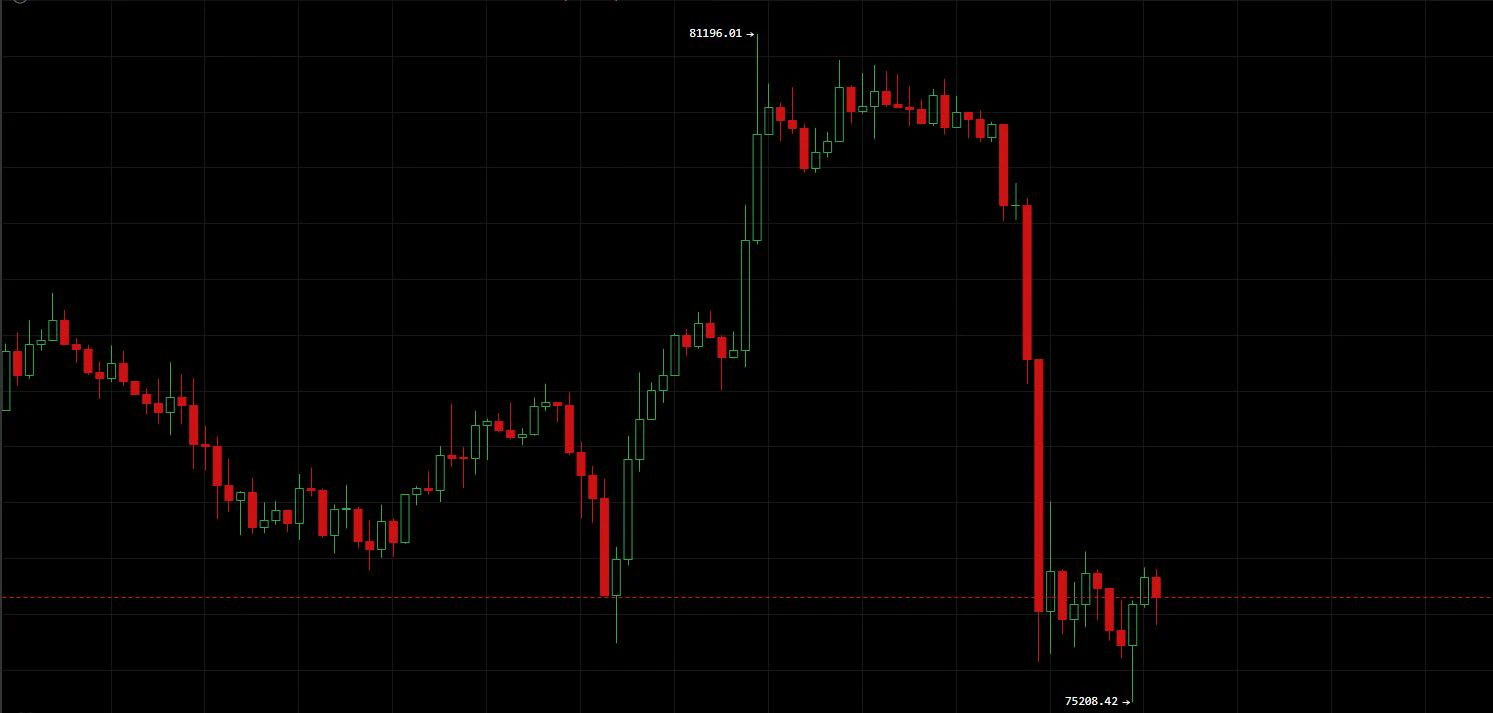
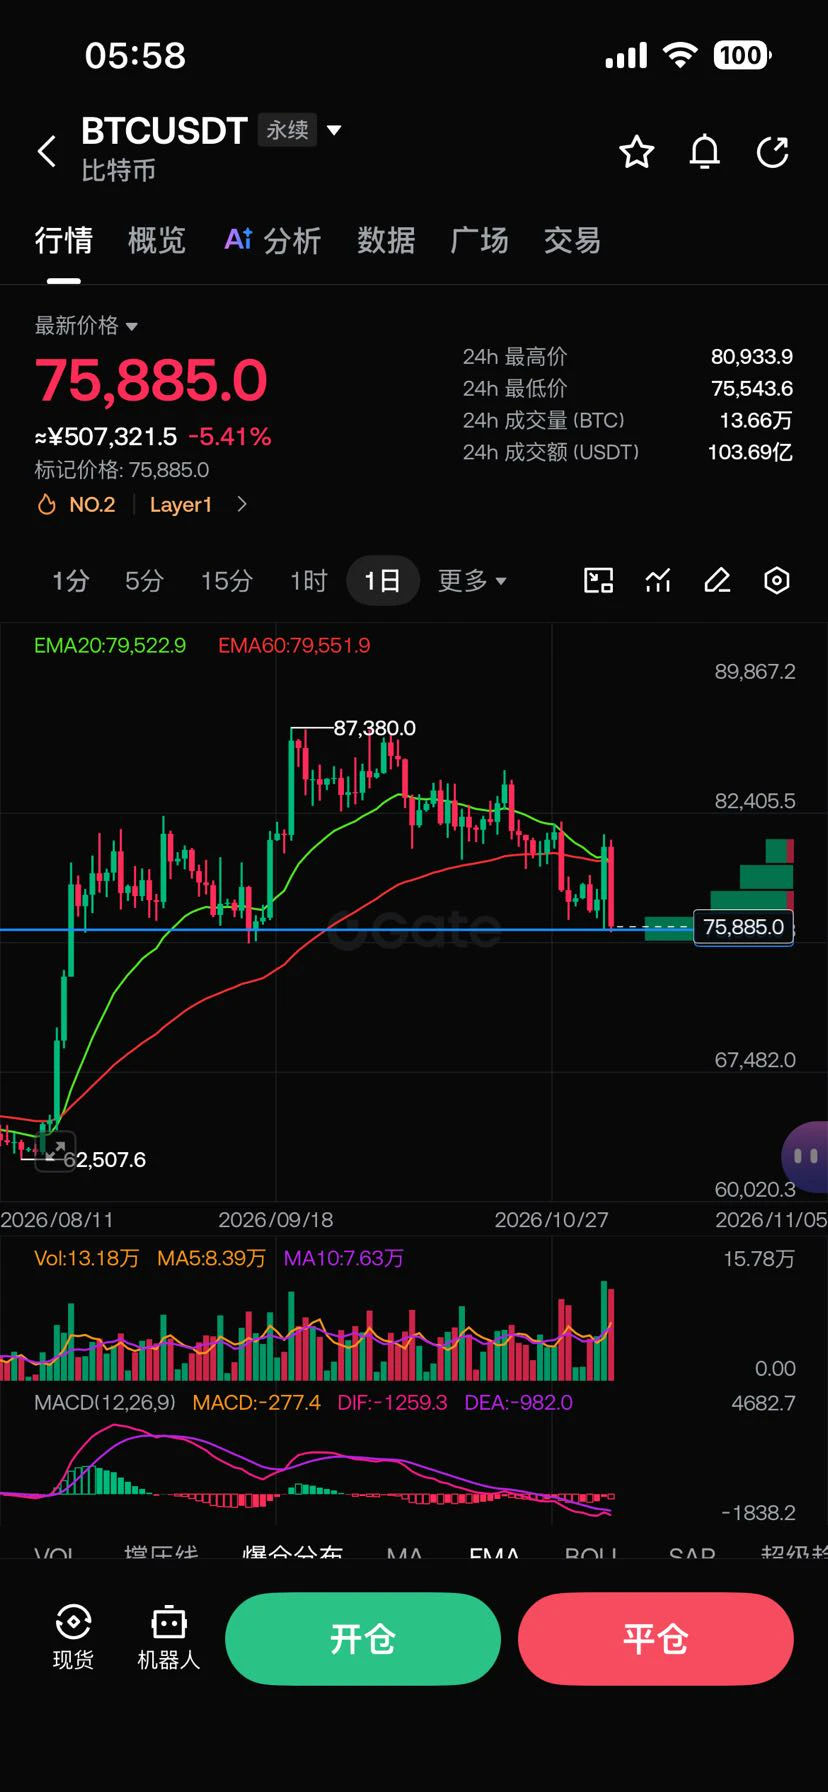
November 6 $BTC The U.S. election outcome triggered a “buy the rumor, sell the fact” move, as concentrated profit-taking from the earlier rebound sparked a futures liquidation cascade.
【Today's Strategy】
Short entry range: Position on a rebound to 76800-77300
Long entry range: Position after a stable retest of 75500-75700
Stop-loss settings: Short stop-loss above 77600; long stop-loss below 75100
Take-profit settings:
Short targets: 76200-75800
Long targets: 76800-77000
【Core Logic】
The hourly chart saw a sharp, one-way drop on heavy volume, with bears dominating the short-term market. 76800-
post-image
BTC-0.65%
#10月非农数据聚焦 #WCTCS9 The market has already priced in a December rate hike as highly likely, so weaker-than-expected data could also be interpreted as a sign of a weakening economy. For now, reduce leverage and trim positions, then wait for the data before deciding on direction.

Trading strategy
Positions: Lower leverage and keep sufficient margin to avoid holding large positions around the data release.
Orders: When placing orders on both sides, guard against slippage; execution prices may differ from quoted prices.
Stop-loss: Set stops wider to avoid sharp volatility in the first few minutes
post-image
BTC-0.67%
  • 3
Trenches
ZIG
Z
bade
b
ZIG
0x8c...1145
Market Cap
$.
Change
.
24h Vol
$.
Holders
.
BTC
B
bade
b
BTC
C5xp...pump
Market Cap
$.
Change
.
24h Vol
$.
Holders
.
CORLA
C
bade
b
CORLA
0xba...7777
Market Cap
$.
Change
.
24h Vol
$.
Holders
.
STONK
S
bade
b
STONK
6GmA...UNgx
Market Cap
$.
Change
.
24h Vol
$.
Holders
.
DESSA
D
bade
b
DESSA
npz2...pump
Market Cap
$.
Change
.
24h Vol
$.
Holders
.
XRP market update
live-cover
LIVE2,038
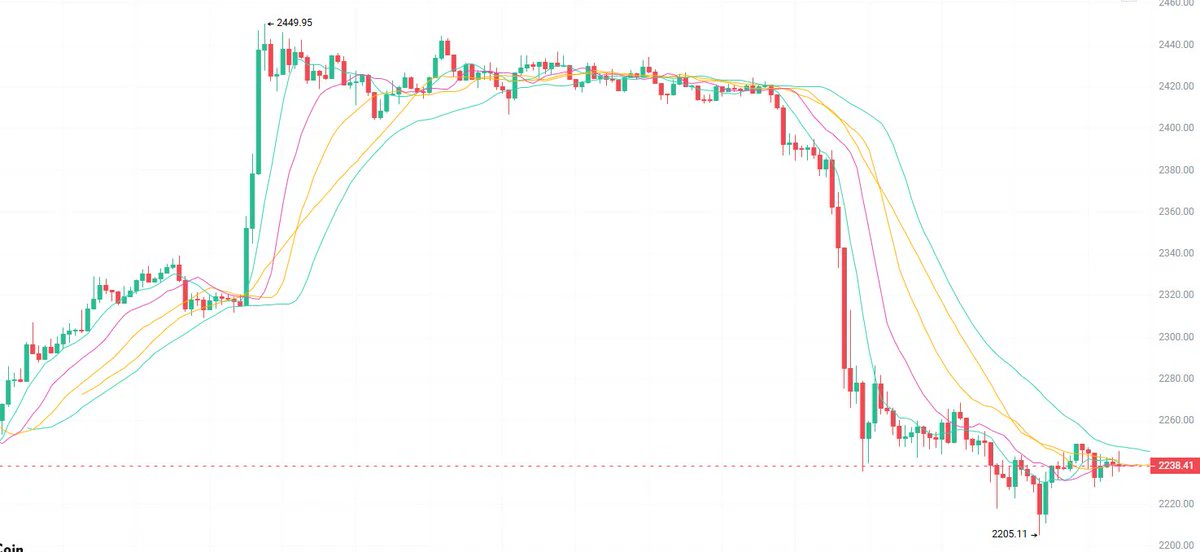
On 11/6, ETH faces resistance on a rebound near 2250; look to short, with targets at 2210/2200.
For those looking to go long, wait for price to stabilize near 2205 before entering. Stop at 2180, with targets at 2240/2260.
On the 1-hour chart, price plunged from the 2449 high, wicking down to a low of 2205 before consolidating at the lows. The moving averages are fully fanned out bearishly, limiting the short-term rebound. Resistance is at 2250/2270, and bears currently have the upper hand. $ETH #ETH
post-image
ETH-1.26%
The growth of an ecosystem requires not only continuous technological development, but also the exchange, collision, and integration of different perspectives.
In the digital world, good ideas may come from a developer’s technical exploration, a user’s feedback, or even differing opinions among community members about an issue. What truly matters is not that everyone shares the same views, but that these views are listened to carefully and that constructive discussions help identify areas for improvement.
For ONEA, the value of community communication should go beyond simply sharing informatio
post-image
  • 1
95.3% of liquidations were longs! The traders who chased longs above $60 on $SOXL are trapped—your principal is being “slowly tortured” by Wall Street!

Don’t use your hard-earned money to pay for a 3x-leveraged plunge. What you think is holding on is actually handing your head to the big players!

Market-wide liquidations totaled $21.94 million in 24 hours, with long liquidations reaching 95.3%! If you chased SOXL longs above $60, it’s now at $46.5, leaving you down over 22%. This isn’t a pullback; it’s a targeted slaughter by 3x leverage.

Why such a brutal drop? Three major risks hit at on
SOXL-1.16%
  • 8
  • 2
Added a bit at the open today. Lately I’ve been buying dips while making T trades. Yesterday morning I trimmed tech and bought ICBC on the dip as a hedge, so I’ve got plenty of room in my positions today. A-shares have already taken a huge plunge, after all, so I’m a bit bolder. I’m mainly focused on the index, with small positions in individual stocks; my A-share account is still steady. My long Q got stuck at 667 last night. For the past three months, my play-money account has just been cycling between getting stuck and breaking even, going nowhere. What a mess.
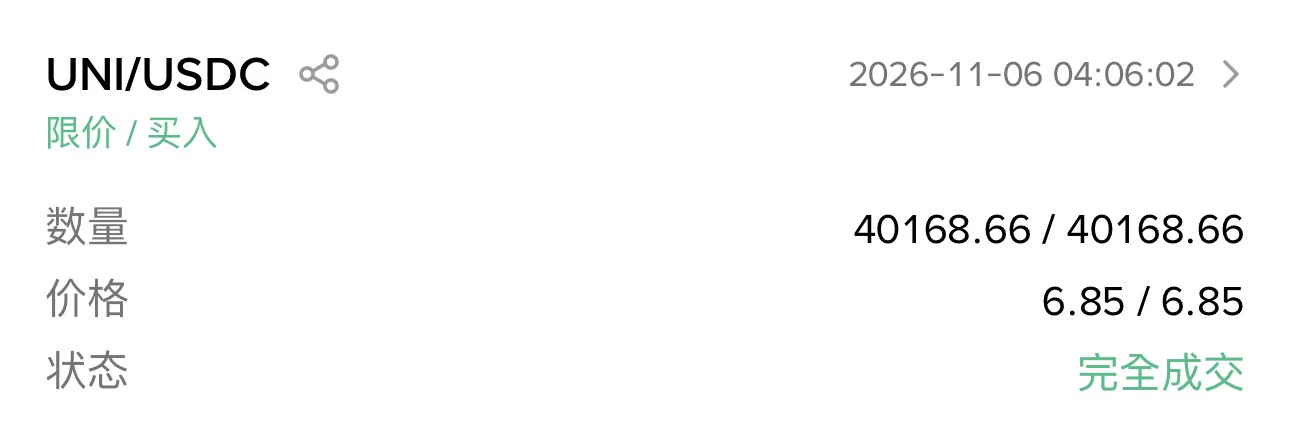
Since I started trading crypto, my sleep quality has gotten worse year after year. I woke up in the middle of the night and couldn't resist checking the market, then couldn't resist adding 40k UNI at 6.85U. The bubble in U.S. storage and AI stocks is deflating—what does that have to do with crypto? The crypto bubble was already mostly squeezed out. Bitcoin's fundamentals haven't changed at all; I still see range-bound trading between $75k and $85k. $UNI
post-image
UNI+3.05%
  • 6
  • 2
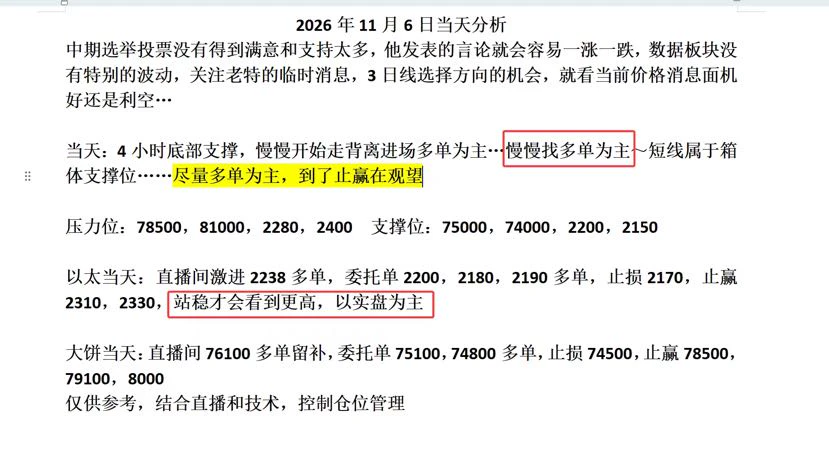
Analysis for November 6, 2026
Midterm election voting did not yield satisfactory results or much support, so his remarks could easily cause prices to rise and fall. The data sector showed no particular volatility. Watch for Trump’s latest statements; there may be an opportunity for the 3-day line to pick a direction. It depends on whether current price action and news are bullish or bearish…

For the day: 4-hour support at the bottom, with divergence gradually emerging; focus mainly on entering long positions… gradually look for longs~ Short-term, this is a range-bound support level… Favor lon
post-image
ETH-1.26%
BTC-0.67%
#ETHDrops5.5% Ethereum just gave back a week of gains in a single session, and the damage is concentrated in one place. From the $2,424.82 close on 4 November to the $2,238 close on 5 November, ETH shed roughly 7.7%, and the intraday low of $2,206 tested a level that had held through most of October. At around $2,242 this morning, the question is no longer whether ETH is weak, but whether the $2,200 zone can hold on a closing basis.

The move in numbers
The 4 November candle opened at $2,274.75, rallied to $2,450, and closed at $2,424.82. The 5 November session opened at $2,424.82, touched $2,
ETH-1.26%
BTC-0.67%
  • 6
  • 2
What Do Historical Data Tell Us About BTC Price Trends After Halvings?

In the Bitcoin market, halvings have always been an important event for investors. With each halving, miners receive fewer block rewards, and the rate at which new BTC enters the market declines accordingly. Historically, BTC has experienced significant bull runs after several halvings, so many investors view halvings as an important basis for a long-term bullish outlook.

But can historical patterns really be repeated?

First, halvings change the rate of new supply. BTC halvings reduce the rate of new coin issuance, but d
post-image
BTC-0.67%
$AVAX A long opportunity has emerged in the 8.240–8.271 range on the 4-hour chart. I’m watching to see whether buyers enter here. As long as the price holds above 8.24, the long thesis remains valid. Key levels: • On the 4-hour chart, the price has stabilized near 8.26 but remains below the EMA50 at 8.63• Stop-loss risk is 2.3%, while the TP3 target offers 3.6% upside, making for a decent risk-reward ratio• The 1-hour RSI is at 38 and has retraced sufficiently, potentially paving the way for a rebound🟢 Long entry: 8.240–8.271Take profit: 8.367 / 8.441 / 8.552Stop loss: 8.069Will buyers defen
post-image
AVAX-0.10%
Take a small long position, add to it at 75100, set a stop-loss at 74500, and hold until it rises above 78000. Once it moves up, remember to reduce your position at breakeven
post-image
AI Bubble Bursting? Nasdaq Falls More Than 5% in a Day

The U.S. stock market is best at making you feel like an investing genius one day, then making you question your life choices the next.
On Thursday, the Nasdaq fell more than 5%, and the Philadelphia Semiconductor Index dropped more than 12%, as AI and chip stocks faced a brutal sell-off. In the face of such a sharp correction, one question quickly became the market’s focus: Is the AI bubble about to burst?
Don’t rush to conclusions.
The AI industry has not stopped developing just because stocks have fallen, and companies’ demand for comp
MU-17.23%
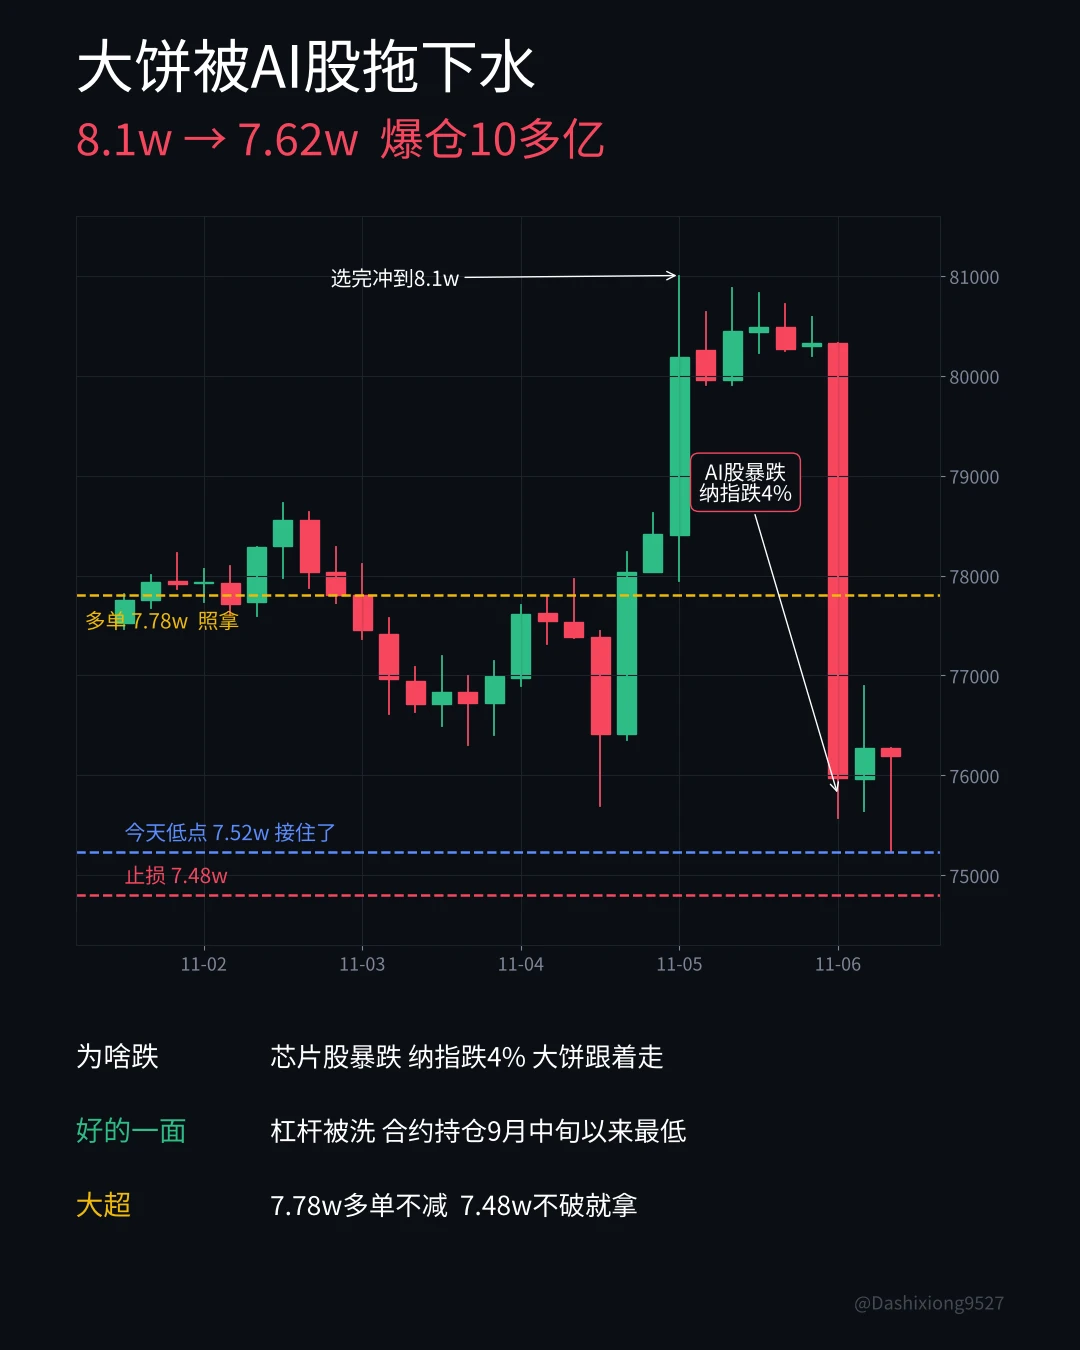
Bitcoin fell 6% in a day, getting slammed from 81,000 back to 76,000, with over 1 billion liquidated.

Da Chao will break it down for everyone: several things hit the market at once this time.

First, AI stocks crashed. Qualcomm’s earnings missed expectations, chip stocks were all in the red, and the Nasdaq fell 4%. Bitcoin is now moving almost in lockstep with the Nasdaq: when AI stocks fall, it falls with them.

Next, Bitcoin surged to 81,000 on election day—that was the initial reaction. Once the details of the results came out, with Democrats winning both chambers and Texas’s new governor
post-image
BTC-0.67%
Tonight, with the nonfarm payrolls report, my BTC target is 6,000 points. Do you think I can pull it off?
Looking at the hourly chart, since a door has already been drawn, the odds of a one-way move aren’t very high. Last night’s long position was entered below 760000 below; it can ride out tonight’s nonfarm payrolls report. Those who haven’t entered can go long anywhere below 75800, or enter at 74700 for a more conservative approach. Targets are 78800–79800, with an ultimate target of 81800. Plan accordingly based on your position size, and make sure to set strict protections.$BTC $ETH #Gate首
BTC-0.67%
ETH-1.26%
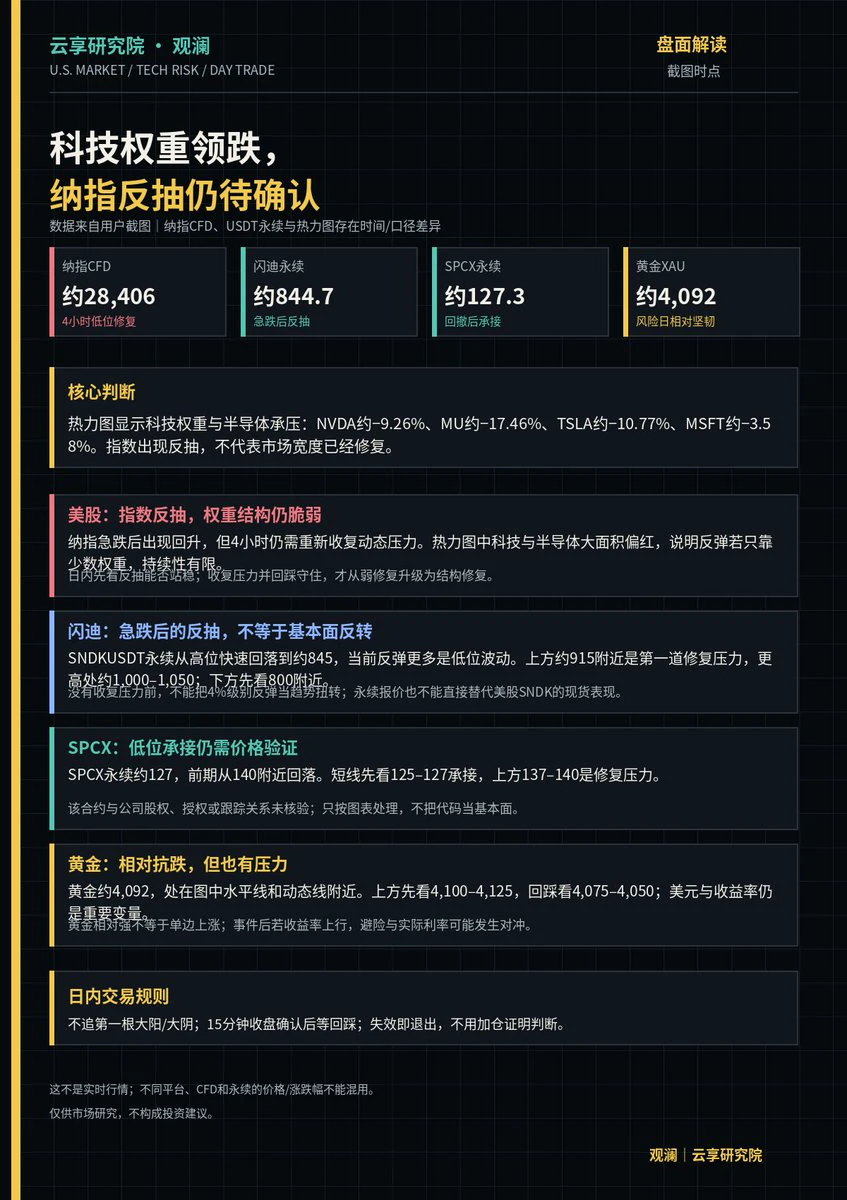
FeaturedThree trillion wiped out overnight—brutal. 【U.S. Market Snapshot | Tech-heavyweights lead declines; Nasdaq rebound still needs confirmation】
1. On the heatmap, NVDA is down about −9.26%, MU about −17.46%, and TSLA about −10.77%, with tech and semiconductors broadly weak. A rebound in the indexes does not mean market breadth has recovered.
2. Nasdaq CFD around 28406: First watch whether resistance can be reclaimed; don't chase the first green candle off the lows.
3. Sandisk perpetual around 845: Rebounding after a sharp drop, with around 915 as the first resistance to watch for a recovery and 8
post-image
NAS100-0.07%
NVDA-9.33%
MU-17.23%
TSLA-10.84%
SNDK-0.18%
11.6 SOL: Today’s Setup
$SOL
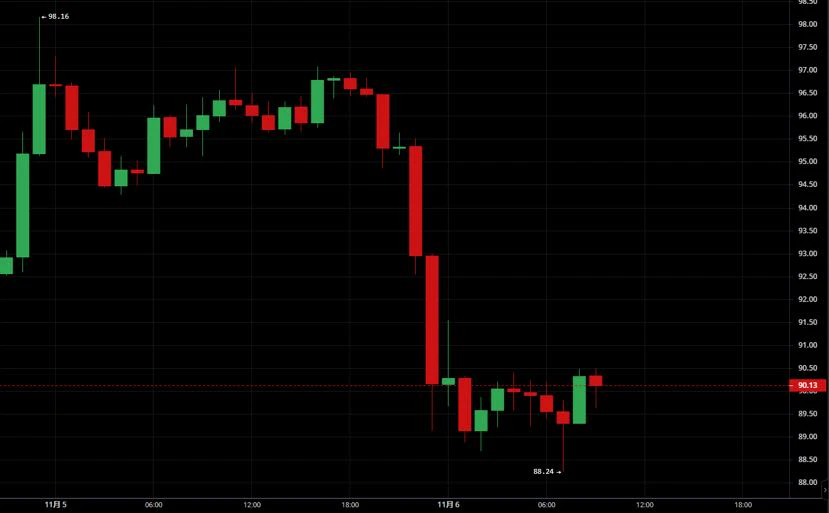
After a sharp overnight drop, SOL touched a low of 88.24 and entered a low-level range-bound recovery. The overall trend remains bearish, so the main strategy is to short rebounds. #美股史诗级抛售
Support: 88.2
Resistance: 91.0-91.5
Short: Enter on a rebound into the 91.0-91.5 range, stop-loss at 92.0, first target 90.0, second target 88.2
Short-term long: If the price stabilizes near 88.2 on a retest, consider a small position for a quick trade. First target 89.5, second target 91.0
post-image
SOL-0.77%
ESPORTS | Short 🔴 | Bearish | 15m 24h: -3.89% | Volume: 34.7M USDT. Short rationale: Price below EMA200; EMA20/50/200 bearish alignment; RSI14 at 42.8; MACD histogram negative; ADX14 at 12.8; volume at 0.84x the 20-candle average; trend pullback/continuation. Entry: 0.009759 Stop-loss: 0.0101915 Take-profit 1: 0.00921839 | Take-profit 2: 0.00889403 | Take-profit 3: 0.00846155 For reference only; do not chase the trade. The strategy is invalidated if the stop-loss level is hit. This is a technical analysis strategy only and does not constitute financial advice. $ESPORTS
post-image
ESPORTS-5.30%
Market update BTC
live-cover
LIVE2,011
Load More

Join 40 M users in our growing community

⚡️ Join 40 M users in the crypto craze discussion

💬 Engage with your favorite top creators

👍 See what interests you

Trending Topics

USStocksFaceHistoricSelloff

1 Views3.45k Discussing

U.S. stocks suffered a sharp selloff on Thursday, with the Nasdaq closing down more than 5% and the Philadelphia Semiconductor Index falling over 12%. AI and chip stocks including $NVDA and $AMD were hit especially hard. Markets are reassessing AI valuations, data-center spending and future returns. Is this just short-term deleveraging, or the start of a deeper correction in the AI trade? Which sectors are you watching next?

GateLaunchesPoSECProofOfSecurity

10.9k Views562 Discussing

USNonfarmPayrolls

8.57k Views3.97k Discussing

View More