Square
Following
Hot
News
Notifications
Profile
Share your thoughts
placeholder
Article
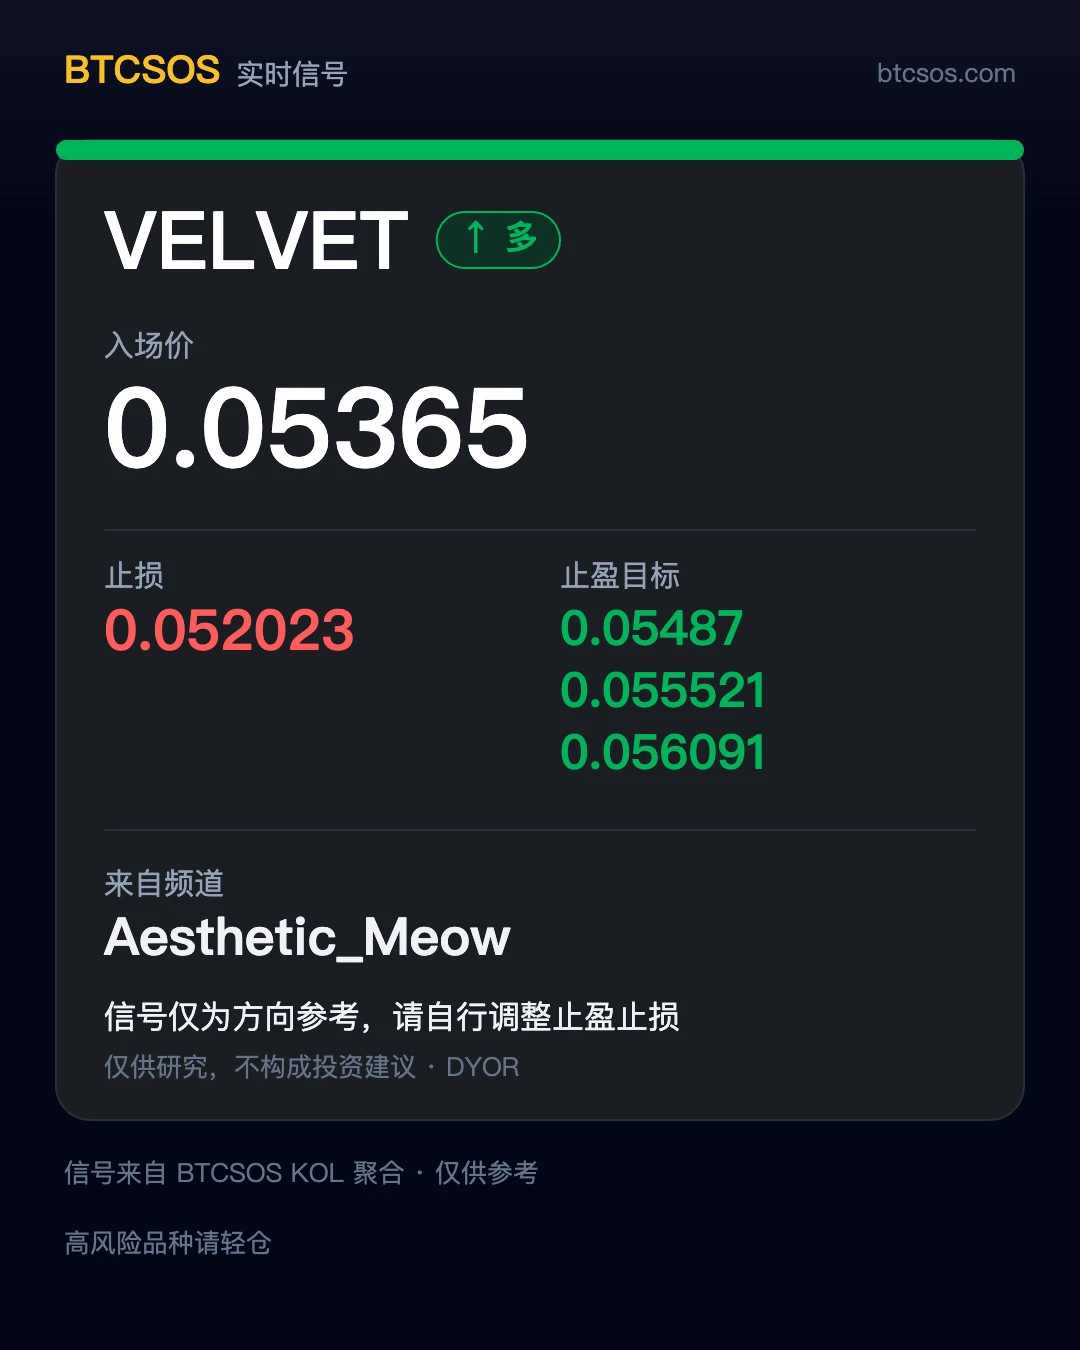
📡 Signal Card Repost | Aesthetic_Meow
$VELVET A long position just caught my eye. Sharing the 5 details as provided:
- Time: Not specified- Entry: 0.05365- Targets: 0.05487 / 0.055521 / 0.056091- Stop-loss: 0.052023
Come to think of it, I reposted this person's $PROM trade earlier today, and here they are again. They're posting pretty frequently 😂
I only repost the details as-is; I don't endorse them or predict the market. Whether to follow and how much to invest is up to you, folks. Check the stop-loss level carefully before acting. 😌
For personal record-keeping and sharing only; not inve
post-image
VELVET-3.58%
PROM+0.45%
CBRS+10.85%
What if $AKE 4/4 split says it all?

No edge. No conviction. Bearish on the weekly, bullish on the 1-hour.
Sitting out is a position too.
Trade or wait? 👇
$AKE ‌$AGT ‌
AKE+6.39%
AKE+6.07%
AGT-26.77%
Trenches
mihao
m
bade
b
mihao
4Cxj...pump
Market Cap
$.
Change
.
24h Vol
$.
Holders
.
Snoopy
S
bade
b
Snoopy
7mEh...47Cn
Market Cap
$.
Change
.
24h Vol
$.
Holders
.
NIO
N
bade
b
NIO
7SL2...pump
Market Cap
$.
Change
.
24h Vol
$.
Holders
.
IDOL
I
bade
b
IDOL
0x3b...ab07
Market Cap
$.
Change
.
24h Vol
$.
Holders
.
AGT
A
bade
b
AGT
0x5d...e274
Market Cap
$.
Change
.
24h Vol
$.
Holders
.
Figure had 28 participants using YLDS for marketplace settlement by its November 12 update.
The SEC-registered certificates had $504 million in circulation on September 30, up from $328 million at the end of 2025.
@Figure
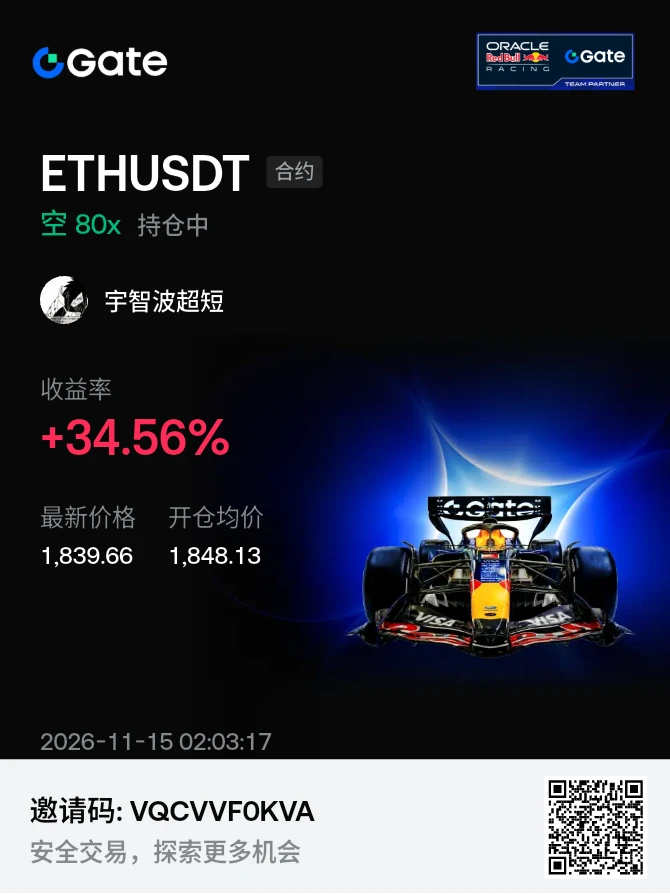
This is my adorable little dog. Hurry and go short now—don’t think you’ve caught the bottom; when it drops in a bit, you’ll shit yourself
post-image
  • 6
#USOctoberPPIBelowExpectations #USOctoberPPIBelowExpectations

The producer prices data for October puts forth a two sided picture that shows the monthly rise slowed yet the yearly pressure goes on, and this picture reshapes the market view on the path of rates.

By the data released on 13 November, producer prices show a monthly rise of 0.3 percent in October, the view stood at the level of 0.4 percent, the rise stood at the level of 1.4 percent in the prior month, and this slowdown shows that the monthly pressure lost speed.

On the yearly side, the picture gives a different signal, because
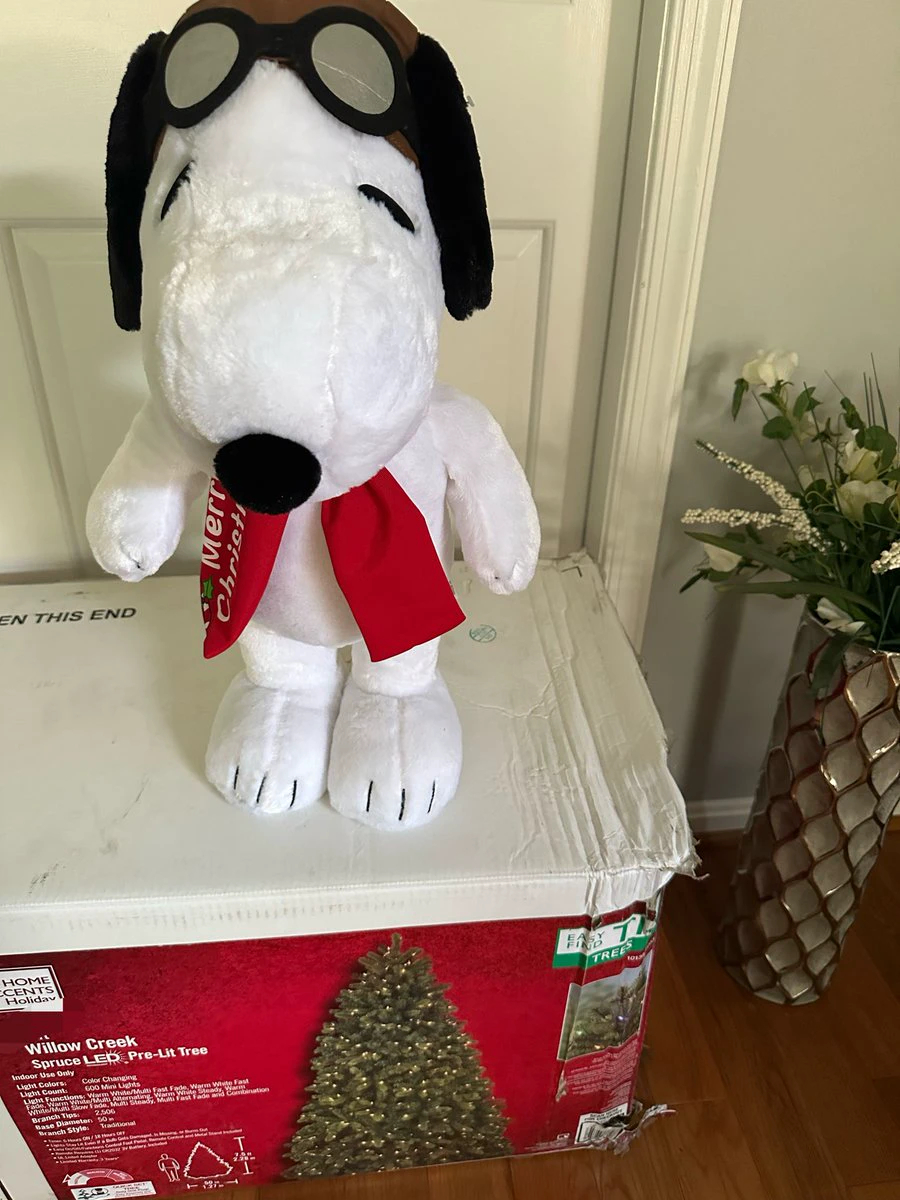
Is it too early for the tree
post-image
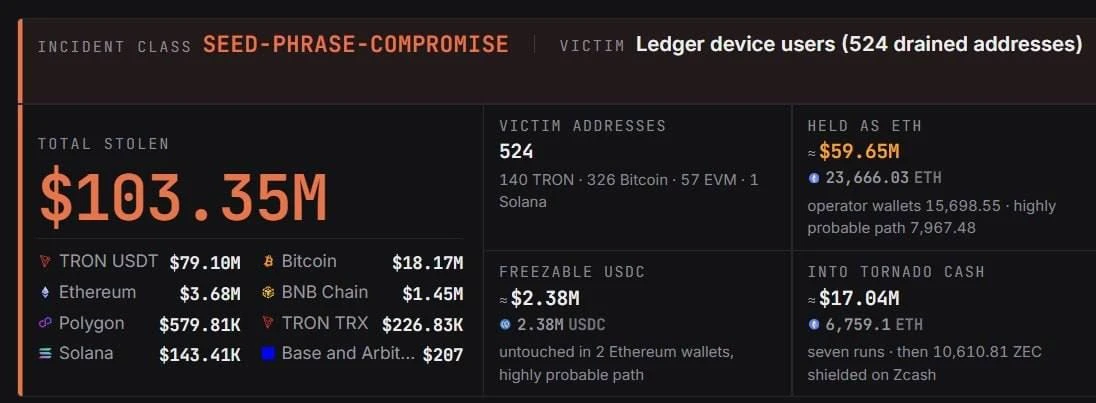
FAKE LEDGER WEBSITES ARE STEALING CRYPTO THROUGH GOOGLE SEARCH ADS.
post-image
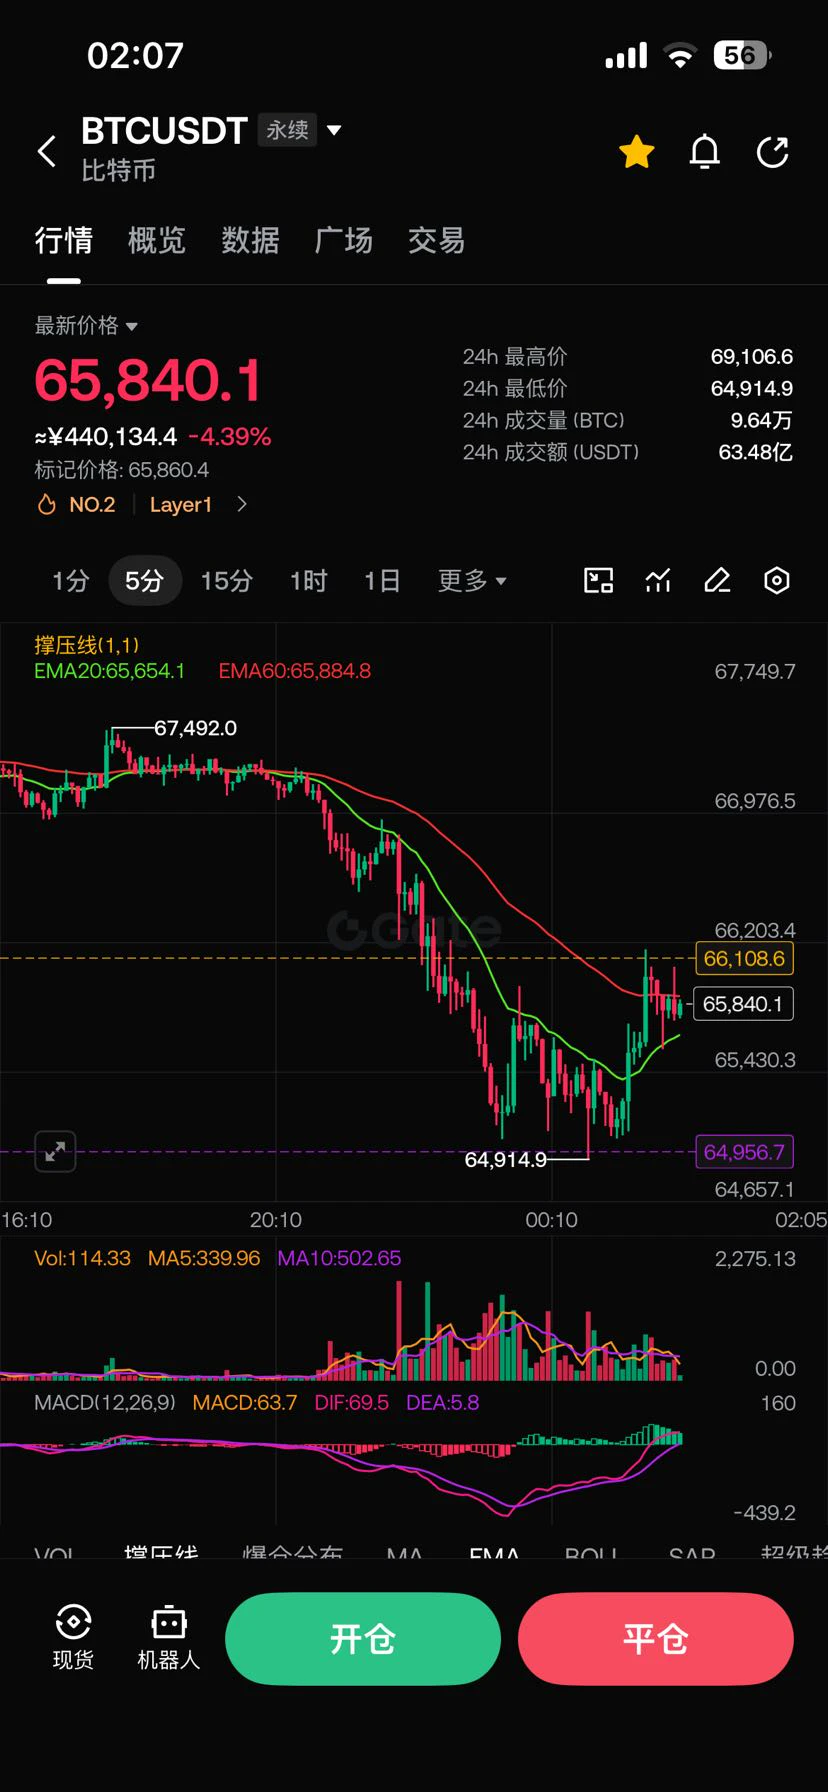
I missed the bottom, so I just think 65000 is a temporary bottom
post-image
This is the mega crash I was warning about for awhile.
Be prepared to weather the storm.
If you believe in the assets you hold, its ok to buy as they go lower as well!
GL. $BTC $QNT
BTC-0.67%
QNT+4.79%
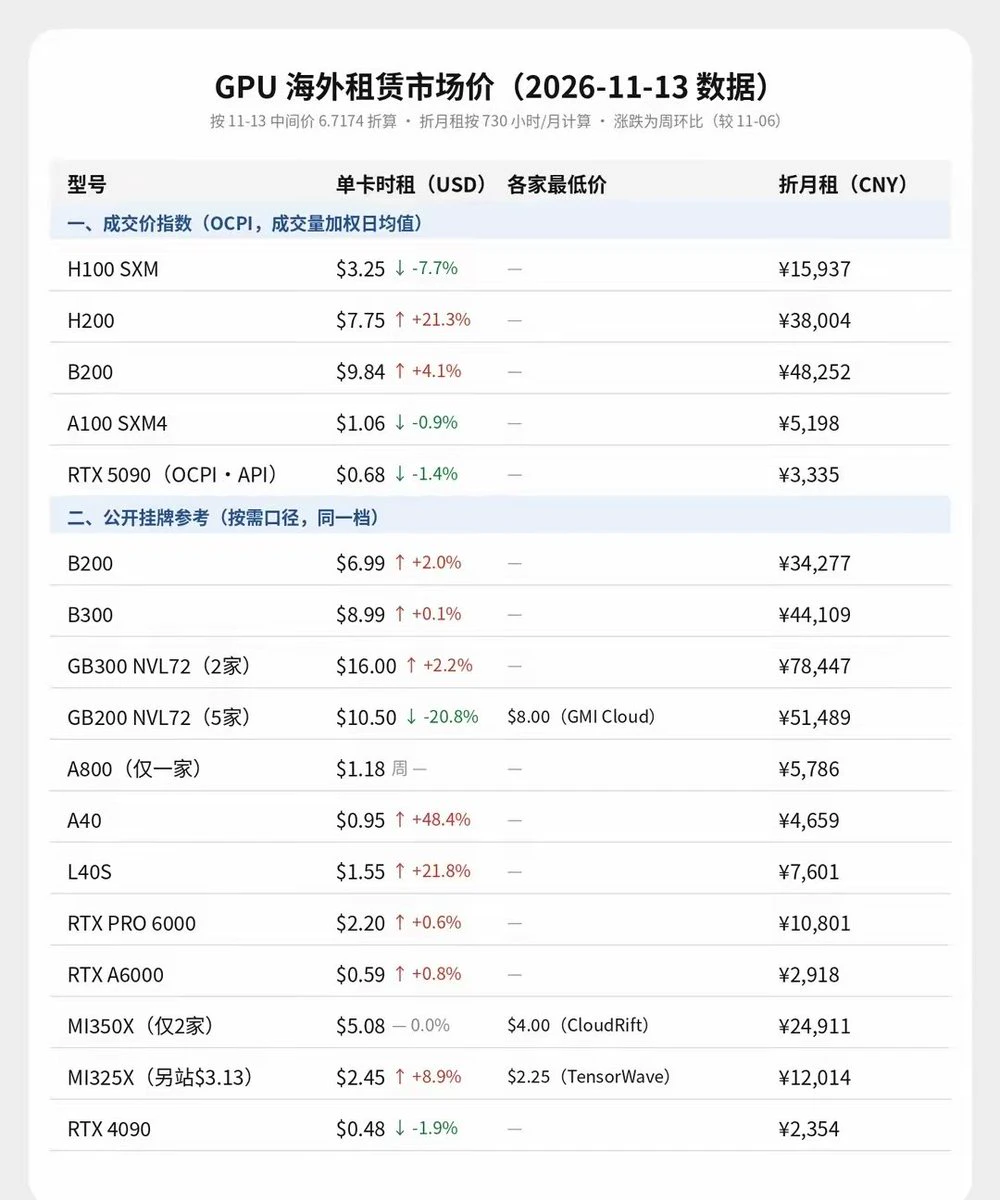
Based on NVIDIA’s reference figures of approximately 120 kW per rack for the GB200 NVL72 and up to 142 kW per rack for the GB300, the estimated annual listed lease value is about $55.2 billion (370.7 billion yuan) for GB200 and about $71.1 billion (477.4 billion yuan) for GB300. This is closer to the installed-capacity scale of a 1 GW AI computing center.
post-image
NVDA-1.92%
This is truly the smallest thing in the world.
post-image
#ETHBrieflyFallsBelow2000 📉 ETH briefly fell below $2,000—is it really time to find a new bottom?

BTC continued to weaken, and ETH also failed to hold $2,000, briefly dipping to around $1,983.

ETH has faced considerable pressure recently. 👀

💰 ETF outflows, institutional buying still needs to recover

📊 Inflationary pressures persist, and sentiment toward risk assets remains cautious

⚡ Leveraged liquidations intensify, further amplifying short-term volatility

Bulls and bears are divided again: some believe the area around $2,000 is worth watching, while others worry that funds have yet
ETH-1.26%
BTC-0.67%
11.14
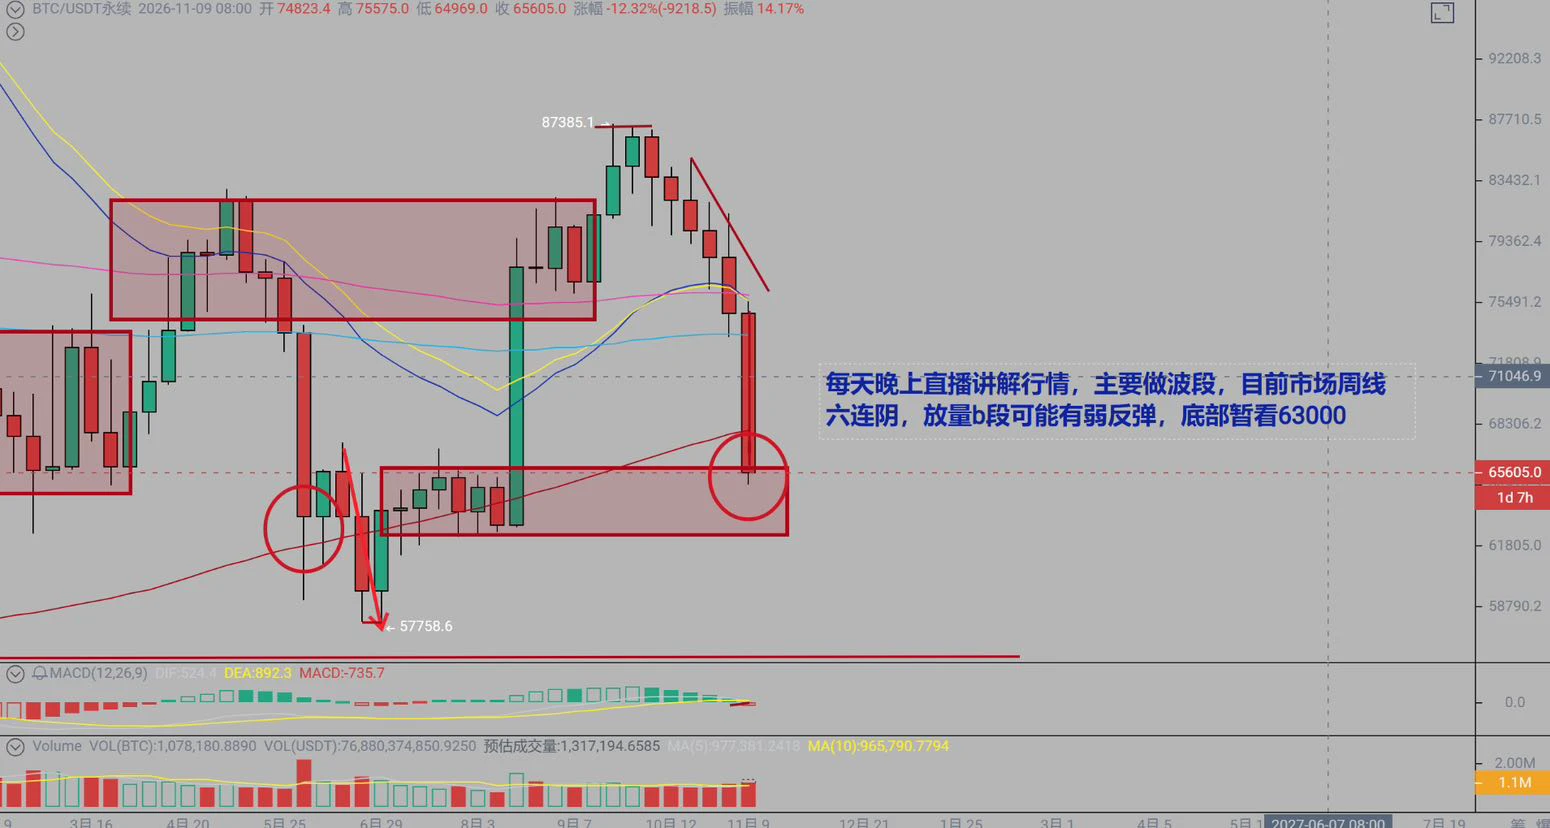
This is a weak rebound in a weekly-level B wave 🌊, very similar to the previous cycle. I just mentioned this during my livestream: this week's weekly trading volume is on par with the past few weeks, but the sell-off is steeper, indicating that bulls have less ability to absorb the selling. In plain terms, retail investors don't dare go long anymore, so an adjustment is needed.

The gradual sell-off here is very similar to the previous cycle's 5w7 pattern. After holding above 65000, the price may rebound to the 66000–68000 range, a 3,000-point fluctuation. If going long here, I’d recomm
post-image
FyPaymentMadeEasy
[Ended] Six consecutive weekly red candles; the market continues to seek a bottom.
11-14 14:34541 views
BTC-0.65%
ETH-1.23%
  • 22
PONS | Short 🔴 | Bearish | 15-minute 24-hour: -17.68% | Volume: 30.9M USDT. Short rationale: Price below EMA200; EMA20/50/200 bearishly aligned; RSI14 30.4; MACD histogram negative; ADX14 46.9; volume is 0.67x the 20-candle average; trend pullback/continuation. Entry price: 0.1175 Stop loss: 0.122715 Take profit 1: 0.110981 | Take profit 2: 0.10707 | Take profit 3: 0.101855. Entry price is for reference only; do not chase. The strategy is invalidated if the stop-loss level is hit. This is a technical analysis plan only and does not constitute investment advice. $PONS
post-image
PONS+4.32%
(New Streamer)World Cup Prediction
live-cover
LIVE379
The post from 6 hours ago had already perfectly predicted the bottom, the rebound, and even the point to open a short for you. If you couldn't keep up, that's your own problem,
post-image
  • 7
Crypto Weakness and Semiconductor Volatility Reshape Global Investor Strategies
live-cover
LIVE410
$AIO I took a real 7,800U loss on this move, holding from 0.041 all the way down to 0.033 before finally cutting my losses. That tuition hurt. Looking back at the data: down 17.93% in 24h, with a low of 0.0313 and only 3.7M in trading volume—liquidity was so thin that chasing the price higher was asking for trouble. Here’s the turning point: clear buy-side support appeared around 0.0313, and the current price of 0.0322 has moved off the bottom. Signs that the downside may be exhausted are clearer than yesterday. Trading plan: scale in between 0.0315 and 0.0320, keep the position below 20%, and
AIO-3.19%
  • 2
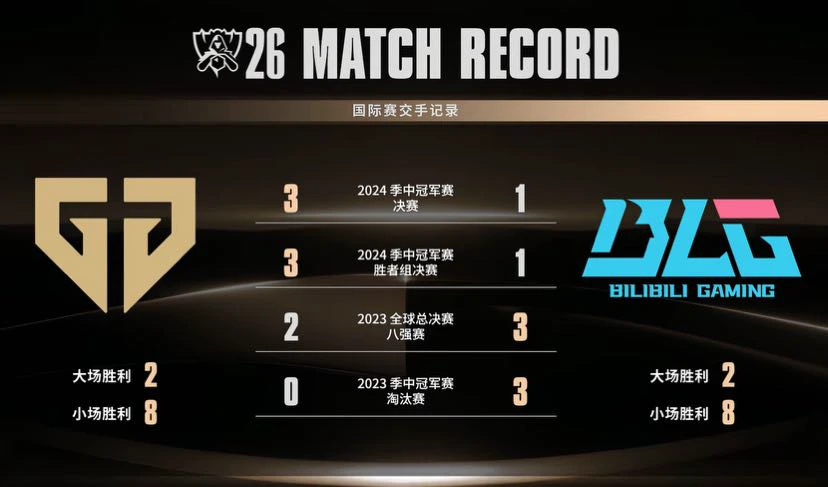
Here we go, here we go, guys—let’s do this, let’s do this… Go BLG…#黄仁勋辞职
post-image
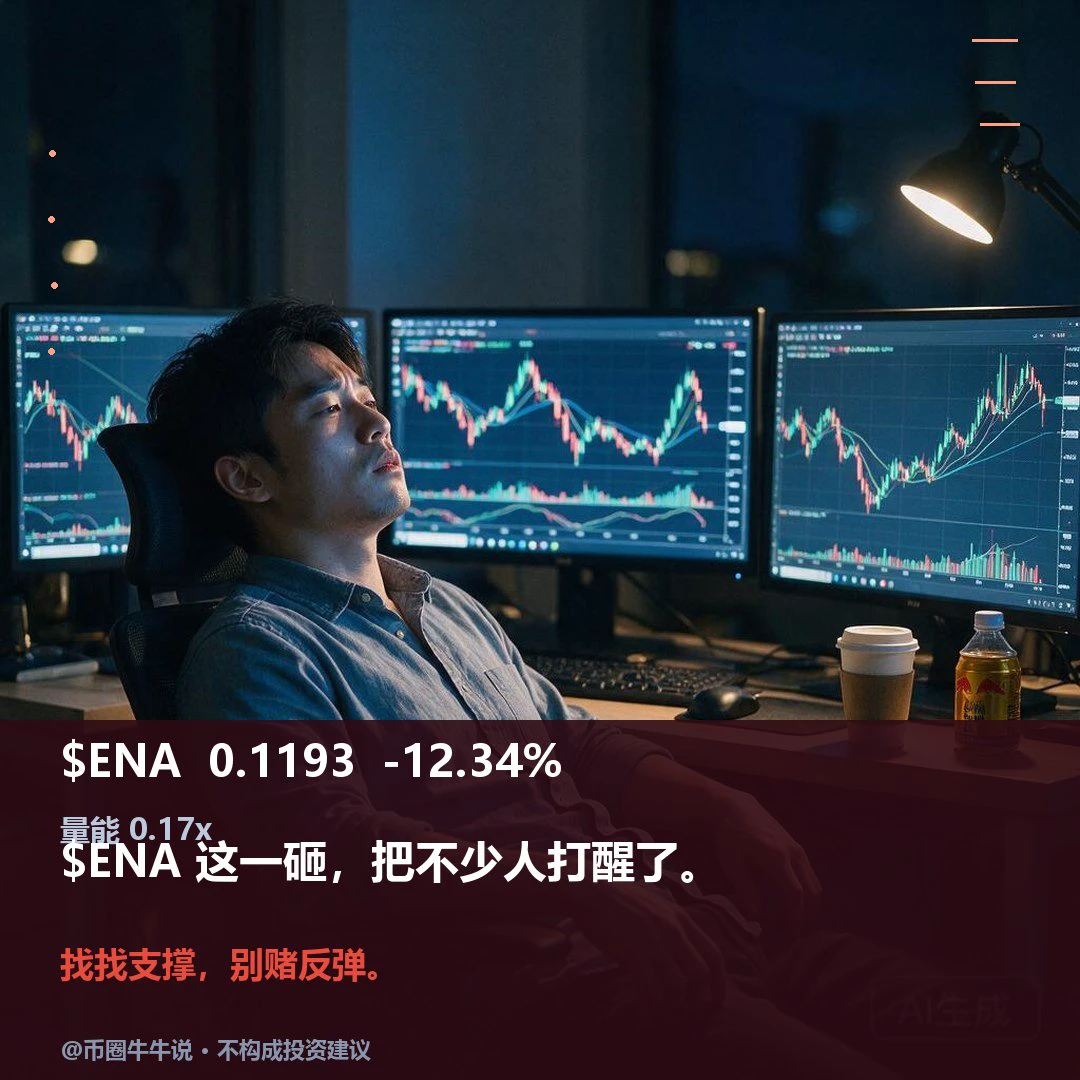
$ENA is currently at 0.1193, down 12.34% over 24H. The 1H trend is weak, with EMA20 at 0.1266 and RSI at 20.5; resistance is at 0.1377 and support at 0.1181. The 4H trend is weak, with EMA20 at 0.1355 and RSI at 13.9; resistance is at 0.157 and support at 0.1181. If it holds above the 0.1377 resistance, watch for a rebound; a break below the 0.1181 support would mean continued weakness. Review whether it can hold above 0.1377 and recover after losing 0.1181. Volume is only 0.17x the average, so confirmation from trading volume is needed. The market is volatile; for observation only.
post-image
ENA+8.04%
Load More

Join 40 M users in our growing community

⚡️ Join 40 M users in the crypto craze discussion

💬 Engage with your favorite top creators

👍 See what interests you

Trending Topics

GateIPOAccessAnthropic

325.6K Views2.9K Discussing

Gate IPO Access Phase 3 features Anthropic (ANT), with USDT subscription interest starting from 100 USDT. Successful allocations will be delivered as real shares to Gate Stock Accounts. Indicative price: $70–$78/share Subscription: Nov 12–17 (UTC+8) Allocation is not guaranteed. Please manage risk accordingly.

Dr.HanOxfordUnionSpeech

148.8K Views655 Discussing

USOctoberPPIBelowExpectations

469.4K Views1.6K Discussing

View More