Square
Following
Hot
News
Notifications
Profile
Share your thoughts
placeholder
Article
Latest Northern Ireland poll: The Alliance Party is sliding and could lose half its seats in the Assembly. A centrist party being squeezed from both sides—that’s the most dangerous part. Save this, and come back tomorrow to see if it holds up.
Keep an eye on it.
Ireland
post-image
My current view on $BTC is that we prob see a small bounce in the coming 48 hrs and then my guess is that the lows arent' in just yet
Not 100% sure tho, loosely held conviction
BTC-0.67%
Trenches
ZIG
Z
bade
b
ZIG
0x8c...1145
Market Cap
$.
Change
.
24h Vol
$.
Holders
.
STONK
S
bade
b
STONK
6GmA...UNgx
Market Cap
$.
Change
.
24h Vol
$.
Holders
.
CLAUDIA
C
bade
b
CLAUDIA
2j5S...W2ZM
Market Cap
$.
Change
.
24h Vol
$.
Holders
.
IDOL
I
bade
b
IDOL
0x3b...ab07
Market Cap
$.
Change
.
24h Vol
$.
Holders
.
FLOAT
F
bade
b
FLOAT
Bv1a...BMmr
Market Cap
$.
Change
.
24h Vol
$.
Holders
.
Prediction markets assign a 52 percentage probability that Bitcoin will rise to $70,000 by the end
live-cover
LIVE2,000
#RITUAL

RITUAL Surges 102% in 24 Hours: Is This a Real Recovery or a Short-Term Market Rally?

The Myth: A 100% Price Increase Means a Strong Project

Does a cryptocurrency become a stronger investment simply because its price doubles in one day? Not necessarily. A sharp price increase shows that buying activity has become stronger, but it does not automatically prove that the project has achieved long-term success.

RITUAL is an interesting example. Its latest market movement deserves attention, but understanding the reason behind the rally is just as important as watching the price.

Q1: W
post-image
RITUAL
RITUALMoney Ritual
Pump.Fun
MC:$2.65KHolders:1
0%
· Cyber Buys Back $13M in CYBER
live-cover
LIVE2,049
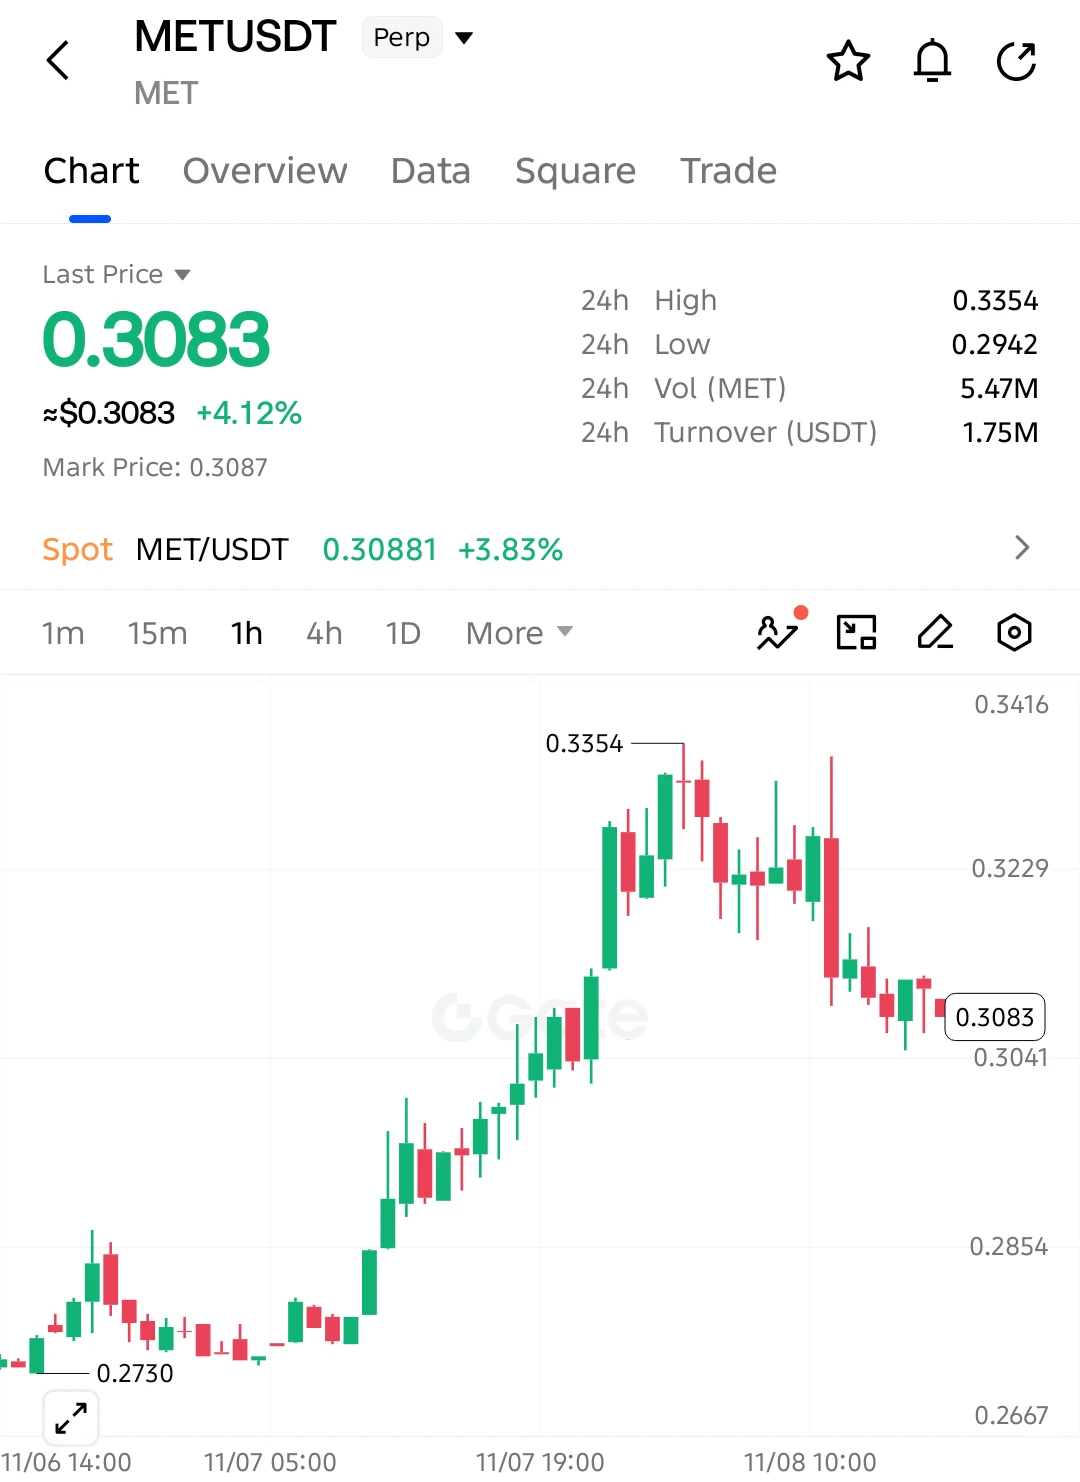
$MET LONG SETUP — BUYERS EYE ANOTHER RALLY!

$MET is up 4.12%, and the recent pullback could offer another buying opportunity as price approaches a key support zone!

Entry: 0.3083
SL: 0.3015

TP1: 0.3160
TP2: 0.3229
TP3: 0.3300
Final Target: 0.3354

$MET rallied strongly from 0.2730 before facing rejection at 0.3354. Price is now testing the 0.3041 support area, where buyers have shown some interest. If this level holds, another recovery toward 0.3229 and potentially 0.3354 could develop.

Invalidation: A sustained break below 0.3015 invalidates the bullish setup.

Keep your eyes on $MET!
post-image
MET-0.33%
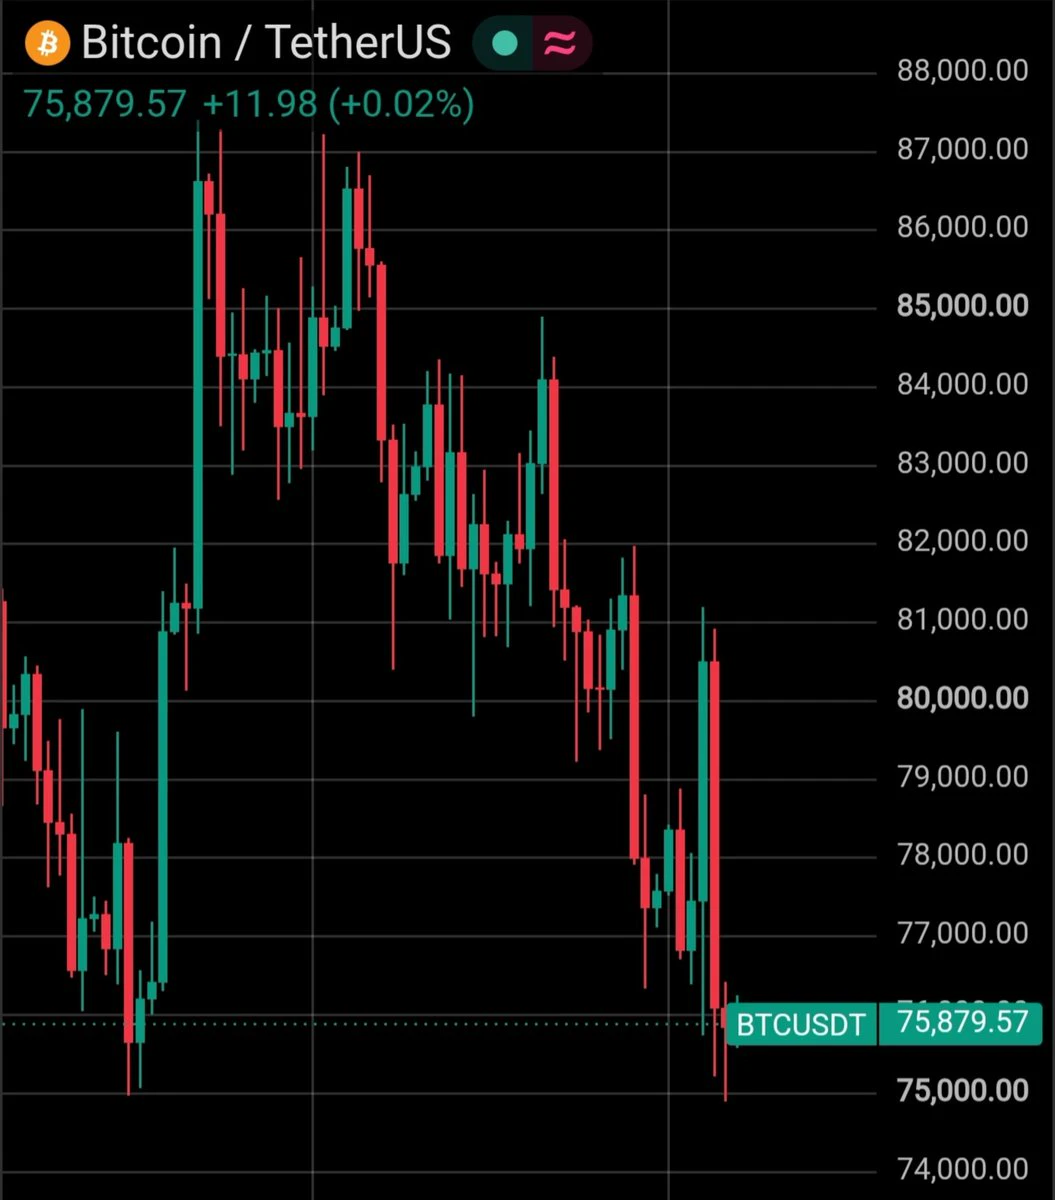
Bitcoin doesn't take weekends off.
BTC is trading around $75.8K, facing strong selling pressure after rejection near $84K.
I'm watching whether buyers can defend this level or if we see another leg down.
post-image
BTC-0.67%
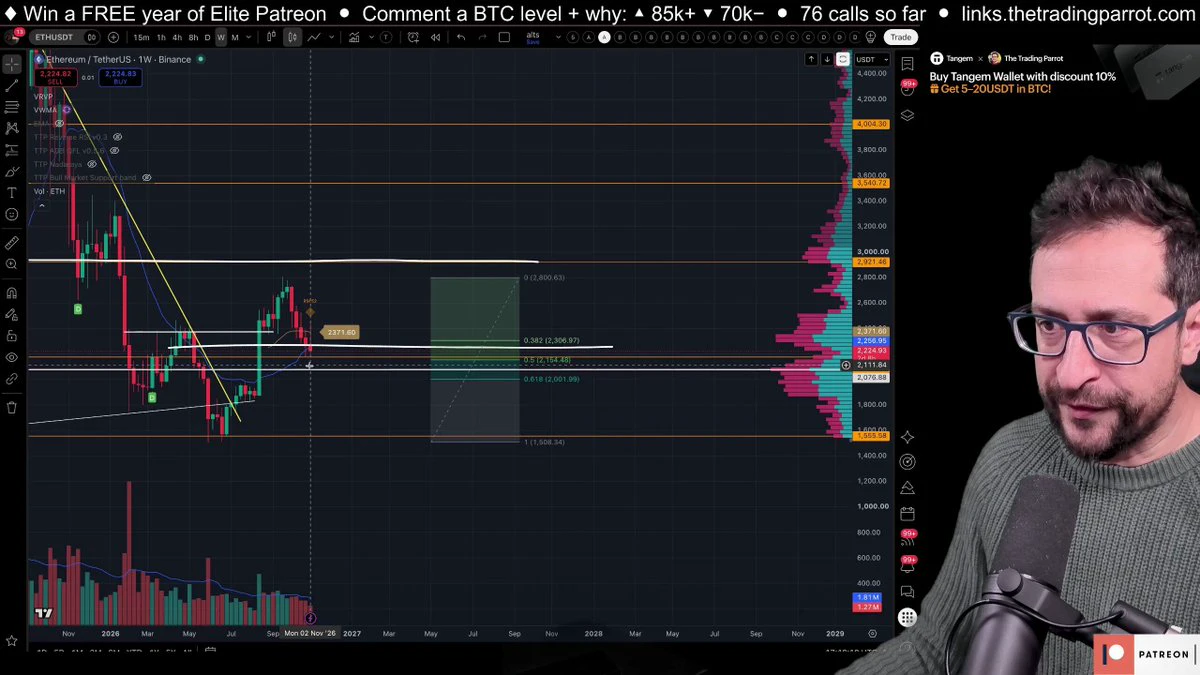
Ethereum on the weekly: the golden pocket sits between $2,154 and $2,000, with the point of control at $2,080. Mariano maps the levels around it and what he is watching for. At 1:17 in the video.
#Ethereum #ETH #Crypto #TechnicalAnalysis
post-image
ETH-1.26%
Is your GPT okay?

$OPENAI ‌
OPENAI-0.03%
  • 1
$AGT Now at 0.0293, up nearly 15% in 24h, but I’ve only kept my core position—I entered at 0.0268 yesterday and just took profit on 70% at 0.0306. I moved the stop on the rest up to 0.0278 to lock in breakeven; for now, I’m taking some gains off the table.
Plan from here: scale back in between 0.0272 and 0.0278 on a pullback, starting with a 30% position; stop out unconditionally if it breaks below 0.0258 (above today’s low). If it breaks straight through the previous high of 0.0309 on strong volume, I’ll chase with a 20% position, target 0.0345, with a stop at 0.0295. Maximum position size:
AGT-26.77%
$DOGE The liquidation map for the past 30 days shows:
If DOGE rises to $0.078, cumulative short liquidation intensity across major exchanges will be $53.91 million.
If DOGE falls to $0.0701, cumulative long liquidation intensity across major exchanges will be $14.15 million.

Trading strategy: Place a long order at $0.07 and take profits in batches from $0.078 to $0.5.$DOGE ‌
DOGE-0.18%
$UAI — Short Entry: 0.08170 Take Profit 1: 0.07700 Take Profit 2: 0.07200 Stop Loss: 0.08750 The sharp drop on the daily timeframe has already damaged the bullish structure. Even if a temporary rebound occurs, it may be difficult to reverse the pressure.
post-image
UAI-7.58%
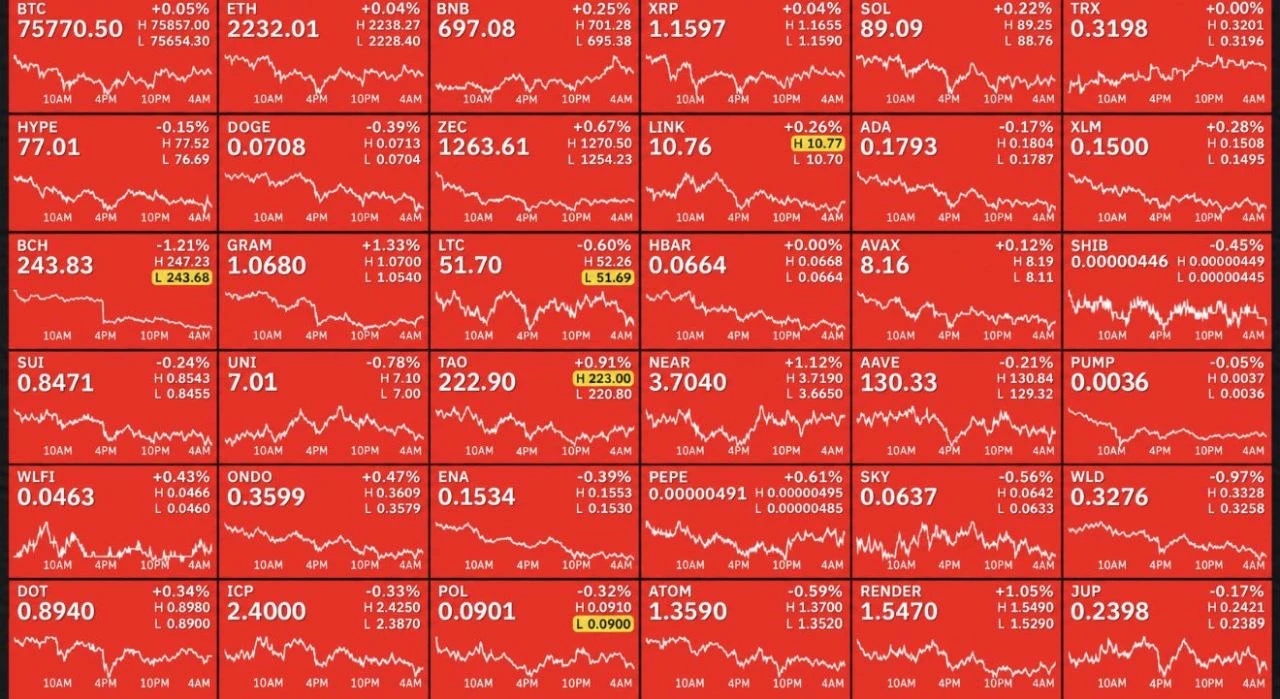
$400B wiped from Crypto during "UPtober" and "Moonvember."
post-image
  • 1
  • 1
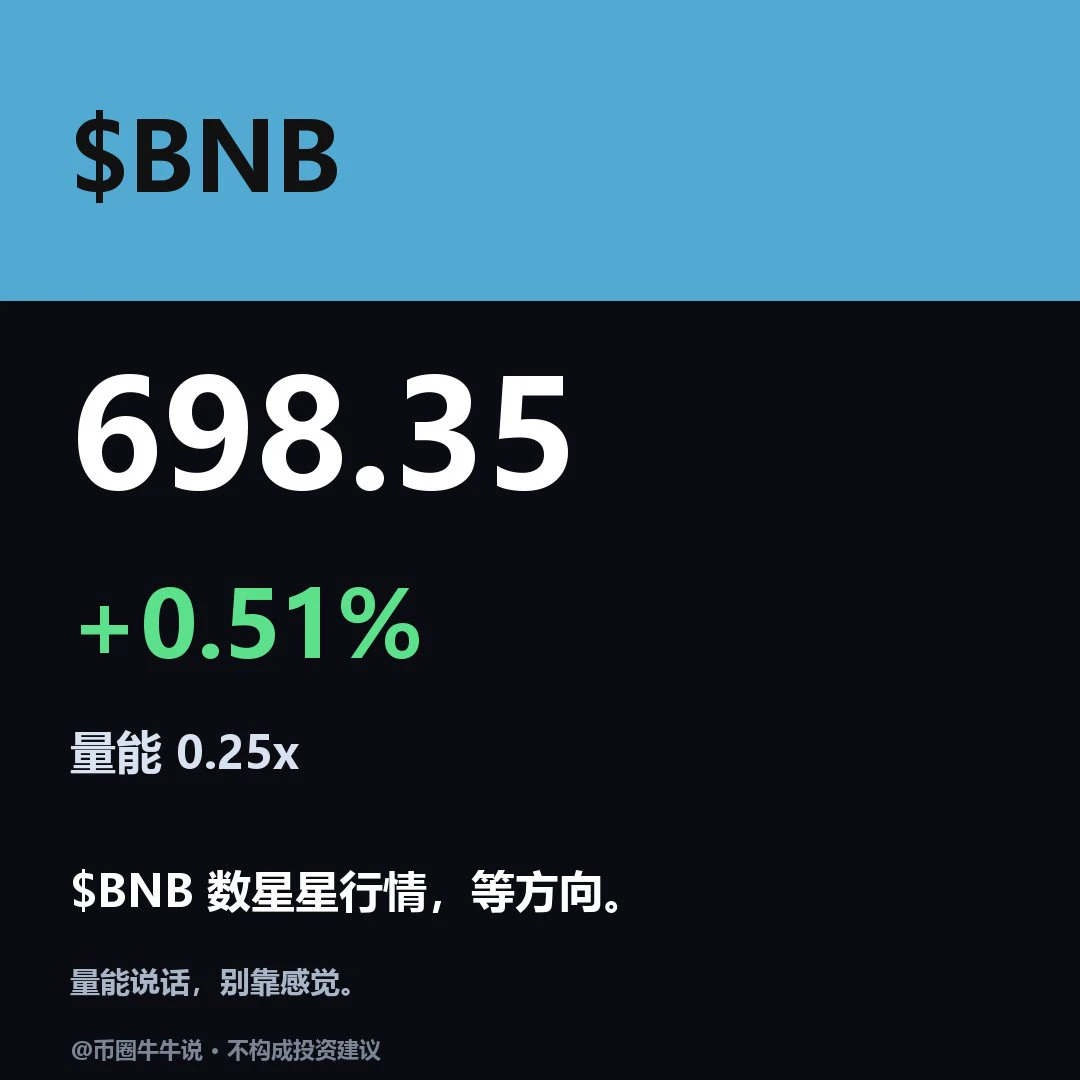
$BNB Current price: 698.35, 24H +0.51% (693.40–702.00). The 1H and 4H structures are both bullish, with price above EMA20 and RSI not overbought: 1H RSI 60.87, EMA20 697.17, support 693.4/resistance 702.0; 4H RSI 68.76, EMA20 697.90, support 683.94/resistance 723.42. The condition for further upside is holding above the 702.0 resistance level; the condition for downside is breaking below the 693.4 support level. Review whether price can hold above 702 and recover after losing 693.4; the volume ratio is 0.25x, and the setup is invalid without confirmation of market participation. Volatility is
post-image
BNB-0.76%
#CPI数据前瞻 #WCTCS9 #作手分析
🔥 US October CPI is about to be released! Have all the bearish factors already been priced in? Can this inflation report still trigger a sell-off?

Trading focus: $BTC $ETH $NVDA $GOOGL $XAU

At 21:30 Beijing time on November 10, the US will release its October CPI data.

September CPI rose 3.7% year over year. The market expects headline CPI to rise about 0.24% month over month in October, and core CPI to rise about 0.2%.

I have a view on this CPI report that differs from the market consensus: if inflation comes in below expectations, the market may see a reboun
BTC-0.67%
ETH-1.26%
NVDA+2.80%
GOOGL+0.72%
XAU+0.38%
  • 3
The 1-hour chart for $RITUAL/USDT is displaying an explosive bullish trend, currently trading at 0.043091 after a massive +109.75% surge. The price action has aggressively broken out of a consolidation zone, with the short-term moving average (MA5 at 0.037512) leading the charge above the MA10 (0.034111) and MA30 (0.027143), confirming strong momentum. The MACD is deeply bullish with the DIF line (0.004380) well above the DEA line (0.002974), and volume is spiking, indicating heavy buying pressure driving this parabolic move.

The recent price action is characterized by a series of strong, con
  • 3
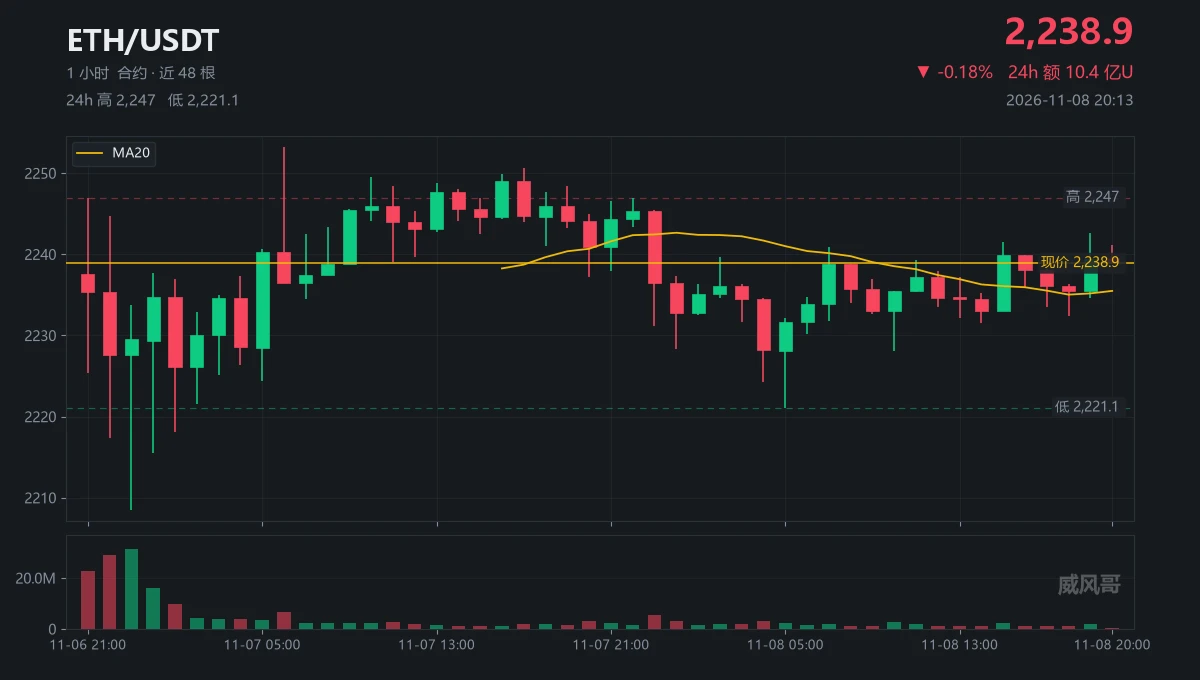
(24-hour high 2247, low 2221.1, a difference of 25.9 bucks)
(Convert that to a percentage: 1.16%—sounds like a dead fish. The first yardstick)
(The second yardstick doesn't measure the move; it measures the speed)
(The 11-06 23:00 candle, with 7x volume, slammed down to 2208.5)
(Seven hours later it climbed to 2253.24, at 6.4 bucks per hour)
(Over the past 38 hours, it moved 26 bucks, at 0.68 bucks per hour)
(Same stretch of price action, nine times slower—the two yardsticks clash)
(Which one is real? Look at volume: 0.09 to 0.57x across ten candles)
(The 19:00 candle, with 2.12 million contra
post-image
ETH-1.23%
$JCT This price action is very patterned. The previous few times, it plunged more than 40% without warning, then quickly rebounded. This is clearly the market manipulators playing a game of sharp drops and quick rallies. Just keep holding your short positions.

$JCT Futures
Risk warning: The above is only a personal opinion and does not constitute investment advice. Futures trading carries extremely high risk; please proceed with caution.
post-image
JCT-3.26%
  • 2
Load More

Join 40 M users in our growing community

⚡️ Join 40 M users in the crypto craze discussion

💬 Engage with your favorite top creators

👍 See what interests you

Trending Topics

USCPIDataIncoming

7.61k Views1.57k Discussing

The U.S. October CPI report will be released on November 10 at 8:30 a.m. ET. September CPI came in at 3.7% year over year, and markets will be watching closely for signs that inflation is cooling, especially in core CPI. A softer-than-expected reading could strengthen rate-cut expectations, while hotter inflation may pressure risk assets through higher Treasury yields and a stronger dollar. How do you think this CPI print will move $BTC, U.S. stocks and gold?

USAIStocksHitHard

26.63k Views3.72k Discussing

USNonfarmPayrolls

49.41k Views4.46k Discussing

View More