Square
Following
Hot
News
Notifications
Profile
Share your thoughts
placeholder
Article
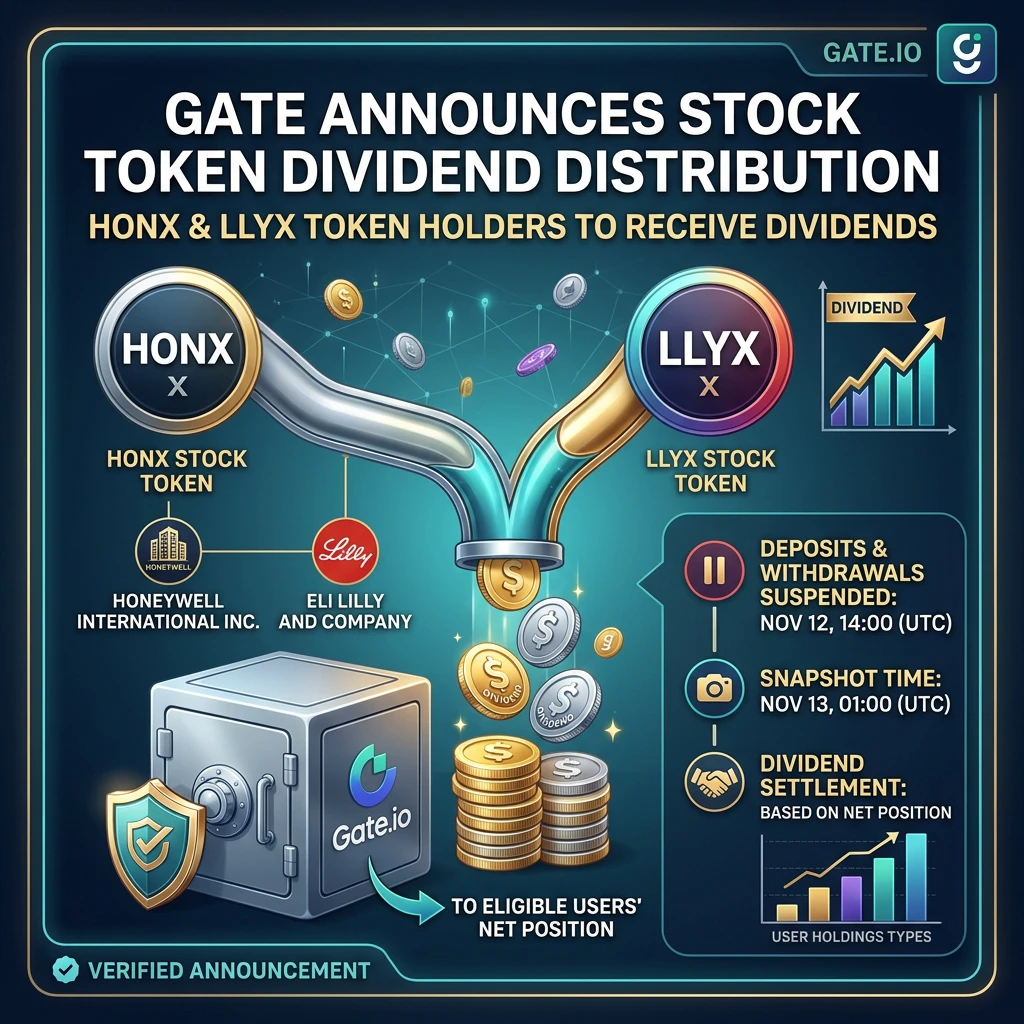
#HONXAndLLYXStock

HONX AND LLYX STOCK TOKEN DIVIDENDS: WHAT HOLDERS SHOULD KNOW BEFORE THE DISTRIBUTION

Imagine holding a stock token in your account and discovering that a dividend distribution is approaching. You may wonder whether your balance will change, whether trading will stop, and whether you need to take action. These are important questions for anyone holding HONX or LLYX.

Gate has announced dividend distributions for both stock tokens. The announcement is a reminder that holding a token linked to a company can involve more than watching its market price. Distribution rules, acc
post-image
HONX+2.89%
LLYX-0.83%
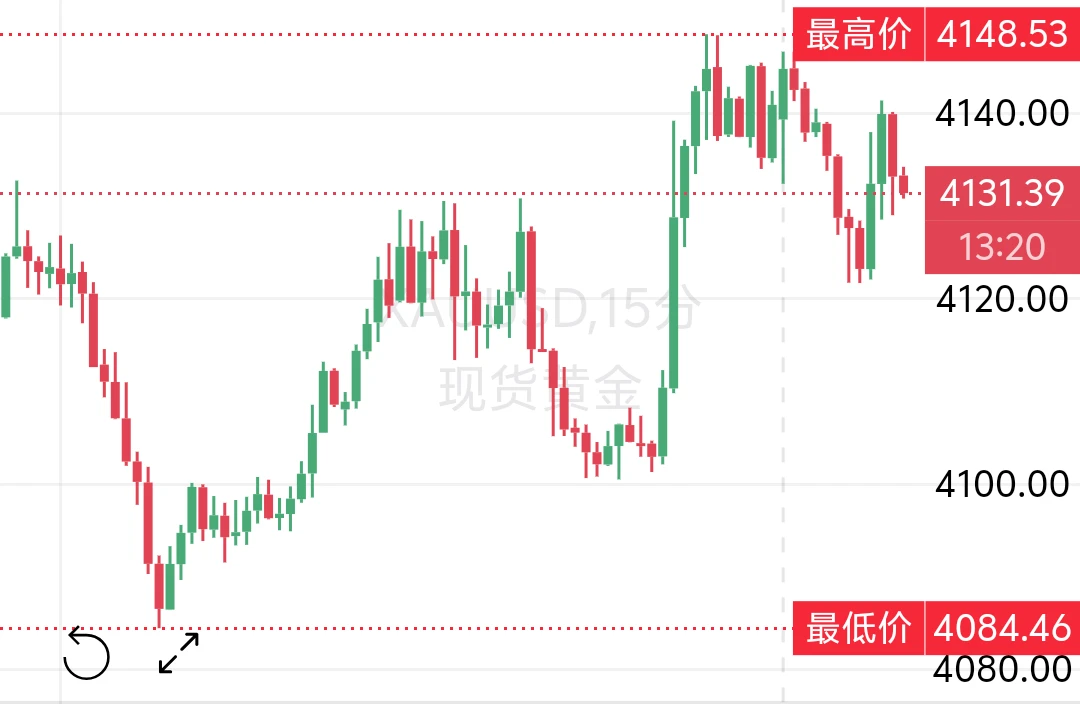
Gold scores two consecutive intraday wins, flips to a short, and bags another win!
Short at 4137, closed at 4124, 13 points, 1909🔪$XAUT
post-image
XAUT+0.30%
Trenches
Libra
L
bade
b
Libra
0xd2...4444
Market Cap
$.
Change
.
24h Vol
$.
Holders
.
牛逼
牛
bade
b
牛逼
0x96...7777
Market Cap
$.
Change
.
24h Vol
$.
Holders
.
PIEVERSE
P
bade
b
PIEVERSE
0x0e...25a9
Market Cap
$.
Change
.
24h Vol
$.
Holders
.
STONK
S
bade
b
STONK
6GmA...UNgx
Market Cap
$.
Change
.
24h Vol
$.
Holders
.
ON
O
bade
b
ON
0x0e...1d48
Market Cap
$.
Change
.
24h Vol
$.
Holders
.
A $1.5 trillion valuation still not enough? Anthropic’s IPO has investors feeling the squeeze first!

If artificial intelligence can think, then the biggest question for Wall Street this time is how much Anthropic is really worth.
The AI company behind Claude is preparing to list on Nasdaq under the ticker ANT. Market discussions previously put its valuation at $1.5 trillion or even higher, but a recent tech stock pullback has prompted some investors to reassess that figure.
Here’s the question: Does leading AI technology automatically mean a stock is cheap? Clearly not.
A company can have top
SPCX+5.90%
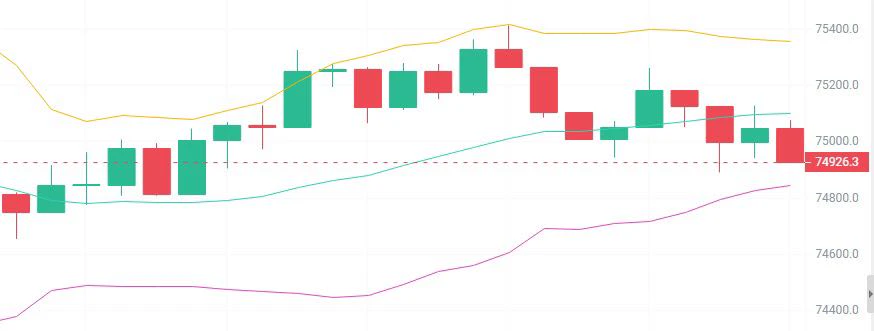
BTC thoughts for this morning

Trade:
Short near 755-760
First target: 750-745
Second target: 740-735
Set a stop-loss

BTC surged and pulled back, facing resistance at the middle band. The MACD has made a bearish crossover, and the short-term outlook is bearish. The strategy is to firmly avoid chasing the drop. Wait for a bounce to the middle band or near the previous high, then look for a stall and a bearish close before testing a short with a light position. Targets are the lower band and the previous low; keep a hard stop at the previous high. In my view, although the broader trend is beari
post-image
BTC-0.65%
Figure 3: The stop loss was set too tight and got swept, then the second take-profit was hit perfectly
‍$BTC Spot ETFs saw outflows in 4 of the past 5 weeks
‍$ETH Spot ETFs have now seen outflows for 6 consecutive weeks
But capital flight is an effect, and the data is lagging
There are many reasons why the crypto market as a whole is under pressure
In the next few posts, we'll break down one by one the reasons crypto will remain under pressure in the medium term
BTC-0.65%
ETH-1.23%
$NVDA ‌
Technical Analysis and Market Risks

• Short-term trend: Strong sell. On daily charts, technical indicators and moving averages point to bearish dominance.
• Momentum (RSI): The 14-day Relative Strength Index is at 39.02. The stock is approaching oversold territory (below 30), which could trigger a short-term technical rebound.
• Support levels: The chart has broken through the psychological $200 mark. If the broader market correction continues or investors take profits in the artificial intelligence (AI) sector, the price could test the annual low around $164–$170.
NVDA-4.34%
🔮 Crypto, stocks, gold, macro trends, prediction markets...
Whatever your area of expertise, you're welcome to join Gate Live, create quality content consistently, grow your influence, and earn a steady income!

🎁 New streamers can earn up to $100 in rewards
💰 Get up to 40% in livestream mining commission rebates
🔥 0% commission on subscription revenue
👥 Build your own community and grow a loyal fan base

Connect with tens of millions of users in your niche and let more people discover your expertise!
👉 Go live now: https://www.gate.com/live
post-image
GLDX-0.40%
PAXG+0.37%
XAU+0.38%
  • 4
  • 2
Can this rally hold?
post-image
Sister U 11.10 Tuesday Bitcoin $BTC Strategy

Entry: Short on a rebound near 755-760
Stop-loss above 765
Target 745-735
Go long if it retests around 745 and stabilizes

On the hourly chart, prices plunged sharply on heavy volume yesterday, dropping quickly from around 76000 to a low of 73500 before staging an oversold rebound. The price is now fluctuating around the 75000 level. This is currently just a rebound within a downtrend; the main bearish structure has not reversed. Prices are likely to consolidate within a range today as the market digests the move, while awaiting the CPI data.
BTC-0.65%
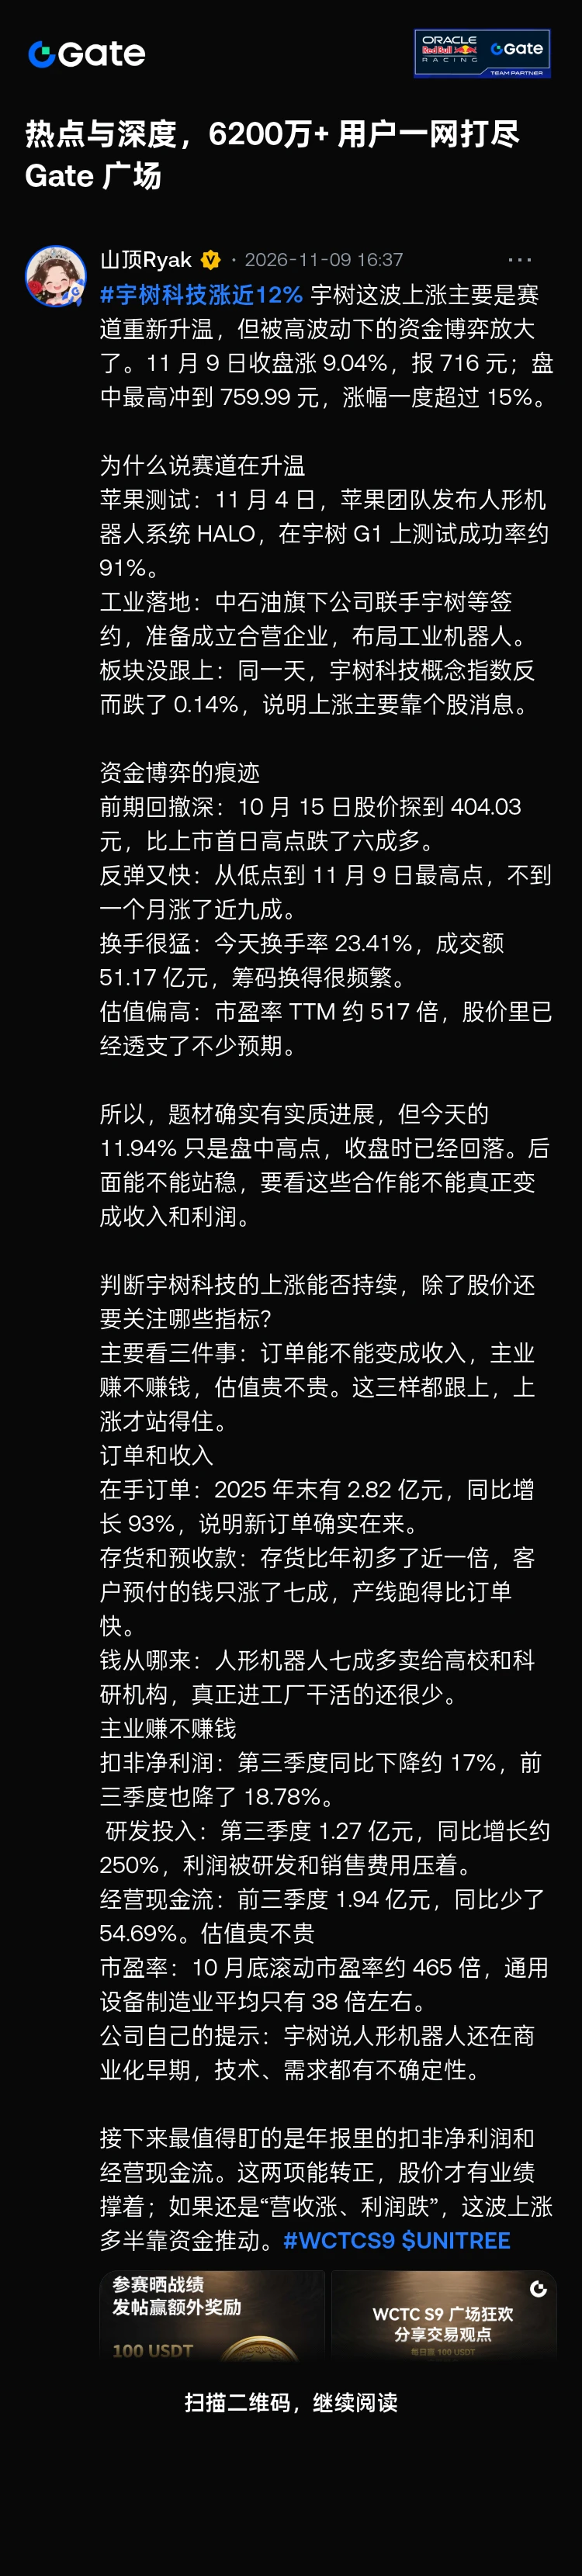
$UNITREE Unitree toy factory, you're incredible. I can accept taking a loss at the top, but even these fee vampires can't suck as much as you. I'm done playing with you. Bye.
post-image
UNITREE+4.35%
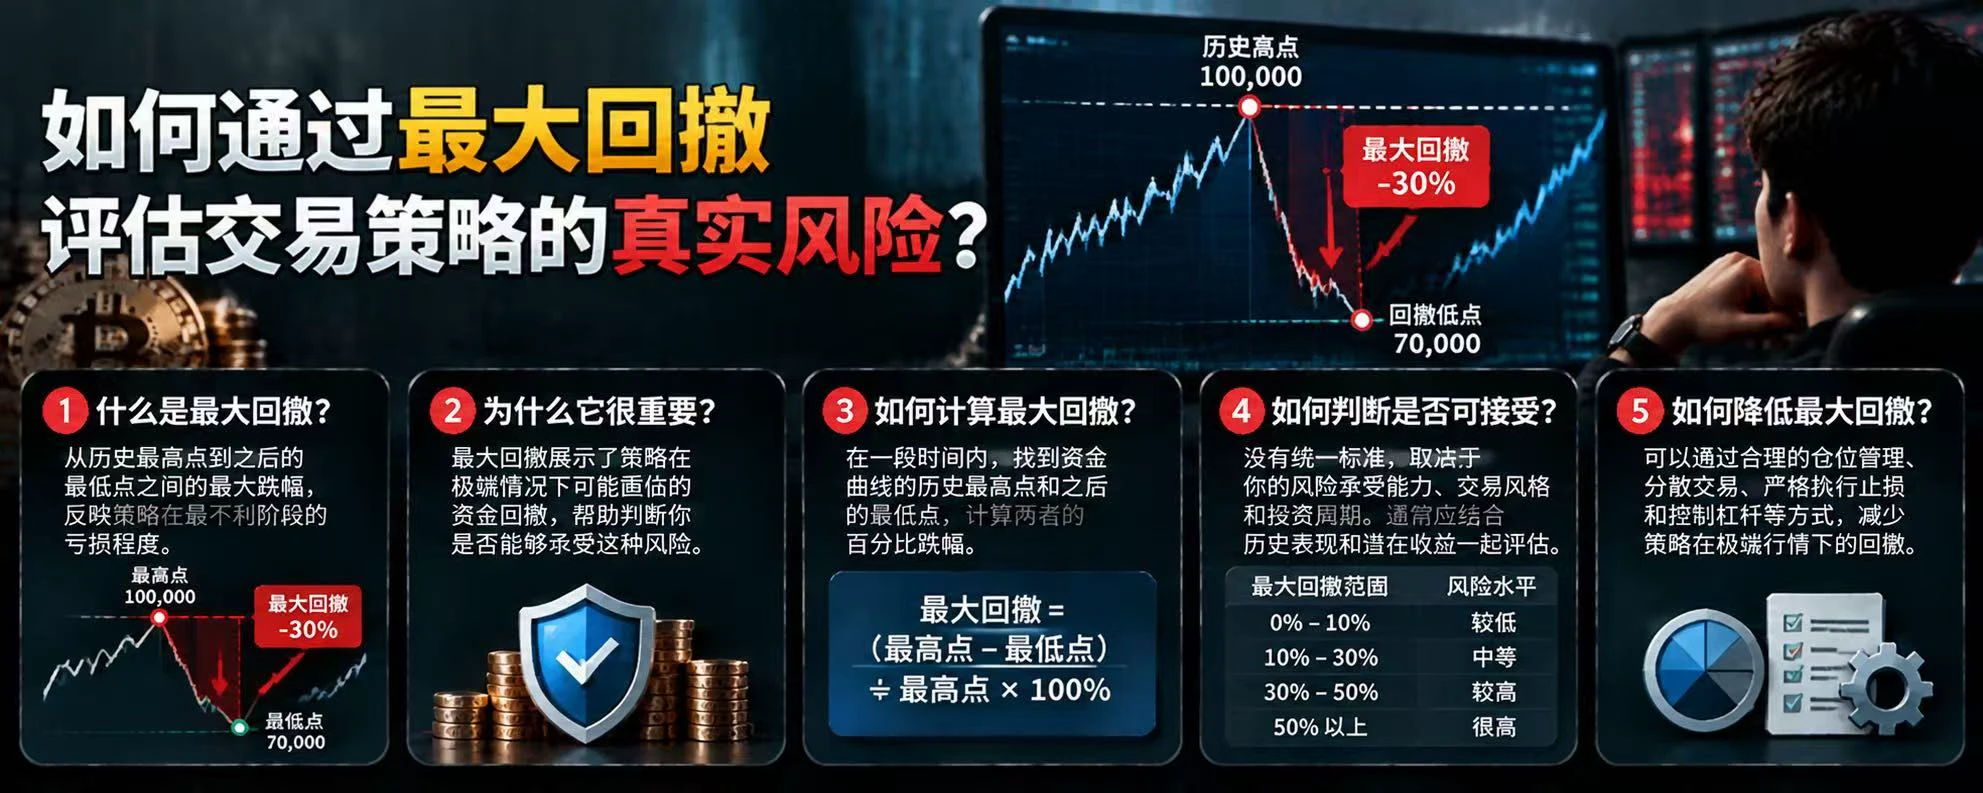
What Is Stress Testing? How Can You Check Whether a Trading Account Can Withstand Risk in Extreme Market Conditions?

In cryptocurrency trading, a strategy that profits under normal market conditions is not necessarily safe during a crash, a liquidity crunch, or a series of liquidations. Stress testing evaluates how much loss an account might withstand by simulating extreme but possible market scenarios.

First, what is stress testing?

It does not predict what will definitely happen in the market. Instead, it poses hypothetical questions: What would happen to your account if BTC suddenly fell
post-image
BTC-0.65%
Fable 5.2
“Meet your toughest challenges”
post-image
[New Streamer] Market Prediction
live-cover
LIVE1,863
Gm X Family
Can Anyone Say What Is Hide From From This Picture ..?
Guess What's Inside 🥰
post-image
11.10 SOL Analysis

Analysis: Short near 87.2-88.0 on a rebound, with a stop at 88.6; first target 85.5, second target 84.7

On the 1H chart, the current price is 86.00. After plunging on heavy volume from a high of 89.98, the market dipped to a low of 84.66 before entering a low-level consolidation and recovery. Recent candlestick action shows rebounds near 87.8-88.0 being repeatedly rejected, with each rebound high lower than the last, indicating genuine selling pressure at that level. The yellow Supertrend resistance line is near 87.5, the cyan moving average is flattening near 86.8, and th
post-image
SOL-0.77%
Tuesday morning, Nov 10 — Zhongling Gold Strategy

Review of yesterday’s price action: Gold rallied from an early-session low of 4054, climbed to 4134 before meeting resistance and pulling back, then touched a low of 4084 and consolidated. It stabilized and surged again in the evening.

Today, focus on the US CPI inflation data, a key recent market driver. If the data comes in above expectations, it could quickly fuel rate-hike expectations and pressure gold lower.

On the hourly chart, gold rebounded after bottoming out last night, with bullish sentiment recovering and the short-term bias tur
post-image
XAU+0.38%
BTC-0.65%
#GateRanksThirdIn24HNetInflows
In the middle of one of the more volatile stretches crypto has seen this month, Gate just posted another notable data point.
According to DefiLlama, Gate recorded approximately $40.66 million in net inflows over the past 24 hours. That figure was enough to rank the exchange third among global centralized exchanges.
The number lands in a specific context. Bitcoin had just endured a sharp flash crash, dropping more than $2,000 in roughly 15 minutes and triggering over $1 billion in liquidations, the vast majority of them long positions. Markets were still digestin
BTC-0.65%
ETH-1.26%
  • 3
Morning Market Update
live-cover
LIVE2,156
Went long BTC and ETH from the lows last night and caught the rebound again!

Around 7 p.m., US-Iran news sparked a rally, but I didn’t blindly chase longs.

I then focused on two levels: BTC 74500 and ETH 2120. The pullbacks never broke below them.

Combined with the US stock premarket not weakening further, I confirmed support was holding and decisively entered long.

BTC ultimately reached a high of 75500 and ETH reached 2150. I took profit on both as planned!

Don’t chase news-driven rallies; enter after support is confirmed. Switching from short to long at the right time is key.$BTC ‌$ET
post-image
BTC-0.65%
ETH-1.23%
11.10 BTC Trading Setup

  BTC is currently in a rebound and recovery phase on the minute chart following a sharp drop. The Bollinger Bands are gradually narrowing and flattening after widening during the previous decline, with the overall trend showing a choppy but bullish bias. The strategy is to primarily enter long positions on pullbacks to support. Key support levels are the 74900-75000 range and the 74400-74500 range, with strong support around 73850. Short-term resistance is in the 75400-75500 range, while medium-term resistance is near the previous high area of 76100-76200.

  Entry zo
post-image
BTC-0.65%
Load More

Join 40 M users in our growing community

⚡️ Join 40 M users in the crypto craze discussion

💬 Engage with your favorite top creators

👍 See what interests you

Trending Topics

USCPIDataIncoming

48.32k Views2.15k Discussing

The U.S. October CPI report will be released on November 10 at 8:30 a.m. ET. September CPI came in at 3.7% year over year, and markets will be watching closely for signs that inflation is cooling, especially in core CPI. A softer-than-expected reading could strengthen rate-cut expectations, while hotter inflation may pressure risk assets through higher Treasury yields and a stronger dollar. How do you think this CPI print will move $BTC, U.S. stocks and gold?

USIranTalksShowNewProgress

5.03k Views1.21k Discussing

KoreanStocksJumpOver5%

569 Views4.81k Discussing

View More