Share your thoughts
placeholder
Article
btc update
live-cover
LIVE33
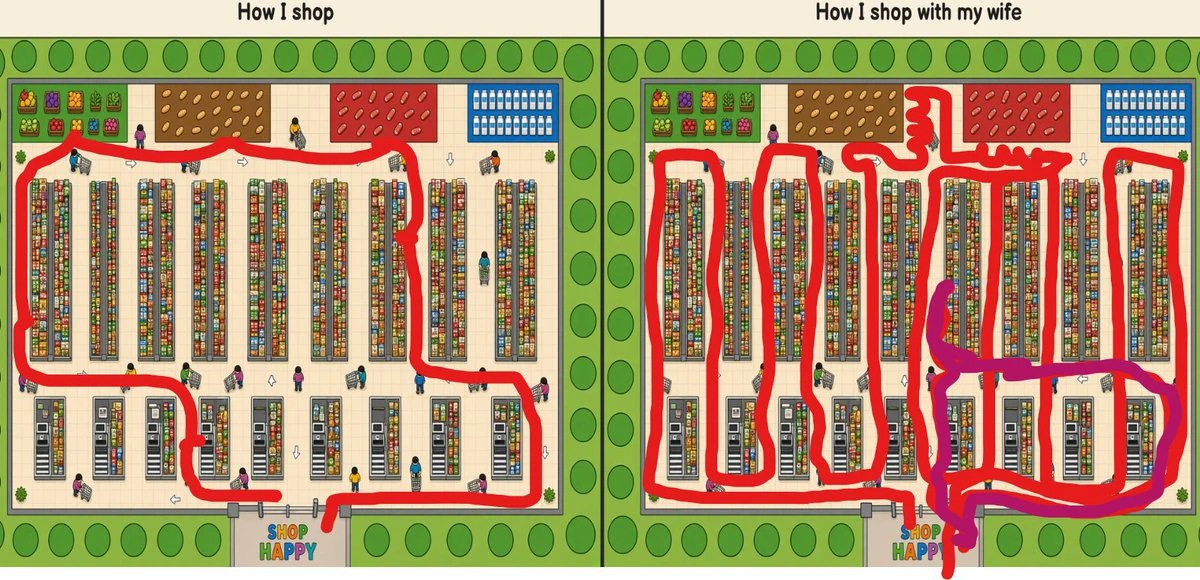
How do you shop with family?
post-image
I had already finished complaining to friends about this week's market, only to have to take it all back—kind of awkward. During the repeated intraday swings, $SCRT fell just short every time it pushed higher, giving off a strong bull-trap vibe, with insufficient buying support and volume failing to keep up. I warned that longs were facing resistance at the highs—don't chase longs.
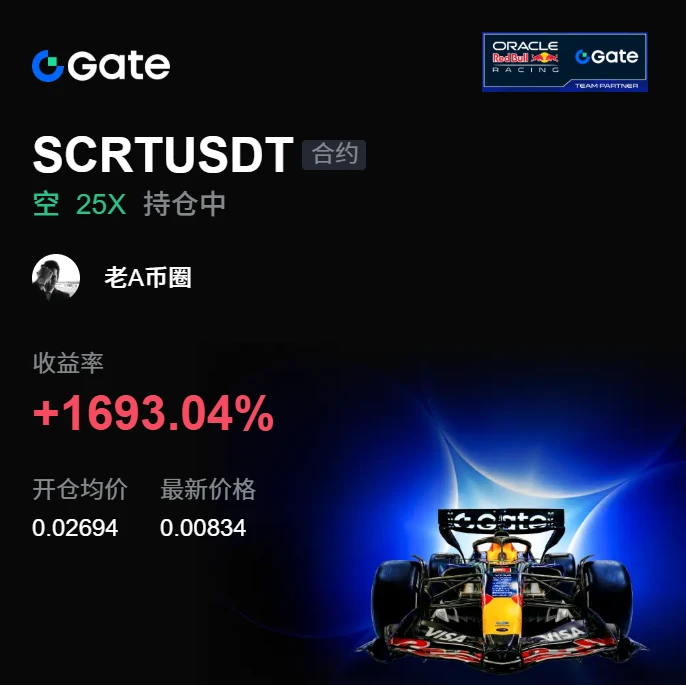
Opened a short at 0.02694 and caught 0.00834, with floating profit of +1693.04%. That was a satisfying bite of meat; everyone on board must have woken up laughing.
Don't lose patience in the range, only to try to w
post-image
SCRT+0.85%
ADA+1.38%
DOGE-0.61%
#GateSquareMidAutumnReunion
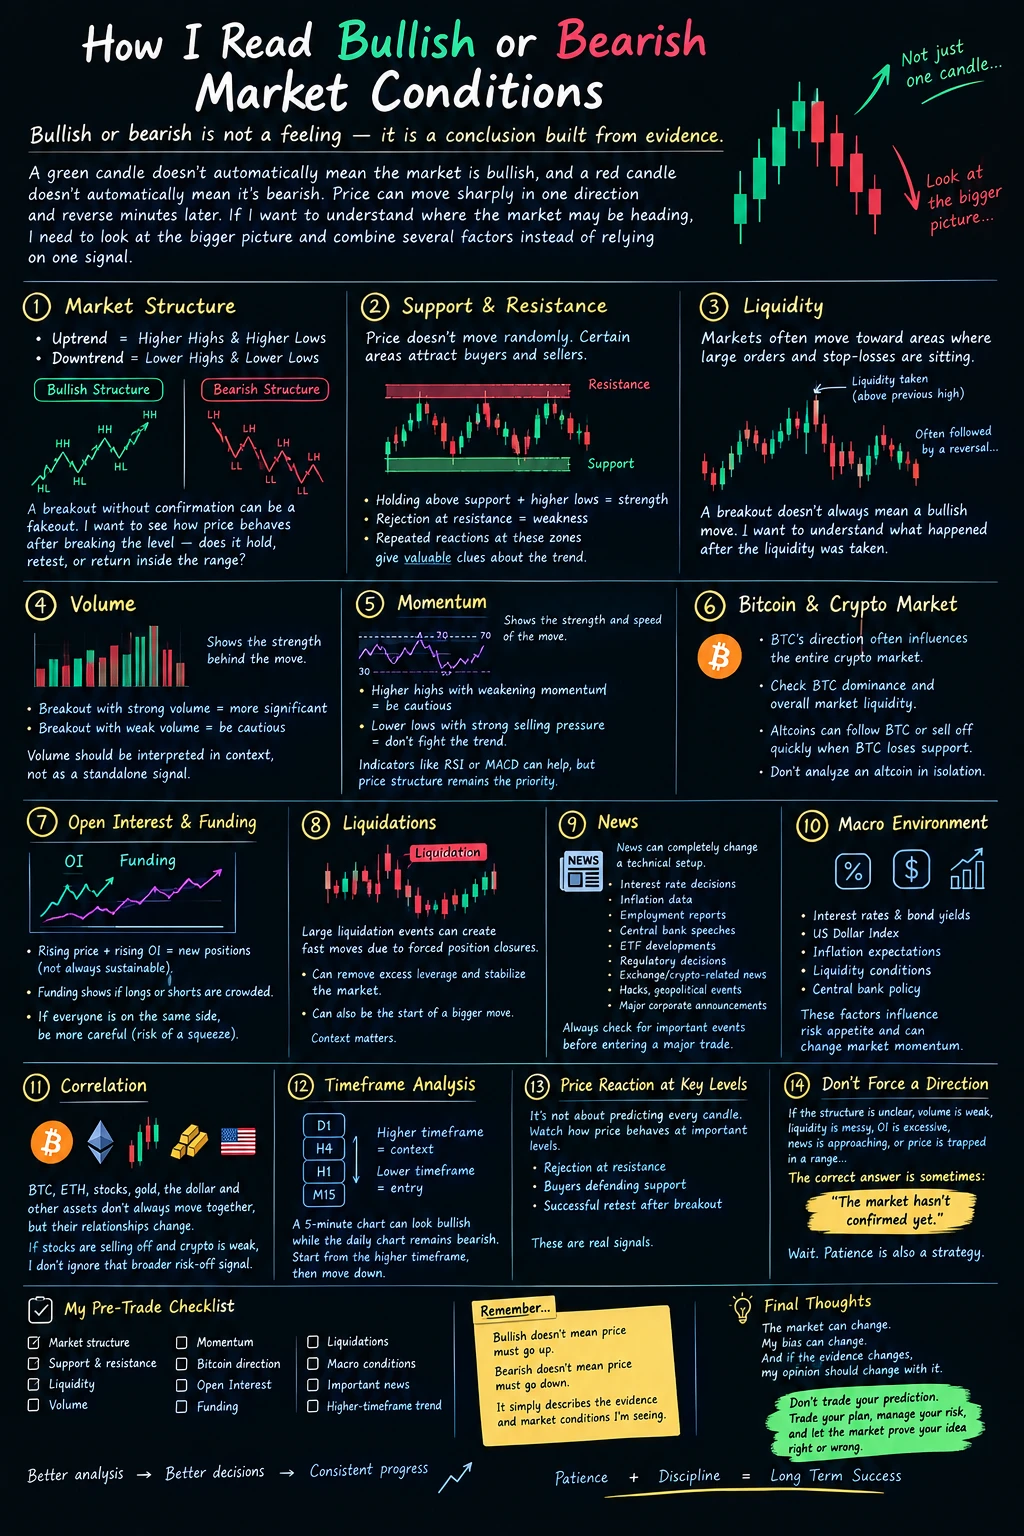
One thing I learned from trading is that bullish or bearish is not a feeling — it is a conclusion built from evidence.
A green candle doesn't automatically mean the market is bullish, and a red candle doesn't automatically mean the market is bearish. Price can move sharply in one direction and reverse minutes later. If I want to understand where the market may be heading, I need to look at the bigger picture and combine several factors instead of relying on one signal.
The first thing I watch is market structure. This is probably the foundation of my analysis. In a
post-image
  • 1
After seeing the price hold steady above key moving averages and open interest remain stable, I caught a clean trend-following trade at $SYN
. ✅ was well-positioned for a solid 35% gain. 📈Profit: $ 249Meanwhile, I opened two charts: $ZEC and $EPIC .
post-image
SYN+35.25%
ZEC-0.72%
EPIC+13.10%
Watching the market nonstop got annoying; once I turned it off, I could see things more clearly, and without keeping my eyes on it, I no longer felt anxious.

A few nights ago before bed, $HOME had strong bull-trap vibes, with insufficient buying support and heavy selling pressure. I warned not to catch it—the rebound was just for shorting.

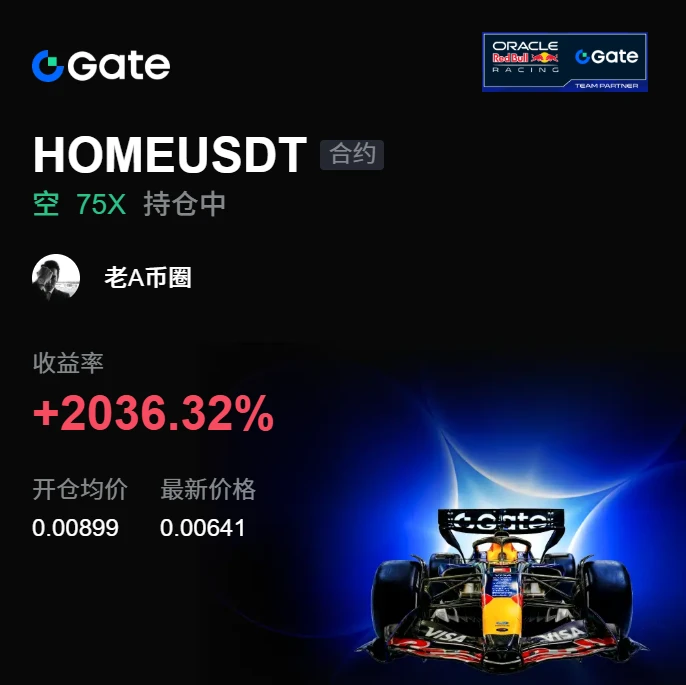
Held a short from 0.00899 until now at 0.0064, +2036.32%. The wait was worth it—feels great. Take profits when it’s time: close 80% first, protect the cost basis on the rest at +2036.20%, and let the profits run if it keeps dropping.

Don’t get carried
post-image
HOME+8.36%
ZEC-0.67%
SNDK-0.60%
#ShareWeekly
My Trading Rules
These are the rules I follow throughout my trading journey. They are not about making quick profits — they are about protecting my capital, controlling my emotions, and staying disciplined.
1. Control Your Emotions
Before, during, and after every trade, pay attention to how you feel. Keep notes about your emotions and learn to recognize fear, greed, FOMO, frustration, and overconfidence before they influence your decisions.
2. Be Patient and Disciplined
Trading can be boring when there are no quality setups — and that's completely normal. Never force a trade just
post-image
Smart money is accumulating SYMB while retail panics at the daily close.

$BNB /USDT - LONG

Trade Plan:
Entry: 760.22 – 762.48
SL: 750.48
TP1: 769.50
TP2: 774.94
TP3: 783.09

Why this setup?
Why now? The 1d trend is bullish and the 1h price is sitting at 761.35, perfectly inside the entry zone between 760.22 and 762.48. The 15m RSI at 40.23 shows the asset is oversold enough to bounce but not yet recovering, which is where patient entries belong. The 1h ATR of 4.528934 tells us the next hourly move is likely bigger than the spread, giving the trade room to breathe. Target 1 is 769.50 and t
BNB-0.69%
Why is everyone still holding PEPE when the setup says otherwise?

$PEPE /USDT - SHORT

Trade Plan:
Entry: 0 – 0
SL: 0
TP1: 0
TP2: 0
TP3: 0

Why this setup?
Why now? The daily trend is range, which means the price is coiling for a directional move and a short bias makes sense. The 15m RSI sits at 68.83, showing momentum is leaning bullish but not yet overbought enough to invalidate the reversal. The 1h ATR is 0, indicating an extreme contraction in volatility that often precedes a sharp breakdown. The entry zone aligns with the 1h price, giving a precise trigger for the short. The invalidat
PEPE+7.59%
Breaking 🚨The Federal Reserve is expected to inject $1.95 billion into the US economy before the market opens next week 🚀. Kevin Warsh has ordered an emergency liquidity injection to avoid a possible market crash on Monday. The move shows deep concern about market stability and could boost liquidity across various asset classes. Traders are preparing for rapid price fluctuations 🔥. Stay tuned for further updates 📈.$ON , $ZAMA , $ONE
.
post-image
ON+5.36%
ZAMA+36.19%
  • 1
Insiders are quietly loading up on SYMBOL while the charts stay dead quiet.

$NEAR /USDT - LONG

Trade Plan:
Entry: 3.5246 – 3.5720
SL: 3.3204
TP1: 3.7192
TP2: 3.8332
TP3: 4.0042

Why this setup?
Why now? The 1D trend is firmly bullish, the 1h price sits at 3.5483, and the 15m RSI at 41.51 shows room for a fresh leg up. The 1h ATR of 0.094969 confirms enough volatility to push from the entry zone at 3.5483 toward the first target at 3.7192 and then the second target at 3.8332. The daily structure supports continuation, but the 3.3204 level is the line in the sand that must hold.

Debate:
A
NEAR-3.62%
Zcash 's development teams have reached unanimous agreement on NU7.
And the market reacted fast.
🚀 $ZEC +10% to a new ATH of $1,526
🧪 Testnet: October 6
🔢 Block height: October 20
🌐 Mainnet: November 5
The upgrade cuts block times from 75s → 25s, bringing faster confirmations while keeping the existing halving schedule.
post-image
ZEC-0.72%
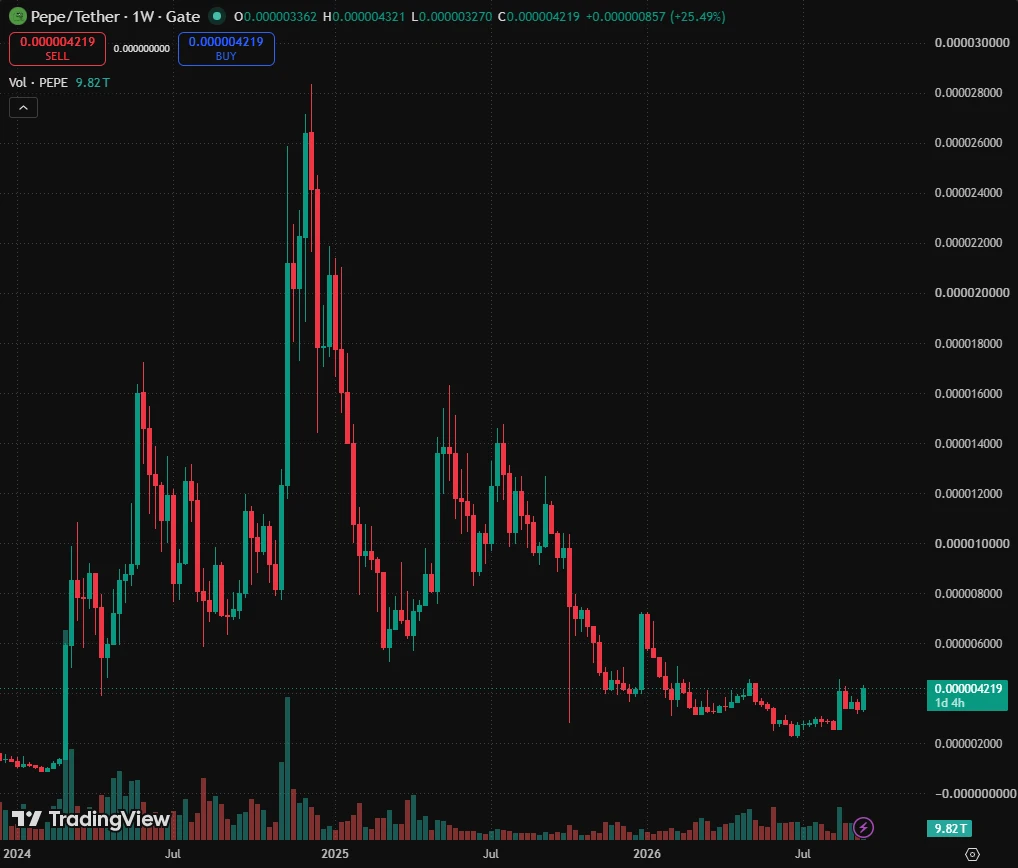
$PEPE PEPE: A Potential Trend Shift Ahead
P
PEPE/USDT
– Weekly Analysis
PEPE continues to trade within a descending channel, with price approaching the upper trendline and a key resistance area.
The breakout or rejection at this key zone will be important to watch.
post-image
PEPE+7.59%
So I was checking the charts earlier and noticed $AVAX making some serious waves today. We are looking at a 18.336% gain with the price currently sitting right at $9.7, after testing a daily floor of $8.178 and a ceiling of $9.844. It really makes you wonder how the next few hours will play out as volume flows in. If you are mapping out risk-management ideas for educational purposes only, a bullish scenario could use entry $9.7, stop-loss $9.409, and take-profit $10.185. Meanwhile, a bearish scenario for illustration might consider entry $9.7, stop-loss $9.991, and a take-profit target down at
post-image
AVAX+17.43%
#GateMeme狂欢季 #GateMeme Meme Token Launchpads — Comparison of PONS, STONK, PUMP, and BONK
I. Basic Overview of the Assets
Token launchpads are permissionless, one-click token issuance infrastructure. They rely on bonding curves to facilitate token issuance and on-chain trading. Their core business model is to collect trading fees and capture token value through buybacks and burns.
PONS
The native token launchpad of Robinhood Chain, modeled after Solana’s shturlc, with a fair launch in mid-July 2026. It supports one-click deployment of Meme and RWA tokens. Trading fees are split 70:30, with 70%
post-image
BTC BOLD MOVES 🔥
live-cover
LIVE511
A little birdie told me that something is cooking on $SUI and no one is ready for it yet...
Something fast.
Get ready.
post-image
SUI+5.07%
$VELVET should have been gone long ago. There’s no use holding it; it’s already useless. Bye-bye. Buying other things has made huge profits.
VELVET-2.13%
$ZEC /USDT is about to make the boldest move of the week.

$ZEC /USDT - LONG

Trade Plan:
Entry: 1468.91 – 1483.01
SL: 1408.25
TP1: 1526.74
TP2: 1560.60
TP3: 1611.39

Why this setup?
Why now? The daily trend is bullish, and the 1h price sits at 1475.96, which is the exact entry reference for this long setup. The 15m RSI at 28.6 shows the asset is deeply oversold, meaning sellers are exhausted and a bounce is likely. The 1h ATR of 28.21 tells us the real hourly volatility, so the entry zone between 1468.91 and 1483.01 is where smart money is accumulating. The first target is 1526.74, with a
ZEC-0.67%
Load More

Join 40 M users in our growing community

⚡️ Join 40 M users in the crypto craze discussion

💬 Engage with your favorite top creators

👍 See what interests you

Trending Topics

JapanRealEstatePowerChipStocksRise

59.72k Views4.54k Discussing

Japan's Nikkei extended gains on Sept 18, with real estate, power, and semiconductor sectors leading. Gate covers over 12,800 global stocks and ETFs, offering one-stop USDT trading across US, HK, Korean, and Japanese markets. [👉 Read more](https://www.odaily.news/en/newsflash/518749)

USAIConceptStocksRally

34.43k Views1.01k Discussing

GateTopsStockPerpetualCoverage

38.69k Views2.6k Discussing

View More