Square
Following
Hot
News
Notifications
Profile
Share your thoughts
placeholder
Article
Elon Musk openly and unabashedly publicizes his sexual partners!
No concealment whatsoever!
He's just this kind of white man!
Lots of female companions! And he doesn't get married!
And you can't hold him hostage with morality, God, or marriage!
post-image
The livelihoods of workers around the world and the computing power of the entire internet are all hanging by a single network cable that could be unplugged at any moment.

Starting yesterday (November 12), Microsoft’s Microsoft 365 and Azure suffered a global outage that lasted more than a dozen hours. Even today, plenty of people still can’t connect to Outlook, their Teams meetings are frozen, and Copilot has gone completely offline.

Microsoft’s official update on the investigation was straightforward:

The company ruled out an external malicious attack. The issue stemmed from a recent netw
post-image
MSFT+0.36%
GOOGL+1.76%
Trenches
mihao
m
bade
b
mihao
4Cxj...pump
Market Cap
$.
Change
.
24h Vol
$.
Holders
.
AGT
A
bade
b
AGT
0x5d...e274
Market Cap
$.
Change
.
24h Vol
$.
Holders
.
FOOD
F
bade
b
FOOD
FTu5...pump
Market Cap
$.
Change
.
24h Vol
$.
Holders
.
IDOL
I
bade
b
IDOL
0x3b...ab07
Market Cap
$.
Change
.
24h Vol
$.
Holders
.
AI
A
bade
b
AI
2T56...pump
Market Cap
$.
Change
.
24h Vol
$.
Holders
.
I'm tired Alfred.
post-image
How to Find Support and Resistance Levels? Practical Methods for Identifying Key BTC Buying and Selling Zones

In BTC trading, many people study candlesticks every day but often run into the same question: Where might the price encounter resistance as it rises? At what level might support emerge if it falls?

In fact, support and resistance levels are fundamental tools in technical analysis.

First, look at historical highs and lows. If BTC has repeatedly stopped falling and rebounded in a certain price area, that area may form support. Conversely, if the price has risen to a certain level mul
post-image
BTC-0.67%
$ARIA Growth was decent last night. I’ll see how things look tonight and cut another batch around 0.27
post-image
ARIA+22.03%
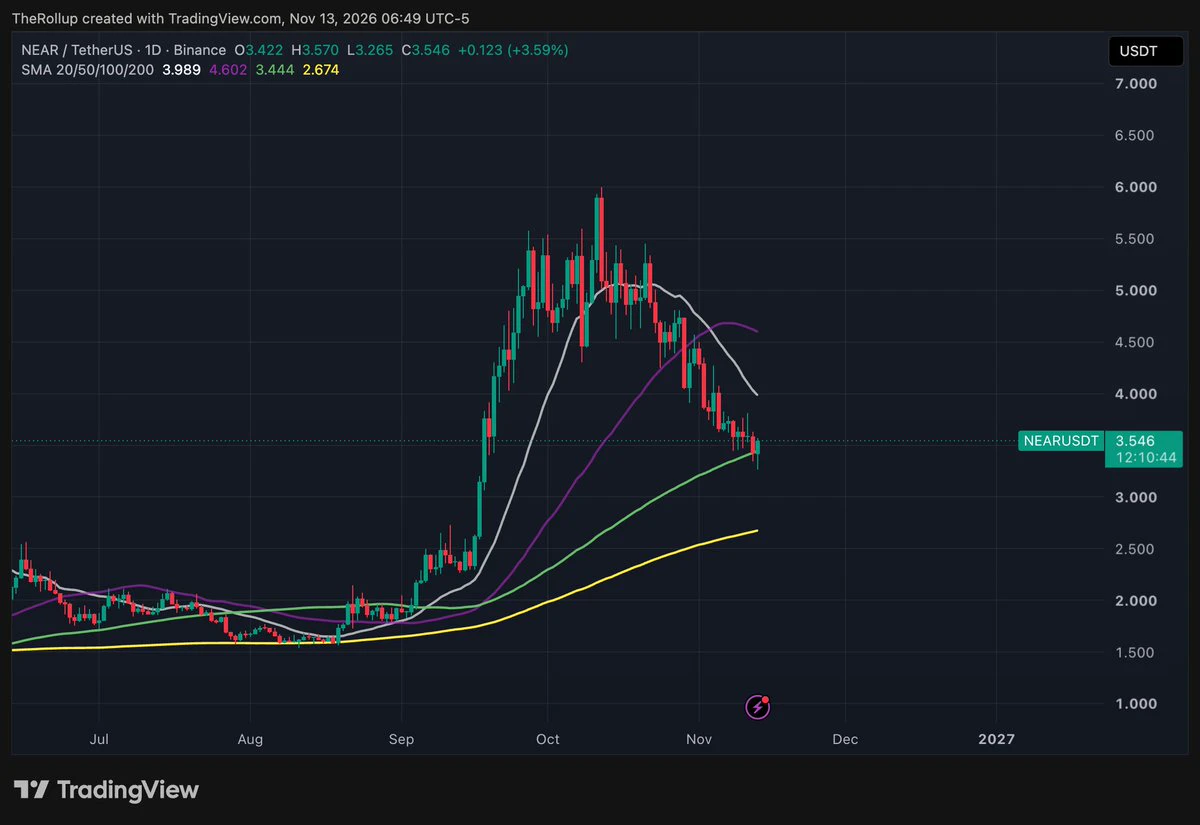
NEAR looks ready for a significant bounce here.
Local lows likely behind us. Filled some more.
$NEAR
post-image
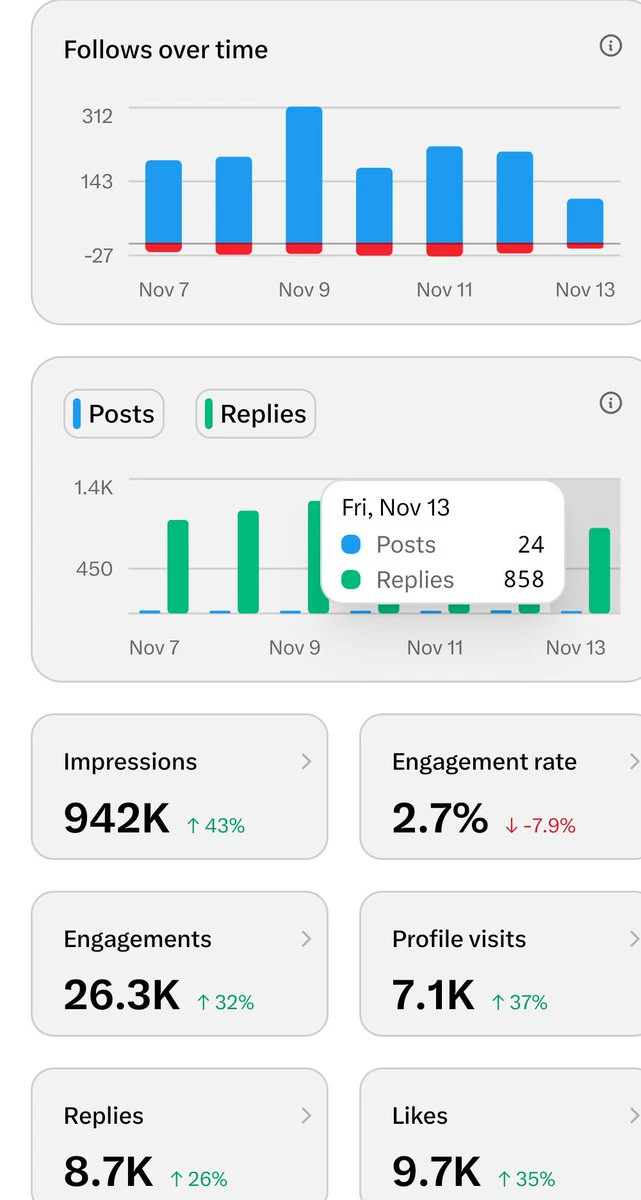
It’s midterm exam time.
How many comments are you guys up to?
Anyone slacking off?
post-image
Analysts: Bitcoin to Move Just 2.5% on Today’s CPI Data
The Daily Digits reports Bitcoin long liquidations of about $245 million on November 5 and $181 million on November 8. These forced closures of bullish Bitcoin positions total 3,183 BTC on November 5 and 2,450 BTC on November 8, and they are not totals for the entire crypto market.
A pre-release Bitcoin options analysis estimated a 2.5% move for a window containing the November 10 US inflation report. Its comparison of past and expected volatility did not establish whether buying protection was cheap. The study’s 2.5% CPI-window estimate
post-image
BTC-0.65%
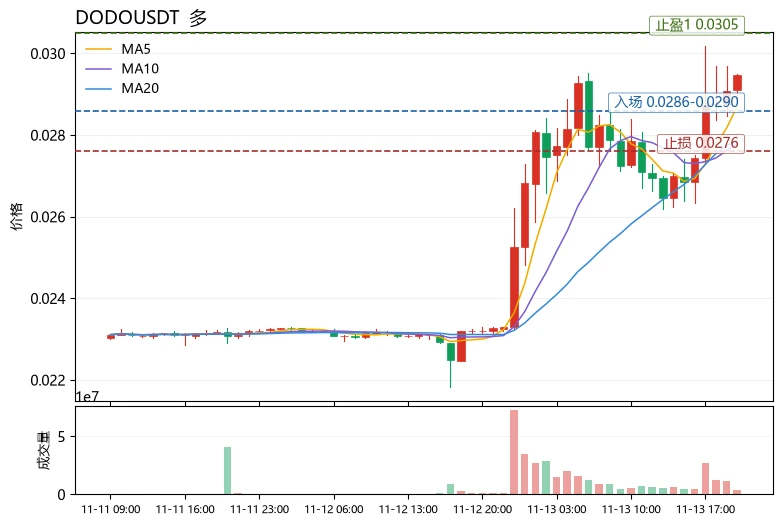
$DODO Current price 0.02948, 24h +27.07%, trading volume only 9.5M, 30-candle range 28.36%, RSI 69.5 nearing overbought, and price is already hugging the upper Bollinger Band at 0.02954; MA5 crossed above MA20, maintaining a bullish trend, and the MACD histogram at +7.02e-05 shows momentum has not faded. However, the Extreme Fear Index at 20 indicates this is a pulse driven by existing capital, not a trend-level move. Assessment: short-term bullish, but with limited upside; chasing the rally means becoming exit liquidity. Only buy pullbacks; don't chase green candles.
Position discipline come
post-image
SNDKB
SNDKBSNDKB
Four.meme
MC:$3.87KHolders:1
0%
DODO+11.43%
SUI-1.05%
#USJoblessClaimsBeatExpectations
Macroeconomic Deep Dive: US Initial Jobless Claims at 200K, Federal Reserve Policy, and the Outlook for Bitcoin and US Equities

Global financial markets are navigating an intricate crossroads defined by modest labor market softening, stubborn consumer price inflation, and shifting interest rate expectations from the Federal Reserve. Recent US economic releases—specifically weekly Initial Jobless Claims rising to 200,000 compared to market expectations of 194,000—have reignited intense debate across institutional desks and retail communities alike. While an up
Why does the price fall when trading volume suddenly surges?

In cryptocurrency trading, many people see BTC trading volume suddenly surge and assume there is heavy buying pressure in the market, meaning the price is likely to rise soon.

But the reality is often not that simple.

Sometimes, trading volume increases significantly, yet the price fails to rise and instead falls. What does this mean?

First, we need to understand a basic principle: every trade involves both a buyer and a seller. An increase in trading volume only means that market activity has picked up; it does not directly prov
post-image
BTC-0.67%
Can There Be Sharp Pullbacks in a Bull Market? How to Distinguish a Normal Correction from a Trend Reversal?

In the cryptocurrency market, many traders have experienced this: BTC rises steadily for a while, then suddenly drops sharply. Some think it is a normal correction and continue holding; others believe the bull market is over and rush to sell.

But how should you tell the difference?

First, observe the market structure. In a healthy uptrend, prices typically form progressively higher highs and higher lows. Even when a pullback occurs, as long as key lows are not decisively broken, the
post-image
BTC-0.67%
#JensenHuangResigns — End of an Era at Nvidia*

*BREAKING:* Jensen Huang has resigned as President, CEO, and Board Member of Nvidia, effective immediately on *Nov 12, 2026*, after 33 years leading the company he co-founded in 1993. a379

*What Happened:*
Nvidia confirmed CFO *Colette Kress* will serve as interim CEO while retaining her CFO role, and *Harvey C. Jones* has been appointed as the company's first-ever Chairman. The board will consider internal and external candidates for a permanent successor. a379

The resignation follows mounting scrutiny over reported extramarital relationships,
post-image
NVDA-4.49%
Which technical indicators are most useful? 3 core indicators to quickly identify BTC buy and sell signals

In cryptocurrency trading, many beginners like adding all kinds of technical indicators to their candlestick charts. RSI, MACD, moving averages, and Bollinger Bands—they don't want to miss a single one. But do more indicators really make it easier to profit?

In fact, the most important thing in technical analysis is not how many indicators you use, but understanding exactly what problem each indicator can help solve.

The first is the moving average (MA). It mainly helps identify market
post-image
BTC-0.67%
$ETH price has entered the buyer zone. In my view, this is an excellent opportunity to buy Ethereum, set a stop-loss below the low of the consolidation range, and benefit from solid profit potential. ETH ETHUSDT
post-image
ETH-1.26%
AI predictions are 80% accurate—why are you still losing money?

In cryptocurrency trading, many people see an AI model give an 80% probability of a price increase and assume it’s a high-probability trade.

But one easily overlooked point is that getting more predictions right doesn’t necessarily mean you’ll end up making a profit.

Suppose you make 10 trades, get 8 of them right, and earn $100 on each; you get the other 2 wrong and lose $500 on each. In the end, you’ve made $800 but lost $1,000, leaving your account down $200.

This is a mathematical issue that is often overlooked in trading.
post-image
How to Use Candlestick Patterns? 5 Common Signals to Help Determine When to Buy or Sell BTC

In cryptocurrency trading, many people look at candlestick charts every day, but few truly understand the market sentiment behind them.

Why does BTC rise rapidly after some candlestick patterns appear? Why does the price continue to fall after other patterns appear?

Today, we’ll introduce 5 common candlestick patterns.

First, the hammer. It usually appears in a downtrend, with a long lower wick and a relatively small body, indicating that some buying support emerged after the price fell and potentia
post-image
BTC-0.67%
📰🔥 TODAY IN HISTORY 🔥📰

📆 — NOVEMBER 13

🌎📜 EVENTS

⚔️ 1002 — King Æthelred II orders the massacre of Danish communities in England, an episode known as the St. Brice’s Day Massacre.

🚨 1887 — Bloody Sunday takes place in London. Demonstrators protesting poverty and unemployment are violently suppressed by police.

🚗 1927 — The Holland Tunnel opens, connecting Manhattan, New York, to New Jersey. It was the first road tunnel under the Hudson River.

⚓ 1942 — World War II: One of the fiercest clashes of the Naval Battle of Guadalcanal takes place between the naval forces of the United S
XRP-1.15%
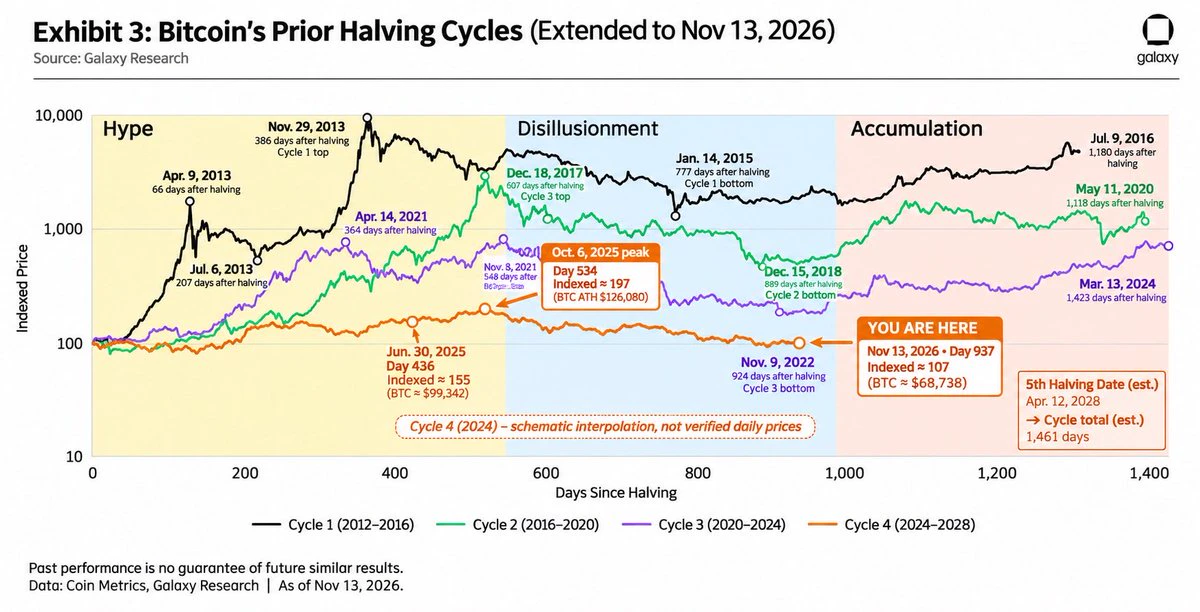
Bitcoin bottomed on day 924 of the 2020 halving cycle.
We’re now on day 937 of the 2024 cycle.
If history rhymes, the bottom might already be behind us, and we could be entering the accumulation phase.
Start DCA and stacking sats 👀
post-image
BTC-0.67%
SATS-1.00%
Load More

Join 40 M users in our growing community

⚡️ Join 40 M users in the crypto craze discussion

💬 Engage with your favorite top creators

👍 See what interests you

Trending Topics

JensenHuangResigns

518.2K Views8.2K Discussing

Jensen Huang has resigned as NVIDIA CEO and stepped down from the board. CFO Colette Kress will serve as interim CEO while NVIDIA considers internal and external successors. $NVDA fell more than 10% in premarket trading following the announcement. With one of AI’s most influential leaders stepping aside, markets are now reassessing NVIDIA’s leadership stability, AI strategy, and long-term valuation.

GateIPOAccessAnthropic

281.9K Views2.6K Discussing

Dr.HanOxfordUnionSpeech

144.8K Views475 Discussing

View More