Share your thoughts
placeholder
Article
PONS faltered near $1B cap on Robinhood Chain, topping out around $990M before a pullback; MEME and related meme names show caution as liquidity shifts between Robinhood Chain and Solana hype. $PONS $MEME
post-image
#Share My Holding Returns# Pons will keep rising or correct—nobody knows, but it's a surprise!!!
post-image
PONS-16.02%
#LAB is at an interesting point right now.
The chart is no longer in the explosive phase that took the token from cents to double-digit prices earlier this year. Instead, the market is trying to establish a new base after a brutal reset.
That makes the next move more important than the last one.
1. Where LAB Stands Now
The latest available market snapshot puts LAB around $0.071–$0.075, with 24h volume in the $2.7M+ range depending on the data source.
The immediate picture is still fragile: LAB is trading close to its recent low rather than near a major recovery high.
The recent 24h range repor
LAB-5.35%
  • 8
  • 2
Layout for Bitcoin, Ethereum, and Dogecoin
live-cover
LIVE3,818
  • 1
Touch grass after making good trades
It's good for your mental health and makes you trade better
Hope everyone had a good weekend 👍
post-image
$JUP Signal】Long + Order Book Support
$JUP The order book buy ratio is 1.16, with a depth imbalance of 7.3%. Current price: 0.271; the 1H rose and pulled back, while the 4H held above the Bollinger midline. Funding rate: 0.005%, OI stable.
🎯Direction: Long
⚡Entry/Limit Order: 0.27019 - 0.27100, market-price entry
🛑Stop-loss: 0.26829
🚀Target 1: 0.27507
🚀Target 2: 0.27710
🛡️Trade Management:
- Execution strategy: After reaching Target 1, reduce the position by 50% and move the stop-loss up to breakeven. If the price falls back to the entry price, exit automatically to protect the principal
post-image
JUP+18.22%
BTC-0.12%
ETH-0.14%
SOL+1.10%
9.7 BTC analysis.
Good morning, friends. The early bird gets the worm, and the weekend's light long position delivered the good news of 895 points.
BTC's early-morning price pierced the upper band before pulling back. Selling pressure outside the upper band was effective, limiting the breakout. Bulls and bears are locked in a stalemate around 80300. Unable to hold above the upper band, a return to the middle band is the most basic Bollinger Bands move. When this kind of “lightning rod” pattern appears at a high level, combined with resistance from the upper band, the probability of a pullback
post-image
BTC-0.12%
I had just switched the software to the background, and it shot right back up—are you playing hide-and-seek with me? When I opened the charts this morning, I thought this move was completely dead, but it actually made me wait for the key level.

I was watching $BTW retest 0.377246. The key level held, and buying pressure strengthened. I said directly that this level was worth trying—don't wait until it pumps to start shouting about chasing the entry.

And now? 0.449271, +190.28%. Feels good, brothers. It was truly sluggish before, but the move feels great once it finally breaks out. This pr
post-image
BTW+0.10%
LAB-5.35%
SNDK+0.29%
Robinhood Meme Carnival: 3 USDT on Your First Trade, Up to 8,000 USDT in Rewards https://www.gate.com/campaigns/6131?ref=UFRFAQ0M&ref_type=132
post-image
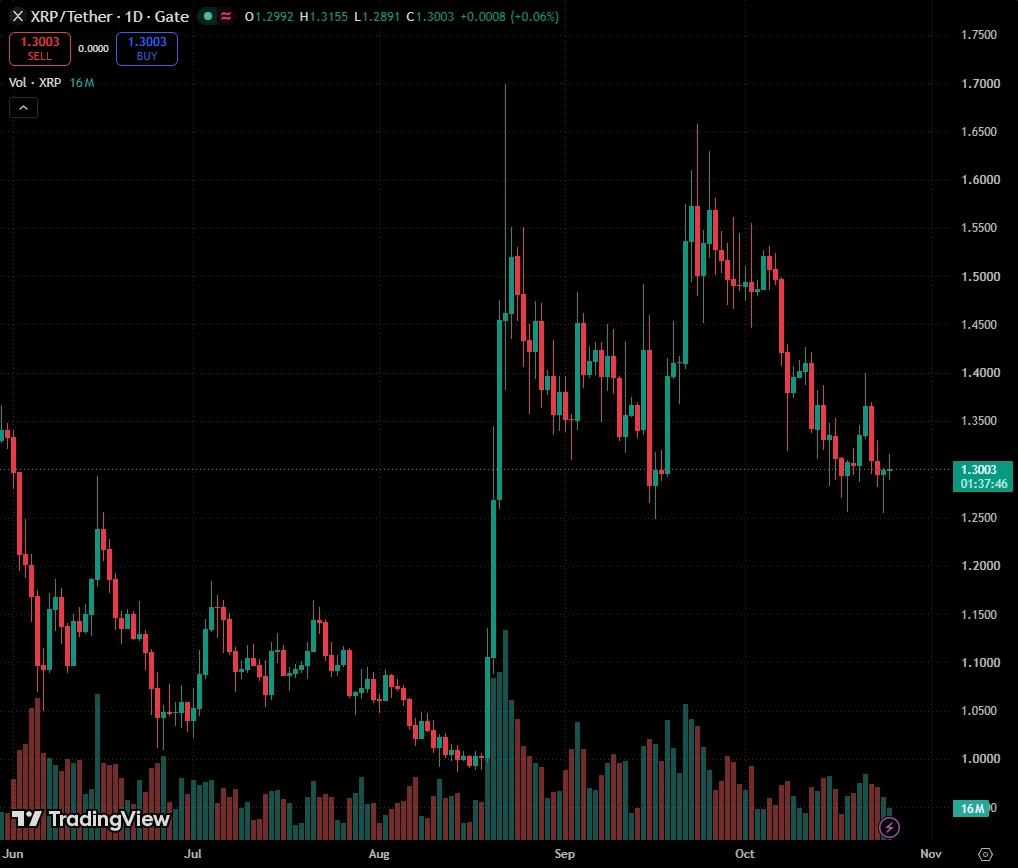
Everyone’s long XRP at 1.42—but the 4H just whispered a secret the crowd missed.

$XRP /USDT - SHORT

Trade Plan:
Entry: 1.4166 – 1.4212
SL: 1.4412
TP1: 1.4022
TP2: 1.3910
TP3: 1.3743

Why this setup?
Why now? The 1D is range-bound, yet the 4H bias flipped SHORT at 1.4189 with 55% confidence. RSI on 15m (55) shows no bullish fuel, and ATR (0.0093) is too tight for a breakout—it’s a squeeze, not a surge. If we lose 1.4166, the path to 1.3910 (TP2) opens fast. The alt scenario (long) is dead unless we reclaim 1.4212 with volume—which the data says is a trap.

Debate:
Are you fading this rang
XRP-0.97%
The “three-stripe yoga pants” you love $LULU
Lululemon’s stock price has plunged this time, so I’ll briefly share my view:
In the past, people were willing to pay so much for a pair of Lulu yoga pants because they weren’t just buying pants, but the “brand halo.”
But the market is starting to change.
Alo and Vuori are constantly taking customers, North American comparable-store sales have plunged 12%, and Lulu has even started discounting frequently.
Most importantly, the financial report makes it look like the gross margin is still a beautiful 60.5%.
But after looking more closely, $130 mill
post-image
LULU-17.39%
$NAORIS Signal】Long-side snipe: Critical breakout under a 1H death cross
$NAORIS RSI(14) surged to 80.82, while the 4H Bollinger upper band at 0.0410 is exerting close overhead pressure. The 1H MACD has formed a death cross, order-book depth imbalance is 8.27%, and the bid-to-ask depth ratio is 1.18, with bids below not yet collapsing. The current price of 0.03915 is within the recommended entry range, OI is stable, the funding rate is 0.005%, and there are no signs of overheating.
🎯Direction: Long
⚡Entry/Limit order: 0.0390325 - 0.0391500
🛑Stop-loss: 0.0387585
🚀Target 1: 0.0397373
🚀Targe
post-image
NAORIS+22.01%
BTC-0.12%
ETH-0.14%
SOL+1.10%
A dip with a wick occurred this morning, and I noticed the long opportunity as soon as that lower shadow appeared. The price then gradually stabilized, which served as another validation of my judgment. After entering, the market did not develop a particularly rapid trend and mainly maintained a stair-step rise. This pace is actually more reliable than a sharp rally, because every upward move includes a key level where positions change hands.

My buy orders were completed within the long-entry range. I then observed that the positions in the market had not loosened noticeably, so I remained r
post-image
BTC-0.11%
ZEC+10.71%
The value of the small group continues to rise,
The barrier to entry is currently low.
Just watching this mfing chart go up only while I’m sidelined waiting for a dip 😭
Sent from my Pumpfun App
post-image
ETH thesis perfectly validated
Price pulled back to the 2430‑2470 support zone, bottomed out and stabilized on the hourly chart, and the second target of 2520 was successfully reached.
The four-hour Bollinger Bands have narrowed, and the indicators are undergoing a high-level correction. This is merely a technical pullback during the uptrend, while the broader upward structure remains intact. #美国8月非农超预期 $BTC $ETH
BTC-0.11%
ETH-0.15%
$DOOD 24 rose 28% over 24 hours, but I’m betting it will return below 0.0016 tomorrow. I’ve put 500U on the line here—I’ll own the loss.
Don’t rush to criticize—look at the data: the 55M trading volume looks lively, but the high of 0.0020 failed to hold, a classic pump-and-dump script. At 0.0019, there’s no support above and no floor below—just bulls and bears stabbing at each other.
My plan: don’t enter at the current price of 0.0019; wait for a pullback to 0.0016 to buy, with a stop-loss at 0.0014 (a breakdown means the move was a fakeout), and take-profit initially at 0.0023. I’ll allocate
DOOD+29.30%
Guys, where's the top? Should we still short? #ZEC市值超越DOGE
post-image
ZEC+10.71%
DOGE-0.83%
You’re not watching $MARSCOIN /USDT—you’re watching a 4-hour trap set for late longs.

$MARSCOIN /USDT - SHORT

Trade Plan:
Entry: N/A – N/A
SL: N/A
TP1: N/A
TP2: N/A
TP3: N/A

Why this setup?
- RSI on 15m is crushed at 28.13—oversold, but that’s a *speed bump*, not a floor.
- 1D trend is a range, yet our 4h bias flips SHORT at 0.16172 with 55% conviction.
- Why now? Price is stalling under range resistance—weak bounce fuel, not reversal ammo.
- No TP levels armed yet—this is a sniper entry, not a spray-and-pray.

Debate:
If the 15m RSI is this hot, do you fade the dead-cat bounce or
MARSCOIN-34.55%
Load More

Join 40 M users in our growing community

⚡️ Join 40 M users in the crypto craze discussion

💬 Engage with your favorite top creators

👍 See what interests you

View More