


Square
Following
Hot
News
Profile
Share your thoughts
placeholder
Article
Gm ,grinders
May our day be productive 🤲
post-image
BREAKING: MASSIVE RALLY IN INDIAN MARKET.
#Sensex is 1600 point up, above up 2.15% and Nifty is up 1.97%.
Reasons:
1. Oil crashed hard. WTI fell from above $100 to below $90. India imports most of its oil, so lower prices ease inflation and support the rupee.
2. US midterms. Democrats won both chambers. Markets are pricing in less risk of sudden tariff hikes and trade shocks.
3. FIIs are turning buyers again after months of selling. Falling oil and hopes of possible tax relief on capital gains are helping sentiment.
4. Strong earnings and festive demand are adding to the upside.
This is not fi
Trenches
ZIG
Z
bade
b
ZIG
0x8c...1145
Market Cap
$.
Change
.
24h Vol
$.
Holders
.
BTC
B
bade
b
BTC
C5xp...pump
Market Cap
$.
Change
.
24h Vol
$.
Holders
.
HIGH
H
bade
b
HIGH
7ymF...high
Market Cap
$.
Change
.
24h Vol
$.
Holders
.
STONK
S
bade
b
STONK
6GmA...UNgx
Market Cap
$.
Change
.
24h Vol
$.
Holders
.
LEEROY
L
bade
b
LEEROY
98HE...pump
Market Cap
$.
Change
.
24h Vol
$.
Holders
.
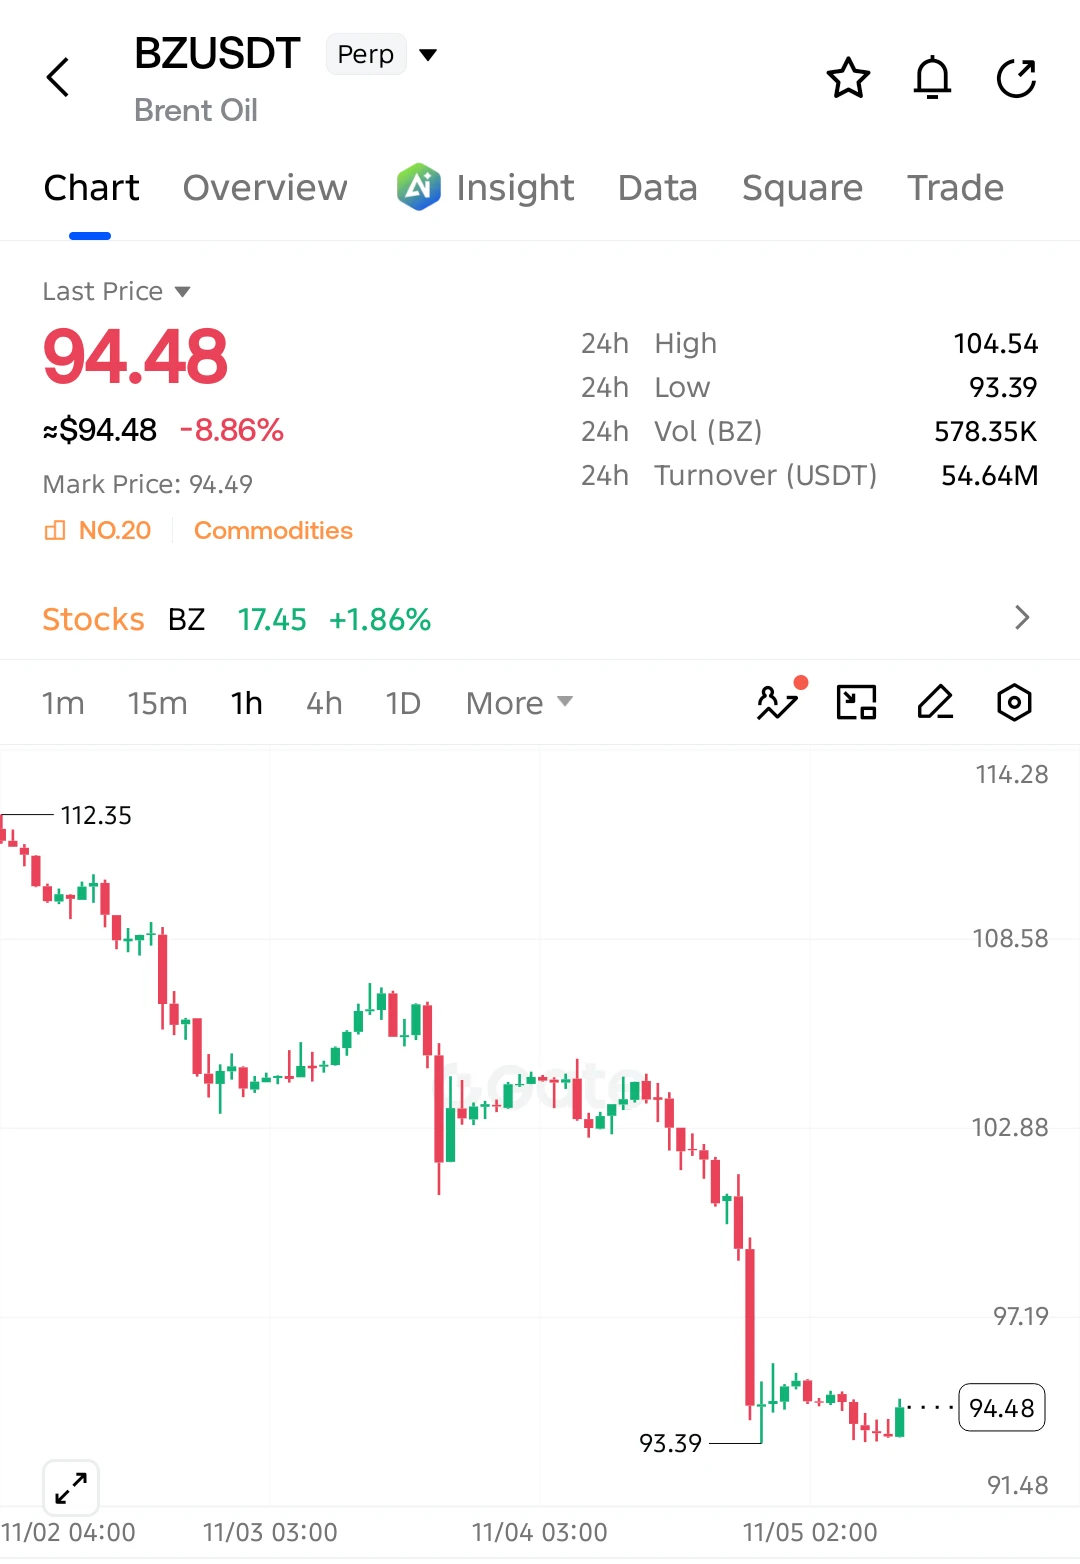
$BZ BEARS ARE CRUSHING THE MARKET!
Brent Oil has plunged 8.86%, and sellers remain firmly in control. Price is struggling near 93.39 support after a massive breakdown.
SHORT SETUP
Entry: 94.48
SL: 96.20
TP1: 93.39
TP2: 92.00
TP3: 90.50
Final Target: 88.00
The chart shows a clear bearish structure with consecutive lower highs and strong selling pressure. A breakdown below 93.39 could accelerate the decline toward 90.50 and potentially 88.00.
Invalidation: A sustained recovery above 96.20 weakens the bearish setup.
post-image
BZ-1.18%
  • 2
  • 1
Thrusday Trades with Crypto Sat
live-cover
LIVE1,447
ZEC 1-hour timeframe: After rising along the upper Bollinger Band, the price pulled back slightly and is now holding above the middle band. The Bollinger Bands are gradually narrowing, signaling a short-term consolidation structure. The TTMU long/short indicator favors bulls, and net capital inflows continue, keeping bullish momentum intact. The previous rally tested the area around 1352 and met resistance, making this a key short-term barrier. The middle Bollinger Band below provides strong support; holding above it on a pullback would keep the bullish structure intact. A high-volume break ab
post-image
BTC-0.67%
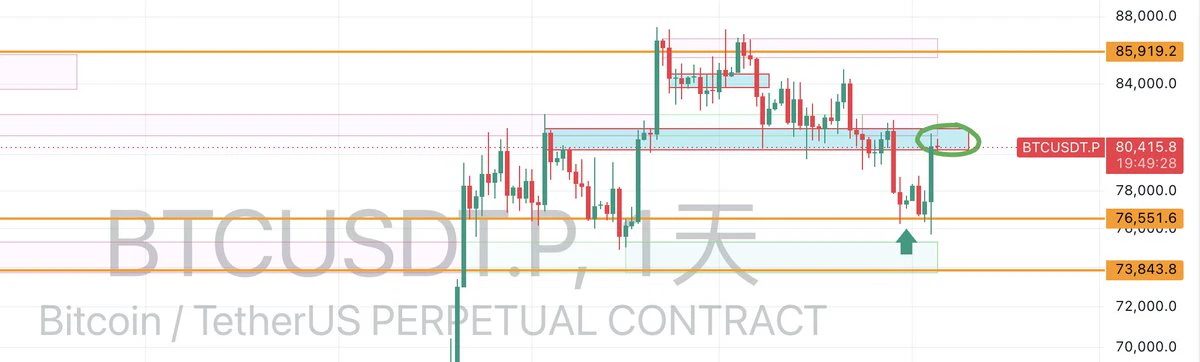
Broad Market Analysis: $BTC (2026-11-5)
The market surged on a daily basis yesterday, and safe-haven assets were all rising. It’s very simple to assess what happens next in this situation!
Yesterday’s sharp rise was driven by news. If market capital accepts the price increase at this level, it will continue flowing in without much outflow, and prices will resume climbing after consolidating at a high.
If a gradual daily decline begins, slowly erasing the previous candle’s gains, that means little capital is coming in and the market still lacks sufficient buying demand.
post-image
BTC-0.67%
👋 Market volatility is back | Your exclusive bot comeback gift is ready
🎁 Sign up to receive 20 USDT in popular bot trial funds
✅ The more you trade, the higher your rewards:
• ≥ 500 USDT → +20 USDT
• ≥ 5,000 USDT → +50 USDT
• ≥ 20,000 USDT → +100 USDT
⚡ Use Gate Futures Grid Trading for $HYPE to capture opportunities amid hot-token volatility👉 https://gate.onelink.me/7pdk/e5aa916c221d01ab

BotsOfficial
👋 Market volatility is back | Your exclusive bot comeback gift is ready
🎁 Sign up to receive 20 USDT in popular bot trial funds
✅ The more you trade, the higher your rewards:
• ≥ 500 USDT → +20 USDT
• ≥ 5,000 USDT → +50 USDT
• ≥ 20,000 USDT → +100 USDT
⚡ Use Gate Futures Grid Trading for $HYPE to capture opportunities amid hot-token volatility👉 https://gate.onelink.me/7pdk/e5aa916c221d01ab
repost-content-media
HYPE+0.33%
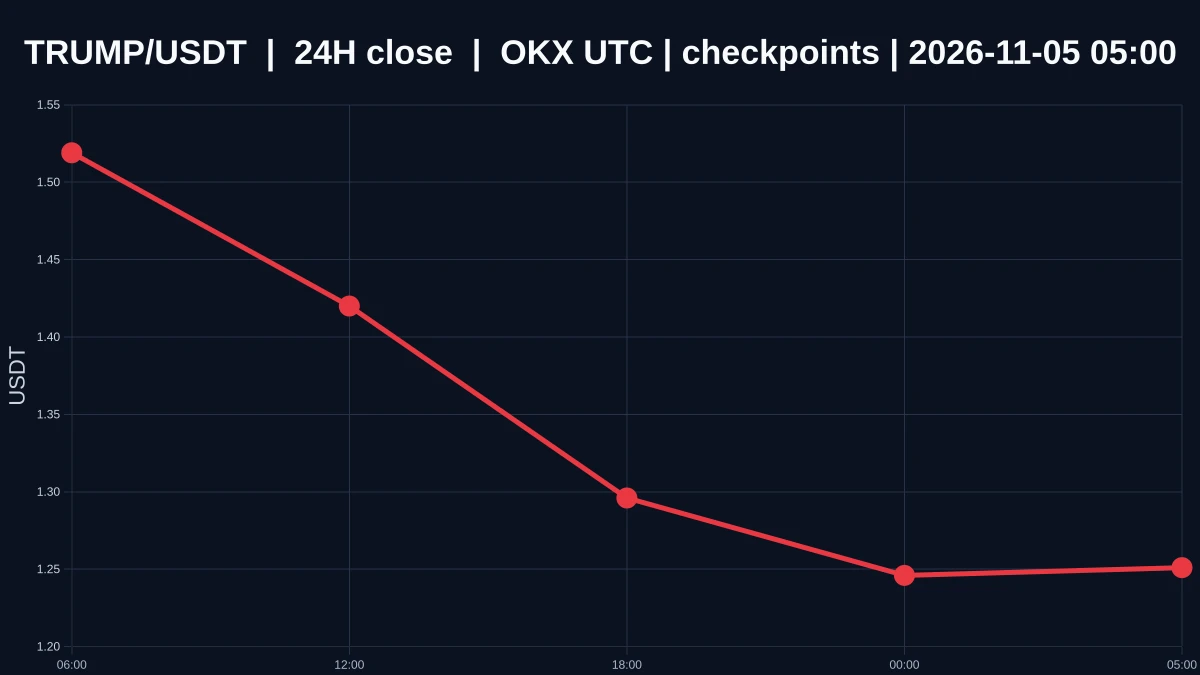
$TRUMP : Oversold vs. Bottoming—The Difference Isn’t the Size of the Drop
$TRUMP is currently priced at 1.25, down 17.65480895915679% over 24 hours, with an intraday high of 1.538 and a low of 1.218. The 1-hour and 4-hour trends are both weak, and the 1-hour volume ratio is just 0.017747325714257734. The price has fallen from 1.538 to around 1.218—a deep enough drop for oversold conditions to start emerging, with demand for a rebound building. But oversold describes exhausted momentum; it does not confirm a reversal. Until the structure stops weakening, I won’t call oversold conditions a bottom
post-image
TRUMP-0.95%
Over the past few days, I went through my computer from top to bottom and did a security check while I was at it.
I used to think I was just an ordinary user, and no one would target me. But then I realized that many attacks are like casting a wide net—they don't care whether you're a whale or a small fish.
Even if your wallet only has 100U, it's worth taking some time to check. Clear out plugins you don't use, don't click unfamiliar links, and enable all the verification options you can. No matter how much or how little money you have, losing it would hurt.
‍#Gate安全卫士免费开通
post-image
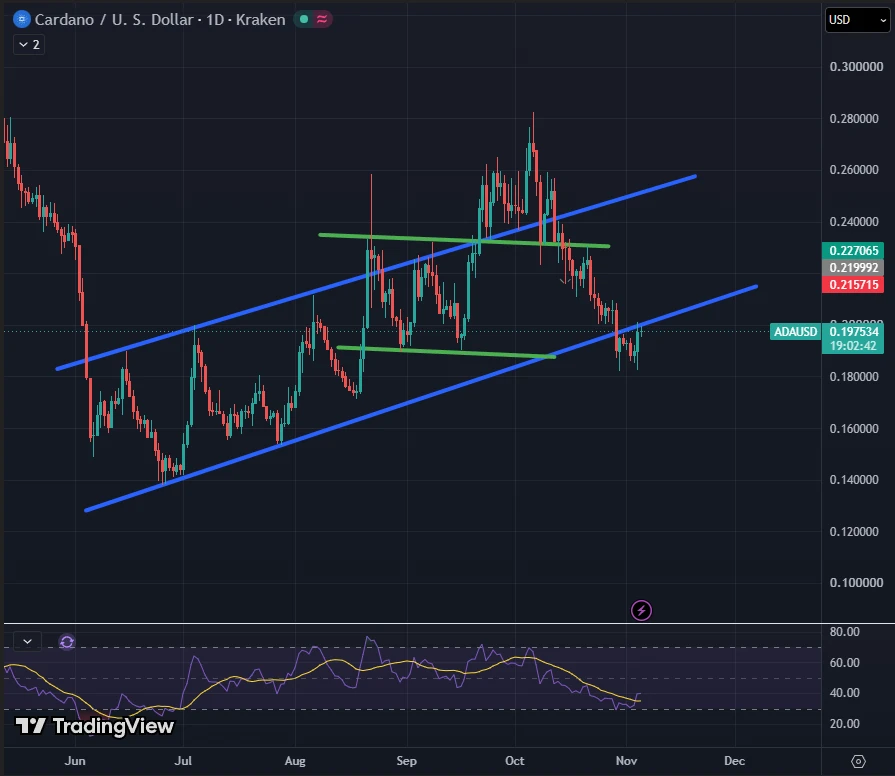
If $ADA can get back into the ascending channel, we could see a push to the $0.25 area.
post-image
ADA-1.48%
(new streamer)market update
live-cover
LIVE1,377
$ETH
U.S. employment suddenly rebounds?
ADP adds 86,000 jobs
Rate-cut expectations are about to be thrown into disarray again
Damn
Guys
The U.S. labor market has once again delivered a report card that somewhat surprised the market
The latest ADP data shows
The U.S. private sector added 86,000 jobs in October
Significantly above market expectations of 69,000
And unchanged from the revised 86,000 in September
What does this mean?
Simply put,
U.S. companies are still hiring
And have maintained a solid hiring pace for two consecutive months
But the interesting thing about this data
Isn't just th
post-image
ETH-1.23%
📊 Nonfarm countdown: ADP beats expectations, but is the market even more conflicted?
U.S. ADP employment rose by 86k in October, above market expectations. The official nonfarm payrolls report is due tomorrow night at 21:30 (UTC+8).👀
Strong employment is usually good news, but for the trading market, things may not be so simple.
📈 If the data beats expectations: economic resilience strengthens, but will pressure on the Fed to raise rates also increase?
📉 If the data falls short of expectations: it could ease rate pressure, but will the market instead worry about an economic slowdown?
Will
post-image
BTC-0.67%
GLDX-0.40%
PAXG+0.37%
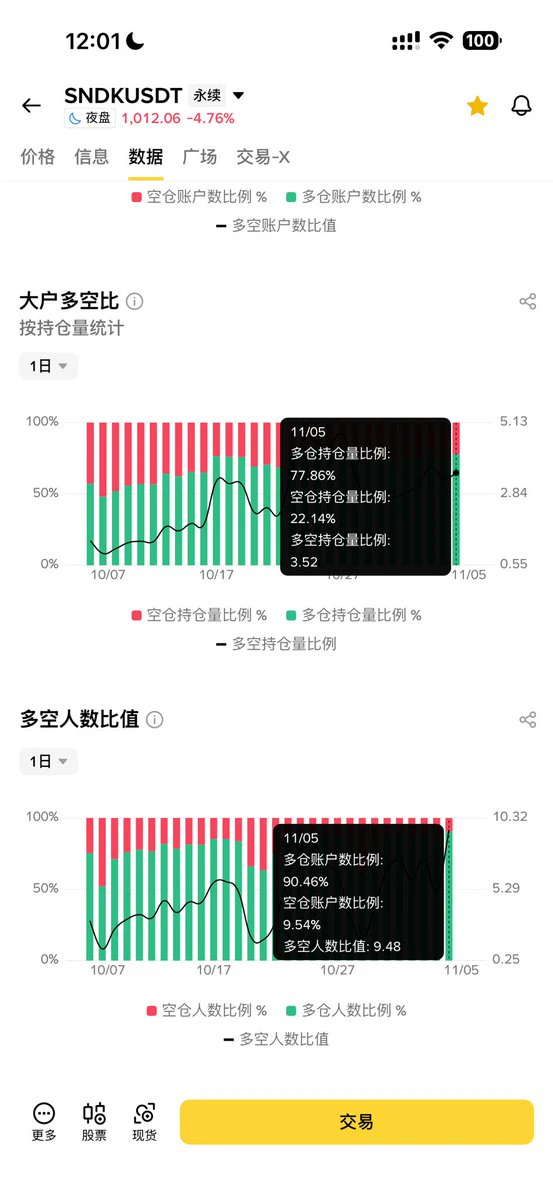
This is the current long-short ratio in the U.S. stock storage sector: nearly 10:1, with everyone without exception buying the dip. Funding rates have been above 0.05% every day. The most beautiful story, and the most people trapped.
post-image
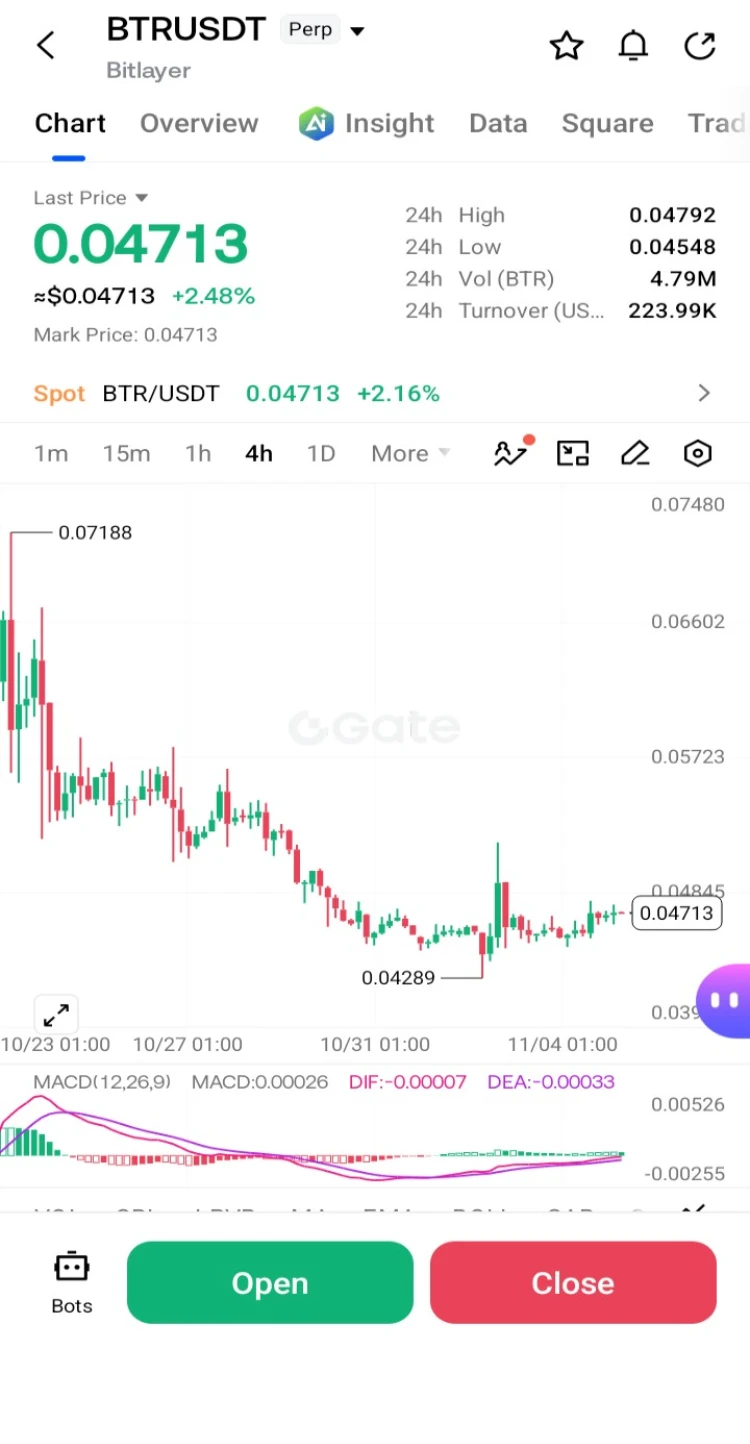
$BTR /USDT | Sellers Still Have the Upper Hand?
BTR is showing signs of weakness, with both daily and 4H market structures leaning bearish. I'm watching for another move lower, but I don't want to ignore the short-term buying pressure.
Potential Short Zone: 0.0473788 – 0.0475212
Profit Levels:
- TP1: 0.0463904
- TP2: 0.0456840
- TP3: 0.0446244
Invalidation: 0.0488628
The price remains under the EMA50 and EMA200, which keeps the broader outlook under pressure. However, the 1H RSI near 59.5 suggests buyers haven't completely stepped aside.
I'd rather wait for sellers to show some strength before
post-image
BTR+1.43%
  • 3
  • 1
Tether can't leave Bitrue over NEAR anymore; the exchange just shut USDT withdrawals on that network. Most pauses like this are routine maintenance, but $USDT bound for a NEAR wallet is stuck there for now.
USDT+0.00%
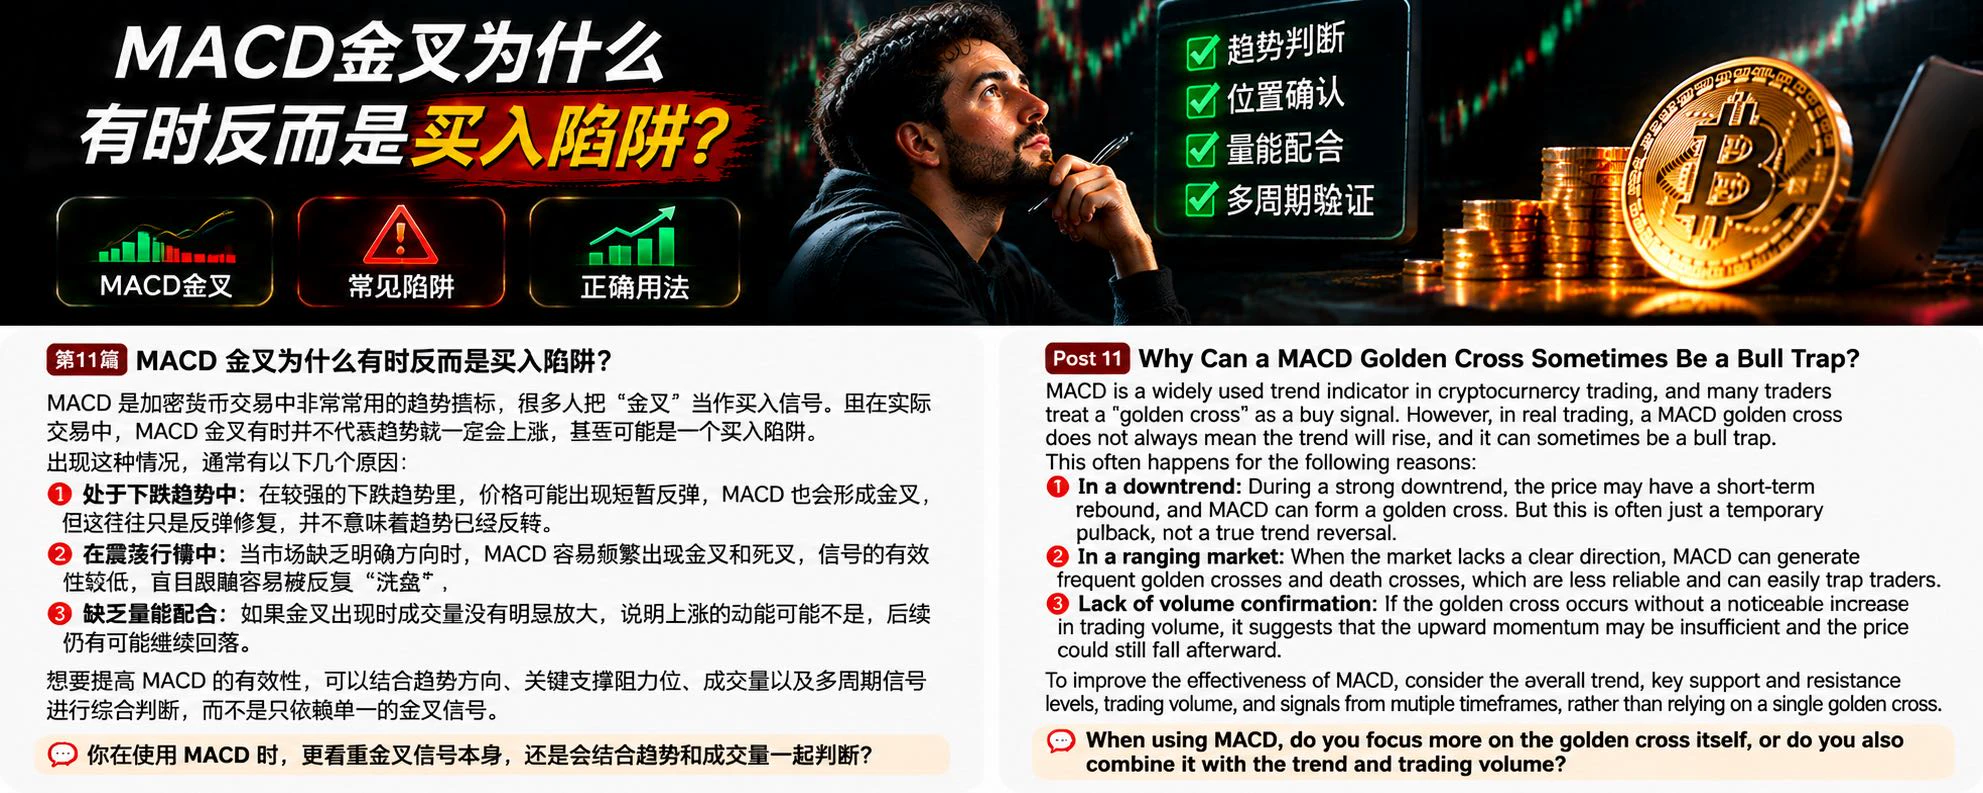
MACD is a commonly used trend indicator in cryptocurrency trading, and many people treat a golden cross as a buy signal. But in actual trading, a MACD golden cross does not always mean the trend will rise, and may even be a buying trap.
This usually happens for the following reasons:
First, the market is in a downtrend. During a strong downtrend, prices may see a brief rebound, and MACD may also form a golden cross, but this is often just a corrective bounce and does not mean the trend has reversed.
Second, the market is moving sideways. When the market lacks a clear direction, MACD can produc
post-image
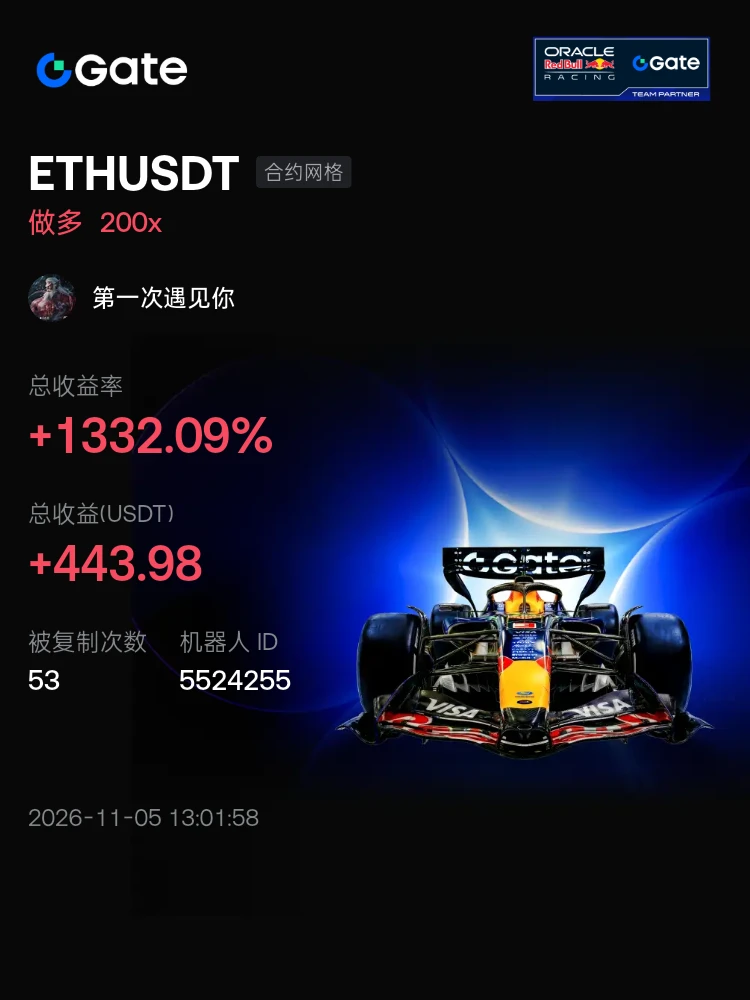
#交易机器人 I'm using the ETHUSDT contract grid bot on Gate—join me and copy my trades
post-image
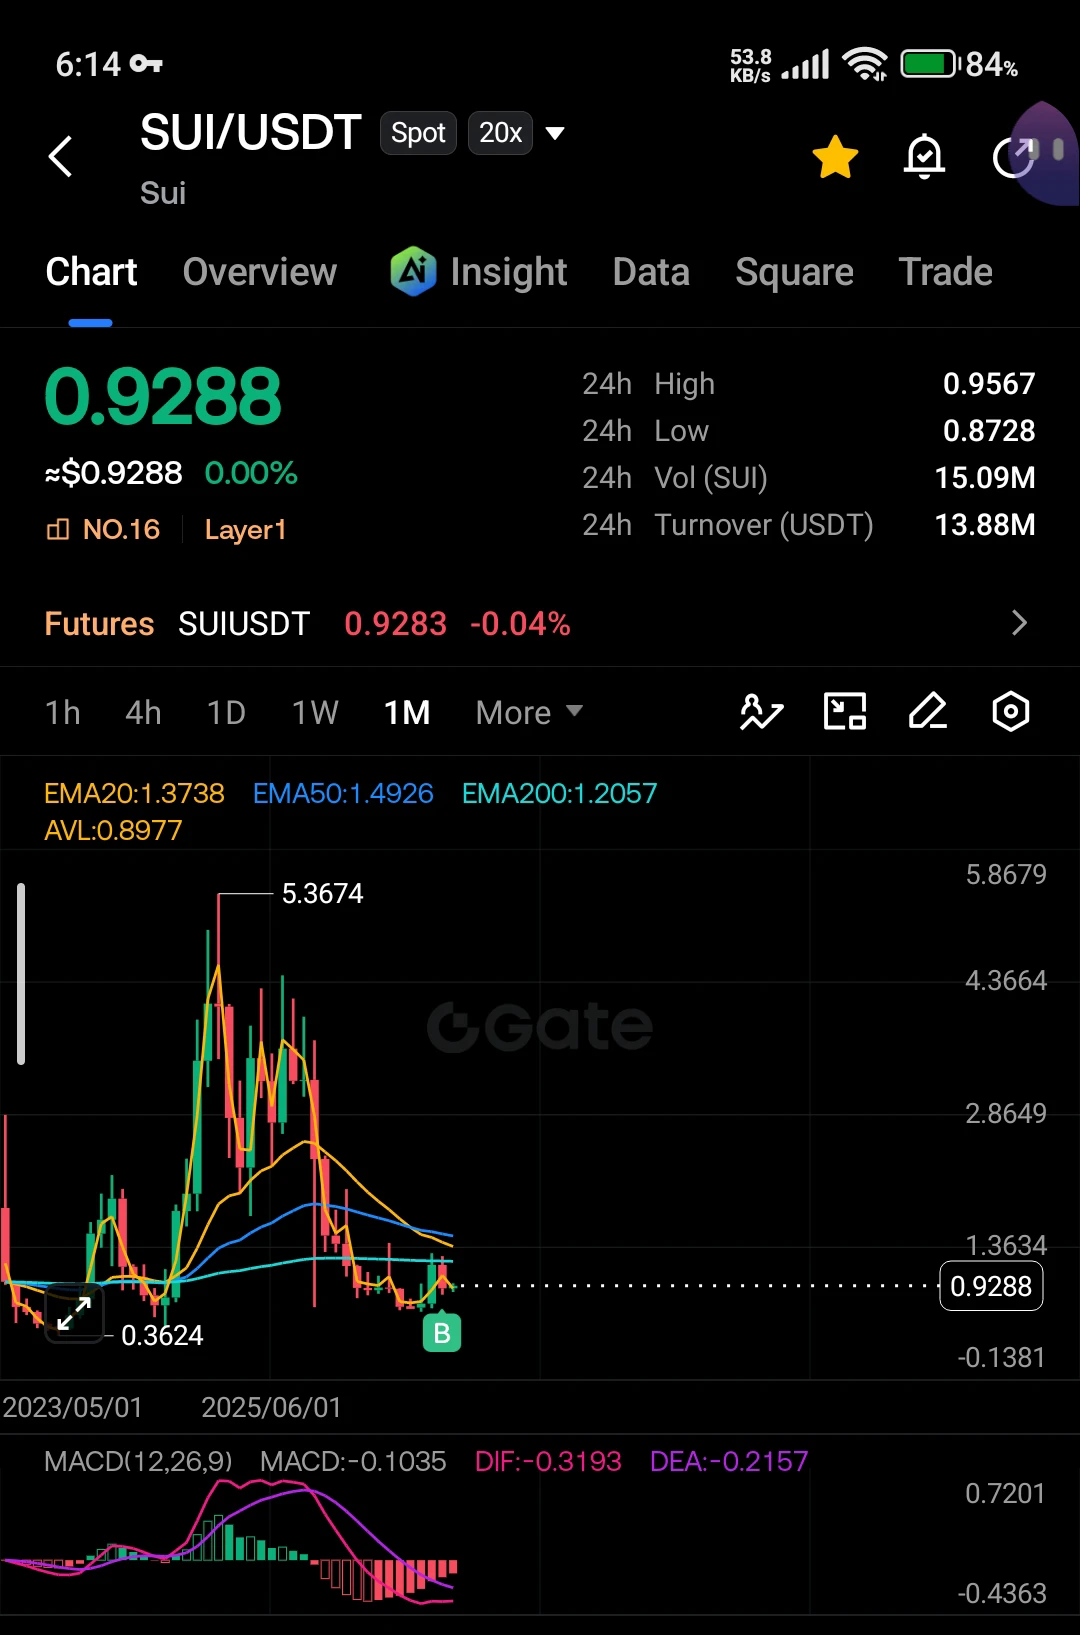
$SUI is a strong fundamental project.
Don't miss it.
Buy and hold, or put it in a bot until the market kicks off again.
NB: No more than 5% of your portfolio per coin.
Remember, patience pays off. ‌
post-image
SUI-1.05%
🎁 Gate 2026 Year-End Community Gala | Major Annual Prizes Up for Grabs
🏆 Annual Streamer × Annual Creator: Compete across two tracks for the year’s top honors!
🥇 TOP 1: DJI Osmo Pocket 4
🥈 TOP 2–3: AirPods Pro 3
🥉 TOP 4–6: HONOR AI Projector
🔥 TOP 20 in every track in the Chinese-speaking region will receive rewards! Racing and GT goodies keep coming!
⏰ Registration deadline: November 10 (UTC+8)
🚀 Sign up now and go for the annual grand prize!
👉 https://www.gate.com/announcements/article/102561
‍#GateLive #GateSquare
GateLiveChinese
🎁 Gate 2026 Year-End Community Gala | Major Annual Prizes Up for Grabs
🏆 Annual Streamer × Annual Creator: Compete across two tracks for the year’s top honors!
🥇 TOP 1: DJI Osmo Pocket 4
🥈 TOP 2–3: AirPods Pro 3
🥉 TOP 4–6: HONOR AI Projector
🔥 TOP 20 in every track in the Chinese-speaking region will receive rewards! Racing and GT goodies keep coming!
⏰ Registration deadline: November 10 (UTC+8)
🚀 Sign up now and go for the annual grand prize!
👉 https://www.gate.com/announcements/article/102561
‍#GateLive #GateSquare
repost-content-media
Load More

Join 40 M users in our growing community

⚡️ Join 40 M users in the crypto craze discussion

💬 Engage with your favorite top creators

👍 See what interests you

Trending Topics

BTCBackAbove80K

28.32k Views41.2k Discussing

After a sharp dip, Bitcoin climbed back above $80,000 on May 9 and is currently trading around $80,200. Over 50,000 traders were liquidated in the past 24 hours amid fierce long-short battles. The recurring Iran-U.S. tensions remain the primary short-term variable. Following U.S. airstrikes, Iran\'s Revolutionary Guard claimed to have breached the Strait of Hormuz defense line, leaving the ceasefire outlook uncertain. On the technical side, the daily SMA20 ,$77,970 serves as key support, with the RSI recovering from oversold levels to 43. The $80,000 level is both a psychological barrier and a bull-bear dividing line.Holding above it could lead to a challenge at $85,000, while a break may trigger a retest of the $77,000 area.

DemocratsWinBothChambers

17.63k Views445 Discussing

GateLaunchesTaiwanStockTrading

14.77k Views310 Discussing

View More