Share your thoughts
placeholder
Article
Everyone’s chasing the 15m RSI pop—I’m watching $SOXL /USDT bleed from 123.64 instead.

$SOXL /USDT - SHORT

Trade Plan:
Entry: 123.43 – 123.85
SL: 125.64
TP1: 122.14
TP2: 121.14
TP3: 119.64

Why this setup?
- 4h bias says SHORT, but the 1D trend is just *range*—no breakout fuel.
- RSI(15m) at 71.58 is overheated; mean reversion pulls price back to the 1h ATR floor (0.834).
- Entry zone 123.43–123.85 sits right under resistance. Why now? Because TP1 at 122.14 is only a 1.2% drop—but TP2 at 121.14 gives us 2% with momentum fading.
- Stop at 125.64 is tight—risk/reward is 1:2.3 if you r
post-image
SOXL+6.52%
$FLOCK Signal】Long on 1H pullback support + signs of a short squeeze from negative funding
$FLOCK Buy/sell depth 3.86, with the price at 0.07193 above the 1H Bollinger middle band. The 4H MACD histogram narrowed to 0.0019, while the 1H histogram weakened to -0.0009. The price has not broken the previous low, showing a clear price-volume divergence. Funding rate is -0.0598%, with shorts paying to hold positions; OI remains stable with no signs of exits.
🎯Direction: Long
⚡Entry/limit order: 0.0717142 - 0.0719300
🛑Stop-loss: 0.0712107
🚀Target 1: 0.0730090
🚀Target 2: 0.0735484
🛡️Trade manage
post-image
FLOCK+40.31%
BTC-0.15%
ETH+0.63%
SOL+2.17%
This long trade was actually quite uncomfortable. Right after entering, I got hit by a fake breakout wick, which nearly took out my stop-loss at a key level. I didn’t cut the position at the key level because volume had not expanded; instead, it looked more like a shakeout. The market then saw a series of small bullish candles, with the battle between bulls and bears quickly shifting in favor of the bulls. When the price reached around 87.793, I took profit on 70% of the position and moved the stop-loss on the remaining position above breakeven. The profit is currently at +519.96%, and the rem
post-image
ETH+0.67%
SOL+2.21%
MARSCOIN’s 4h signal just flipped SHORT at 0.18439—but the daily range says otherwise. Who’s lying?

$MARSCOIN /USDT - SHORT

Trade Plan:
Entry: N/A – N/A
SL: N/A
TP1: N/A
TP2: N/A
TP3: N/A

Why this setup?
- RSI (15m) at 43.28: No oversold bounce yet—momentum is still leaking downward.
- Daily trend is “range,” not downtrend—so this is a scalp, not a swing.
- Confidence 55.4 is lukewarm: The edge is timing, not conviction.
- Why now? Price is mid-range with weak buying pressure—shorts get paid when range-bound traders panic.

Debate:
Is 0.18439 the fake breakdown before a squeeze, o
MARSCOIN-25.27%
BAT pump pump bigpump ath go
post-image
BAT+2.33%
BIGPUMP-0.31%
I had just sent the app to the background, and it popped right back up—is it playing hide-and-seek with me?
A few days ago, before bed, I was watching $SUI . The price stayed around 0.7362 and failed to break out all day. The key level held, and volume remained subdued, so I told myself: there’s no need to scare myself at a level like this.
I opened a long at 0.7362. The entry was quiet, and it only took an hour or two for things to start moving. Now the bullish move has kicked in, with the current price already at 0.7985 and unrealized profit at +407.82%. It was truly sluggish before, but the
post-image
SUI-1.57%
LAB-3.18%
ZEC+19.08%
#RedBullTradingTourSeason6
Red Bull Trading Tour Season 6 is bringing a powerful combination of trading, competition, education, and community engagement to the crypto space. Trading is no longer only about watching charts and placing orders. Today, successful traders need discipline, market awareness, risk management, and the ability to make decisions under pressure. Events like the Red Bull Trading Tour create an environment where traders can learn, compete, and share their market experiences.
What Makes Season 6 Interesting?
Season 6 represents another step in building a stronger trading c
BTC-0.15%
ETH+0.63%
  • 1
  • 1
🚨 $JUP SURGES +19% THEN GETS REJECTED Watch This Pullback
📊 $JUP /USDT
📈 Direction: LONG
⚡ Leverage: 7x
🎯 Entry Zone: 0.2550 – 0.2670
🎯 Take Profit Targets:
TP1: 0.28325 +43%
TP2: 0.3050 +93%
TP3: 0.3300 +148%
🛑 Stop Loss: 0.2350
$JUP ‌#Gate60MillionUsers
post-image
JUP+21.42%
  • 7
  • 2
Good news on employment, but wages aren’t hot—the data alone won’t decide whether the Fed hikes in September
Nonfarm payrolls beat expectations by 3x, sending the probability of a September rate hike from 51% to 62%. But on closer inspection, things aren’t that simple.
The most subtle point is the “mismatch”—good employment news, but wages aren’t hot. Average hourly earnings rose just 3.1% year-on-year, the slowest pace since the COVID-19 pandemic, and have already fallen behind inflation. What is the Fed’s purpose in hiking rates? Inflation. If wages aren’t rising, where would cost-push infla
NVDA+0.87%
Bitcoin’s long-term trend still looks bullish.
But $440K? That’s a massive move.
If adoption, liquidity, and institutional demand keep growing, could $BTC eventually get there? 👀
The real question is: how high can Bitcoin go this cycle?
post-image
BTC-0.15%
Everyone’s staring at ADA’s 4H chart—but the range is a lie.

$ADA /USDT - SHORT

Trade Plan:
Entry: 0.2186 – 0.2198
SL: 0.2248
TP1: 0.2150
TP2: 0.2122
TP3: 0.2080

Why this setup?
Why now? The 1D trend says “range,” yet the 4H signal is SHORT with 55.4 confidence. RSI (15m) is neutral at 51, but ATR (1h) is thin—0.0023—meaning the breakout is coiling. Entry at 0.2192 (low 0.2186) targets 0.2150, then 0.2122. If 0.2130 breaks, the short thesis dies. This is a low-liquidity squeeze zone, not a trend.

Debate:
Is 0.2130 the fakeout floor, or are we about to see ADA dump to 0.2080 before the
ADA-0.68%
#BTCReclaims80K
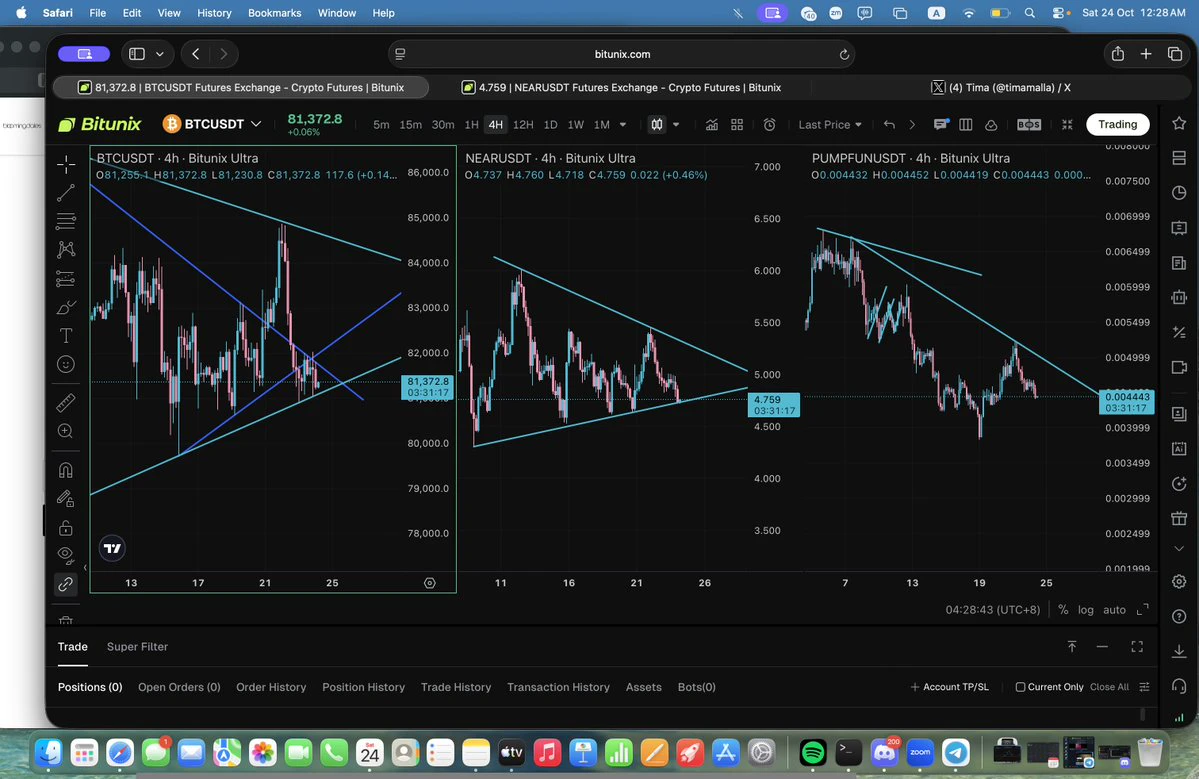
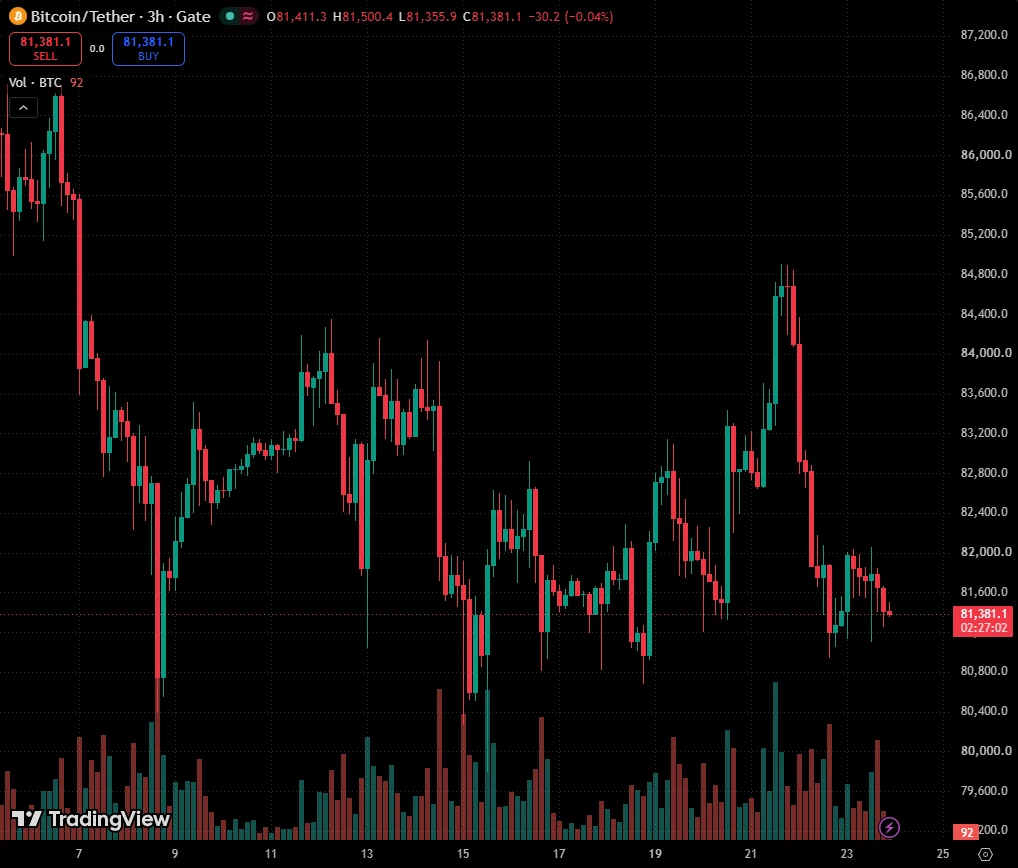
#BTC ‌The $80K Battle Is Getting Interesting
Bitcoin is trading around $79,950, with the current session holding a relatively tight range between roughly $79.5K and $80.1K. After the recent recovery from the June lows, BTC has managed to return to the $80K area, but the real question now is whether buyers can turn this level into support rather than another temporary resistance zone.
The broader structure is constructive, but it is not risk-free.
One of the strongest factors supporting BTC right now is institutional demand. U.S. spot Bitcoin ETFs recorded approximately $730.8
post-image
BTC-0.15%
No operation, no analysis, just sheer luck—this result is embarrassing enough to say out loud. Just kidding. 😂 Right after seeing the bearish news, I watched $ICP climb back to around 2.963, and quite a few people thought a reversal was coming. But I took a glance at the trading volume: the rebound was pathetically weak, with layers of sell orders piling up—classic fake action. When it failed to push higher again, I went straight in without the slightest hesitation.

The market has now slipped to 2.677, with the position showing +464.83% and the account dancing on its own. The position manag
post-image
ICP+2.18%
BNB-3.75%
ETH+0.67%
A surprised $319m airdrop is coming to Solana users all over the world.
Stay updated for the day it'll happen and be active.
Generational wealth is here!
SOL+2.17%
$1000CAT 24 hours plunged 24%, falling straight from 0.0029 to 0.0021, with $19.9 million in trading volume—meaning it’s not that nobody is buying; everyone who did got buried. BTC has no direction today either, the Fed is turning hawkish again, and risk assets are all shaking, so it’s normal for an altcoin cat to get no love in conditions like this. But let me tell you, the more blood in the streets, the more you should watch those that refuse to die.
Let’s look at the data first: $1000CAT saw declining volume at 0.0021, and the profit-taking from the previous move up to 0.0029 has basically
BTC-0.15%
MEME-3.34%
Everyone’s watching gold, but you’re blind if you missed $XAU /USDT’s 4h trap door.

$XAU /USDT - SHORT

Trade Plan:
Entry: 4432.35 – 4434.39
SL: 4443.13
TP1: 4426.05
TP2: 4421.17
TP3: 4413.84

Why this setup?
Why now? The 1D trend is *range*, yet the 4h signal just armed SHORT with 55% confidence. RSI on the 15m is crushed at 38.81—momentum is fading fast. Price is pinned at 4433.37, squeezing between entry support and a 4.06 ATR that’s begging for a 10-point drop. TP1 at 4426 is the first crack; TP3 at 4413 is the floor if sellers commit. This isn’t a gamble—it’s a low-risk slide with inv
XAU-0.20%
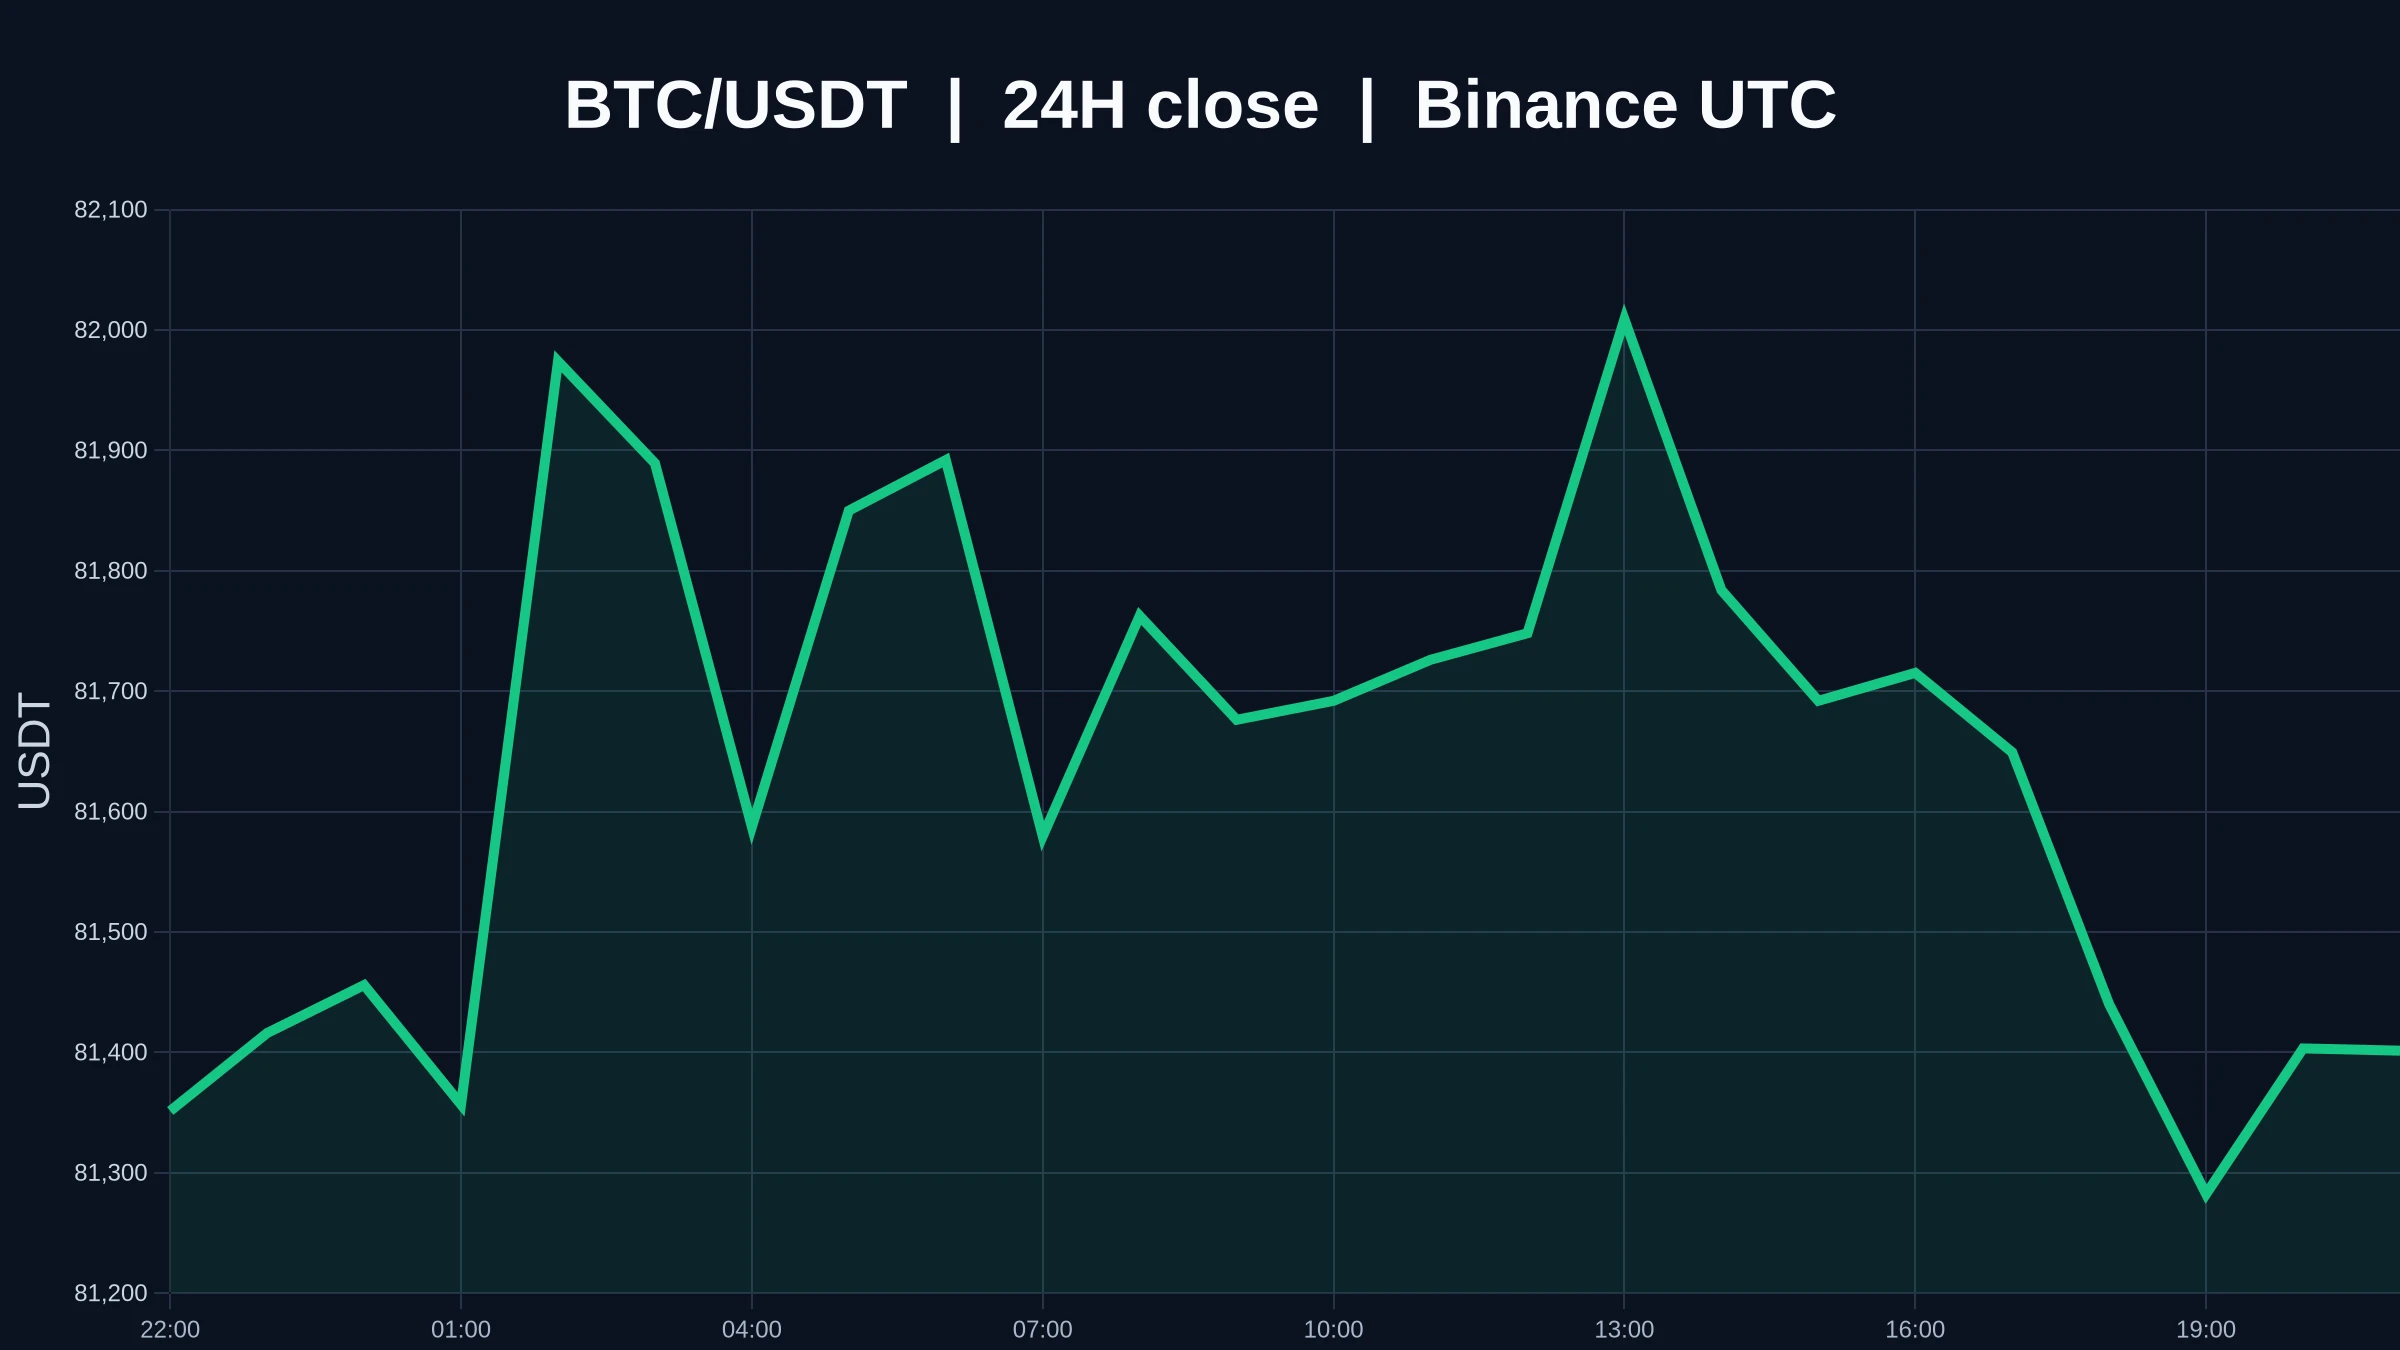
No trades, no analysis, just pure luck. Even I feel embarrassed saying this result out loud. I opened the chart this morning and saw that the $BTC long position was already up +388.56%, with the current price at 79709.8 and the entry price at 77967.8. The numbers were right there—everything looked pleasing.

Looking back at this trade: while everyone else was still watching from the sidelines, the market had not fully started moving, but buyers stepped in every time it pulled back to a key level. My judgment was that the key level had held and the short-term direction was bullish, so I entere
post-image
BTC-0.12%
ADA-0.68%
ZEC+19.08%
Dollar Weakness Meets Stronger Risk Appetite! Could BTC & ETH Continue Higher?
live-cover
LIVE392
When the candlestick that broke below the key range appeared, I didn’t hesitate and directly added another short position. The previous several false rebounds had already built up a large amount of trapped overhead supply, making a direct reversal difficult with this structure.
Before adding to the position, my initial short entry was around 0.028294. After I entered, the market drifted lower for a while, giving me decent unrealized profits. As the rebound midway through the decline grew progressively weaker, I took profits in stages as the price approached the key level, leaving my core posit
post-image
FLORK-23.76%
XRP-0.60%
SOL+2.21%
Load More

Join 40 M users in our growing community

⚡️ Join 40 M users in the crypto craze discussion

💬 Engage with your favorite top creators

👍 See what interests you

View More