Square
Following
Hot
News
Notifications
Profile
Share your thoughts
placeholder
Article
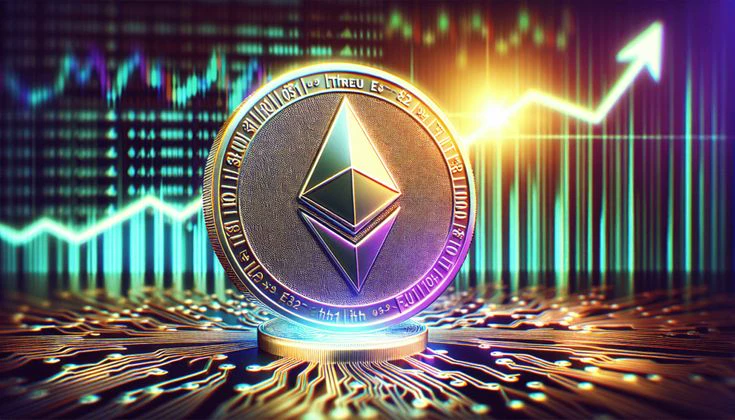
𝗘𝗧𝗛𝗘𝗥𝗘𝗨𝗠 ⚡ | 𝗣𝗥𝗜𝗖𝗘 𝗦𝗧𝗔𝗕𝗜𝗟𝗜𝗭𝗘𝗦 𝗡𝗘𝗔𝗥 $𝟮,𝟮𝟯𝟳

💰 Price: $2,236.92
₿ BTC Value: 0.02953 BTC

📊 Market Performance

- 1H Change: +0.24%
- 24H Change: +0.07%
- 7D Change: -0.70%

🏦 Market Cap: $273.34B
📈 24H Volume: $3.89B

Supply Details

- Circulating Supply: 122.19M ETH
- Total Supply: 122.19M ETH

Ethereum is showing slight positive movement over the past 24 hours, but its weekly performance remains marginally negative.

Trading activity remains important to watch. $ETH needs stronger buying momentum to establish a clearer recovery trend.

For now, the market i
post-image
ETH-0.91%
Buying the dip has already brought me to tears. Promise me, don’t cry so easily.
post-image
Trenches
ZIG
Z
bade
b
ZIG
0x8c...1145
Market Cap
$.
Change
.
24h Vol
$.
Holders
.
STONK
S
bade
b
STONK
6GmA...UNgx
Market Cap
$.
Change
.
24h Vol
$.
Holders
.
IDOL
I
bade
b
IDOL
0x3b...ab07
Market Cap
$.
Change
.
24h Vol
$.
Holders
.
BTC
B
bade
b
BTC
C5xp...pump
Market Cap
$.
Change
.
24h Vol
$.
Holders
.
FLOAT
F
bade
b
FLOAT
Bv1a...BMmr
Market Cap
$.
Change
.
24h Vol
$.
Holders
.
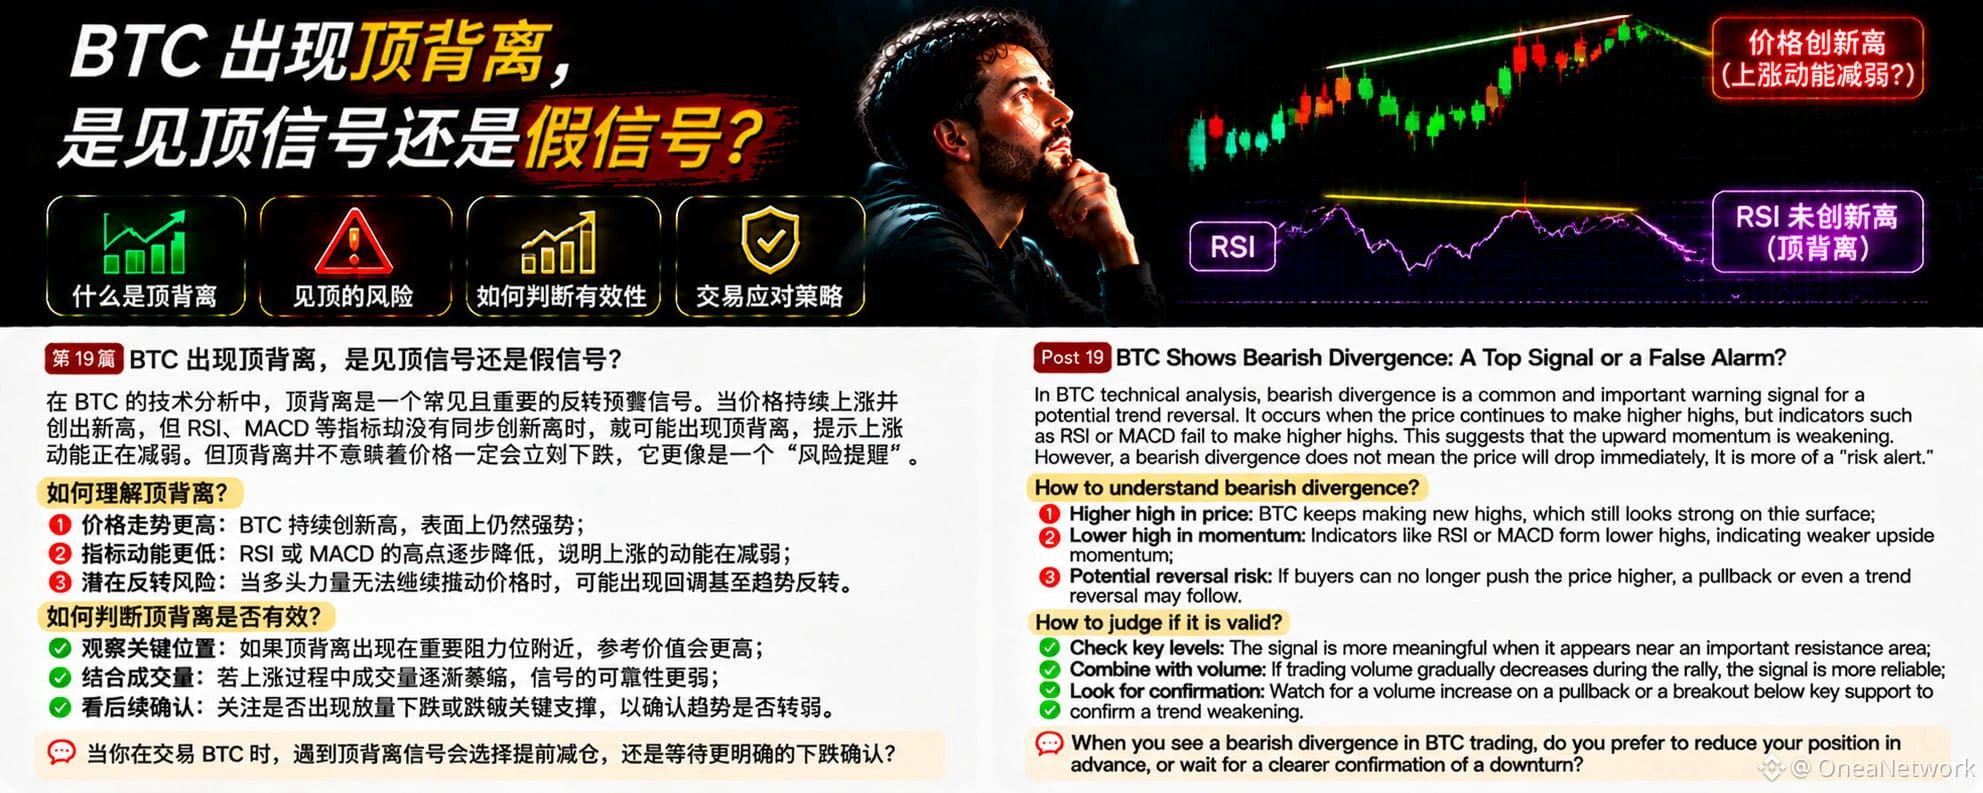
In BTC technical analysis, bearish divergence is a risk warning signal worth watching. Many traders see prices continually making new highs and assume the uptrend remains strong. But if prices continue to rise while indicators such as RSI or MACD fail to make new highs, bearish divergence may occur.
What is bearish divergence?
Simply put, it is when the price makes a higher high, but the technical indicator forms a lower high. This suggests that although the price is still rising, the momentum driving the rise may be weakening.
Why is bearish divergence worth watching?
First, upward momentum m
post-image
BTC-0.67%
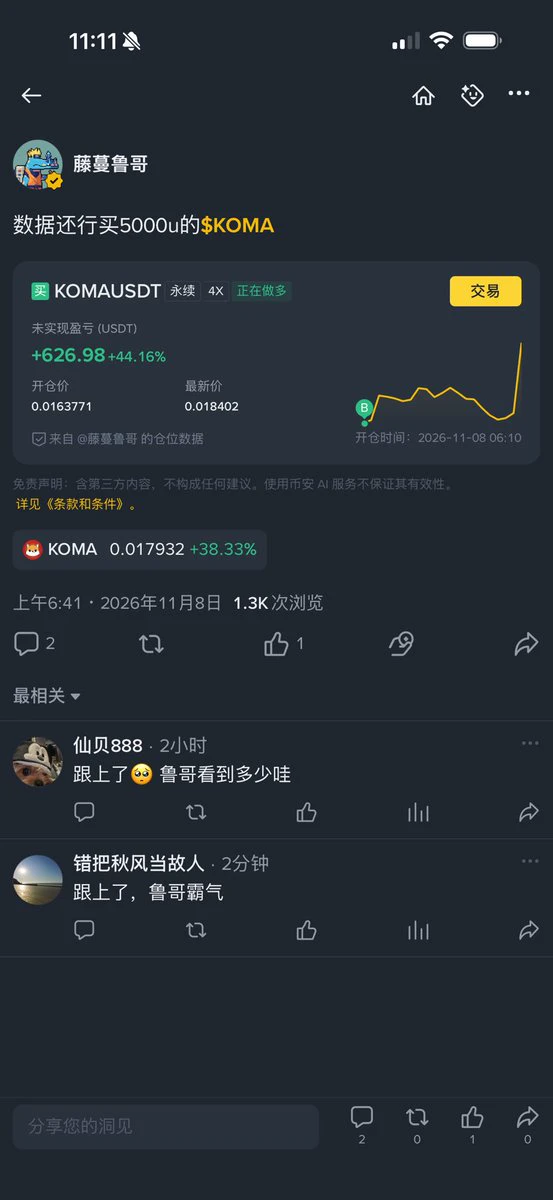
Couldn't sleep this morning, so I bought 5000u worth of $koma to play with
post-image
KOMA-3.91%
Everything has a spirit!
Treat it kindly.
post-image
Funds from sanctioned (platforms) cannot get in, and this has caused quite a stir lately. Double-check before transferring money, then proceed ✅
post-image
$DUSK Now aggressively shorting, then buying at $-0.02551; short entry price 0.07062 $DUSK 👇
post-image
DUSK+5.54%
#StakeOnLaunchpoolToShare450KVLX Yield Optimization Protocol: Allocating Capital to the 450,000 VLX Staking Pool

The structural mechanics of wealth preservation during periods of high macroeconomic volatility require a disciplined shift toward non-directional, cash-flow-generating asset classes. As global equity indices navigate intense valuation resets and data-center sector adjustments, maximizing the capital efficiency of idle digital assets becomes a primary operational mandate. Recognizing this need, the official deployment of the Velas (VLX) Launchpool initiative introduces a high-viabi
VLX+0.00%
  • 5
  • 1
Taking it easy and watching the market this weekend
Last week’s pace was great, and today I’m adjusting ake and ain while continuing to hold long positions. Waiting for an opportunity in Ethereum
post-image
AKE+6.39%
AIN+3.35%
ETH-1.26%
  • 2
#USCPIDataIncoming #ShareWeekly
America’s most closely watched inflation report is just around the corner. The Bureau of Labor Statistics is scheduled to release the Consumer Price Index (CPI) for October 2026 on Tuesday, November 10, 2026, at 8:30 a.m. Eastern Time. This is not just another data point. It is one of the primary inputs the Federal Reserve uses to decide the future path of interest rates, and financial markets from Bitcoin to the S&P 500 to gold and crude oil will react within seconds of the numbers hitting the wire.

What CPI Actually Measures
The Consumer Price Index tracks t
New stream Bitcoin ETFs See $412 Million in Net Outflows, with BlackRock IBIT Seeing $403 Million
live-cover
LIVE1,147
*Men settle where there's peace, women bring peace where they are treated well. It takes effort of both side*📷📷📷
🔹 Bitcoin ETFs See $412 Million in Net Outflows, with BlackRock IBIT Seeing $403 Million in Net Ou
live-cover
LIVE624
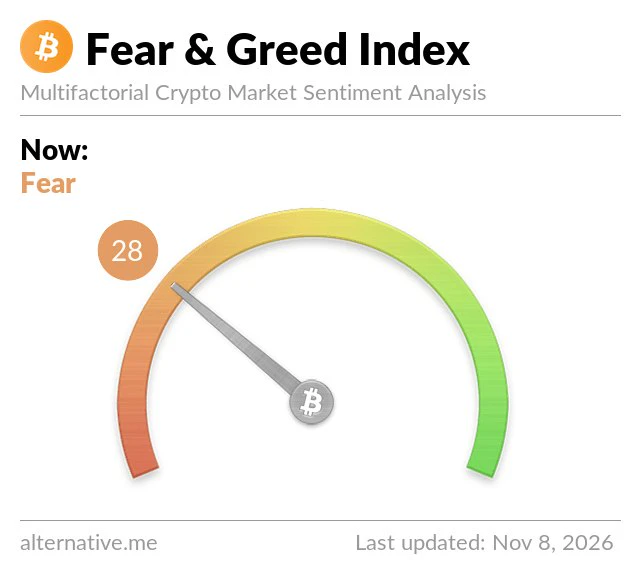
𝗖𝗥𝗬𝗣𝗧𝗢 𝗠𝗔𝗥𝗞𝗘𝗧 𝗦𝗘𝗡𝗧𝗜𝗠𝗘𝗡𝗧 𝗧𝗨𝗥𝗡𝗦 𝗙𝗘𝗔𝗥𝗙𝗨𝗟 📉
The Crypto Fear & Greed Index is at 28, signaling Fear across the market.
💰 BTC Price: $75,874
📊 Fear & Greed Index: 28
😱 Market Sentiment: Fear
Fear is dominating sentiment as Bitcoin trades near $75.8K. Stay cautious and watch for signs of a market recovery.
#ShareWeekly #BTCETFOutflowsContinue
post-image
BTC-0.67%
$PONS Early entrants in this project have already cashed out tens of millions. With a market cap of over a billion, they’re still aggressively pushing perpetual contracts—it’s clearly a setup to harvest traders, and there’s more dumping ahead.

90-day trading report +$1,499.75+66.05%PONS-13.14%
Risk warning: The above is solely my personal opinion and does not constitute investment advice. Contract trading carries extremely high risks; please participate with caution.
post-image
PONS+4.41%
#Ahr999跌入抄底区间 Ahr999 is a commonly used valuation indicator in the Bitcoin community, introduced in 2018 by Jiu Shen, who goes by the online handle “ahr999.” It is also called the “Jiu Shen Index.” It is used to judge whether the current price is expensive or cheap.
Formula: (current price ÷ 200-day DCA cost) × (current price ÷ exponential growth valuation).
200-day DCA cost: the average cost of buying a fixed amount each day over the past 200 days, calculated using the geometric mean.
Exponential growth valuation: the long-term theoretical price fitted to the number of days since Bitcoin’s cr
BTC-0.67%
  • 6
  • 1
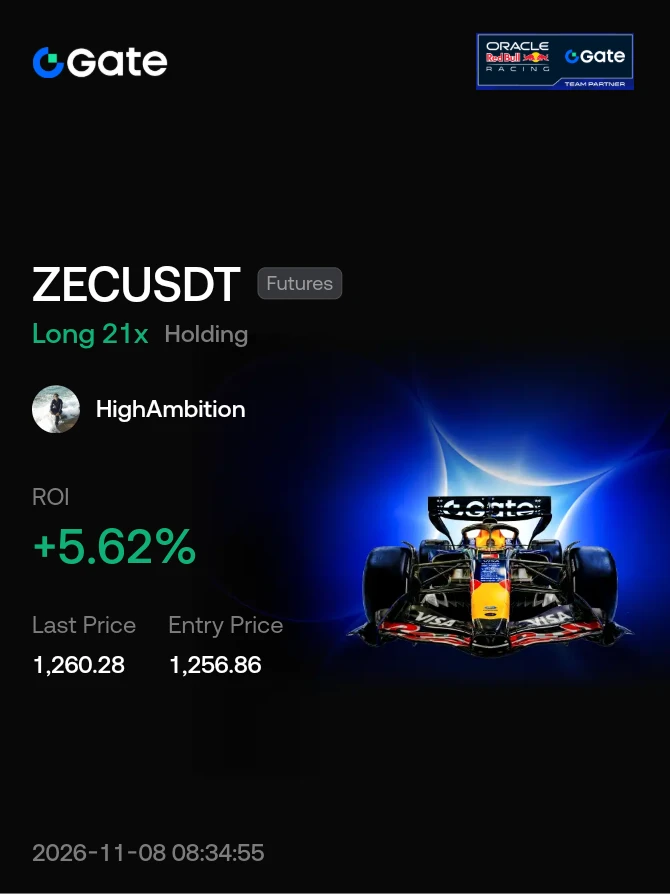
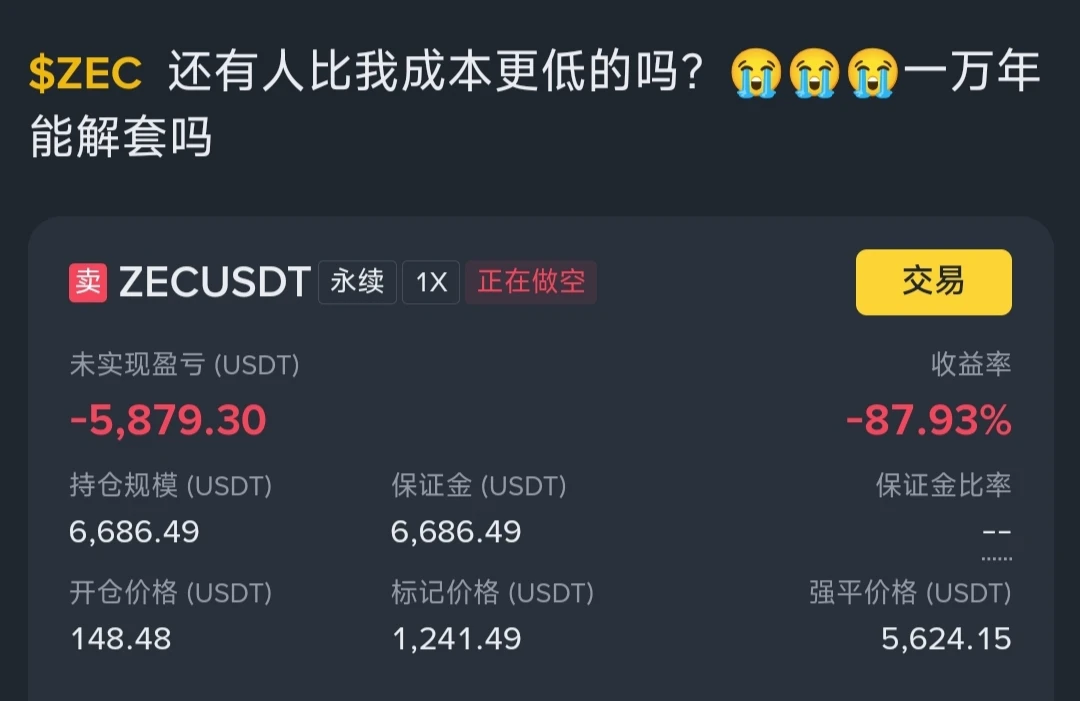
$ZEC The thing I find most curious about this coin is that no matter when you short it, you can always find someone who shorted at a lower price than you!#$ZEC ‌# ‌
post-image
ZEC+1.29%
  • 3
How Much Should You Lose on a Single Trade? Scientifically Managing Risk Is Key to Long-Term, Consistent Profits!

In cryptocurrency futures trading, many people spend every day studying when BTC will rise or fall, yet rarely take the time to calculate one thing: if this trade goes against them, how much can they actually afford to lose?

In fact, in long-term trading, predicting direction is only part of the equation. Risk management is what determines whether an account can survive over time.

First, set your risk per trade in advance. You can use 1% of your account balance as the risk budge
post-image
BTC-0.65%
$IDOL recorded a $5.14K short liquidation around $0.03178, suggesting buyers are starting to pressure short positions. If price maintains its demand zone, another push higher could target liquidity resting above recent swing highs. Watch for a clean breakout supported by volume.
Support: $0.0305 – $0.0295
Resistance: $0.0325 – $0.0340
Next Target: $0.0360
Confirmation: Holding above $0.0325 could strengthen bullish momentum and open the door to a short squeeze.
Let's go $IDOL 🚀
post-image
IDOL-6.71%
Load More

Join 40 M users in our growing community

⚡️ Join 40 M users in the crypto craze discussion

💬 Engage with your favorite top creators

👍 See what interests you

Trending Topics

USCPIDataIncoming

1.04k Views1.48k Discussing

The U.S. October CPI report will be released on November 10 at 8:30 a.m. ET. September CPI came in at 3.7% year over year, and markets will be watching closely for signs that inflation is cooling, especially in core CPI. A softer-than-expected reading could strengthen rate-cut expectations, while hotter inflation may pressure risk assets through higher Treasury yields and a stronger dollar. How do you think this CPI print will move $BTC, U.S. stocks and gold?

USAIStocksHitHard

23.56k Views3.69k Discussing

USNonfarmPayrolls

40.34k Views4.38k Discussing

View More