Share your thoughts
placeholder
Article
I’m watching $BNB for a short here.
BNB bounced strongly from $703.8, but the recovery is starting to stall around $715–$716. On the 15m chart, this looks like a potential resistance area after the earlier breakdown.
Entry: $714.80–$716.20
Targets:
TP1: $712.50
TP2: $709.80
TP3: $706.50
Stop: $718.30
For me, $718 is the key level. As long as BNB stays below it, I’m looking for another move lower. A clean reclaim above $718.30 would invalidate the short idea.
#GateTop4MainstreamCEX #AppleSeptemberEvent
post-image
BNB-1.01%
  • 5
  • 1
🚨 U.S. August PPI rose 5.4% year over year; keep a close eye on CPI next
The U.S. August PPI released on September 10 rose 0.4% month over month and 5.4% year over year. Among them, energy prices rose 4.2% month over month, making them the main driver of price increases on the goods side. Source: BLS
My view: Cost pressures are still present. For U.S. tech stocks and BTC to open up room for gains on expectations of looser policy, more evidence is needed.
The next key event is the U.S. CPI at 20:30 on September 11 (Beijing time). I’ll first look at the core components, then at U.S. Treasury yi
BTC-1.37%
  • 13
  • 2
A few days ago, I was still calculating whether I had enough money for instant noodles this month; this morning, I was already wondering whether to add a sausage.
During the intraday plunge, $HYPE fell short every time it tried to push higher, with clear resistance overhead, low trading volume, and strong selling pressure. I repeatedly reminded everyone during the session to hold their short positions firmly and not be scared out by minor rebounds. As long as the trend remained intact, there was no need to make random moves—just wait for it to reveal the answer.
From 83.219 to 79.483, +318.88%
post-image
HYPE-3.92%
BNB-0.90%
LAB-5.03%
$CL Oil prices both broke above $100, a development worth watching closely.
On September 10, oil tanker attacks and concerns over supply disruptions pushed oil prices higher, with both major crude oil benchmarks rising more than 6%.
▪ Brent: $107.63/barrel
▪ WTI: $102.48/barrel
These are settlement prices.
I’m more focused on how long this round of price increases can last.
If the supply shock continues, corporate profit margins and room for interest-rate cuts could both come under pressure, while the rebound in U.S. tech stocks and BTC will also face a higher hurdle.
Next, watch three signals
CL+5.70%
Bullish @Raydium up 69% this week i420 solana:4k3Dyjzvzp8eMZWUXbBCjEvwSkkk59S5iCNLY3QrkX6R looks primed here
post-image
RAY+18.05%
SOL-1.66%
#GateEventContractChallenge
📈 My Profitable DOGEUSDT Trade.
Today I am sharing my latest trade within #GateEventContractChallenge . This time, the focus was on DOGEUSDT—a futures contract I chose to trade after assessing the current market dynamics.
I opened a buy position, expecting DOGE to continue moving upward. For me, it was important not simply to enter a trade based on emotions, but to assess the situation on the chart and wait for the moment when the potential movement would provide an opportunity to lock in the result.
The market, as always, does not move in a straight line, so duri
AAPL+3.55%
DOGE-2.34%
  • 1
🚨 JUST IN: Robinhood Chain DEX liquidity surpasses $100 MILLION, according to Artemis.
$HOOD
post-image
9、9/11 Morning Market Outlook and Strategy
Gold continued moving lower before rebounding slightly from the lows, with the current price at 4320.10. On the one-hour timeframe, the moving averages remain bearishly aligned, and the price is still below them. The overall bearish trend has not changed; the current move is merely a slight recovery after the decline, with weak rebound momentum.
The short-term resistance above is 4329‑4344, the pressure zone formed by the short-term moving averages; the first support below is 4313, with key defense at 4295. If the rebound fails to hold above 4344, the
post-image
XAUT-1.66%
Even Armour can’t protect from FOMO😂
post-image
Gate Makes It into the Mainstream CEX Top 4—Are 60 Million Users Just the Beginning?
Competition among crypto exchanges has long been about more than simply comparing trading volume. User base, product diversity, liquidity, security systems, and global reach are jointly determining the overall strength of a CEX.
Gate has now entered the mainstream CEX Top 4, and this position carries real weight. Especially after surpassing 60 million global users, the platform has built a considerable user base.
What is even more noteworthy is that Gate is not focusing solely on traditional spot and futures t
MEME-1.92%
  • 27
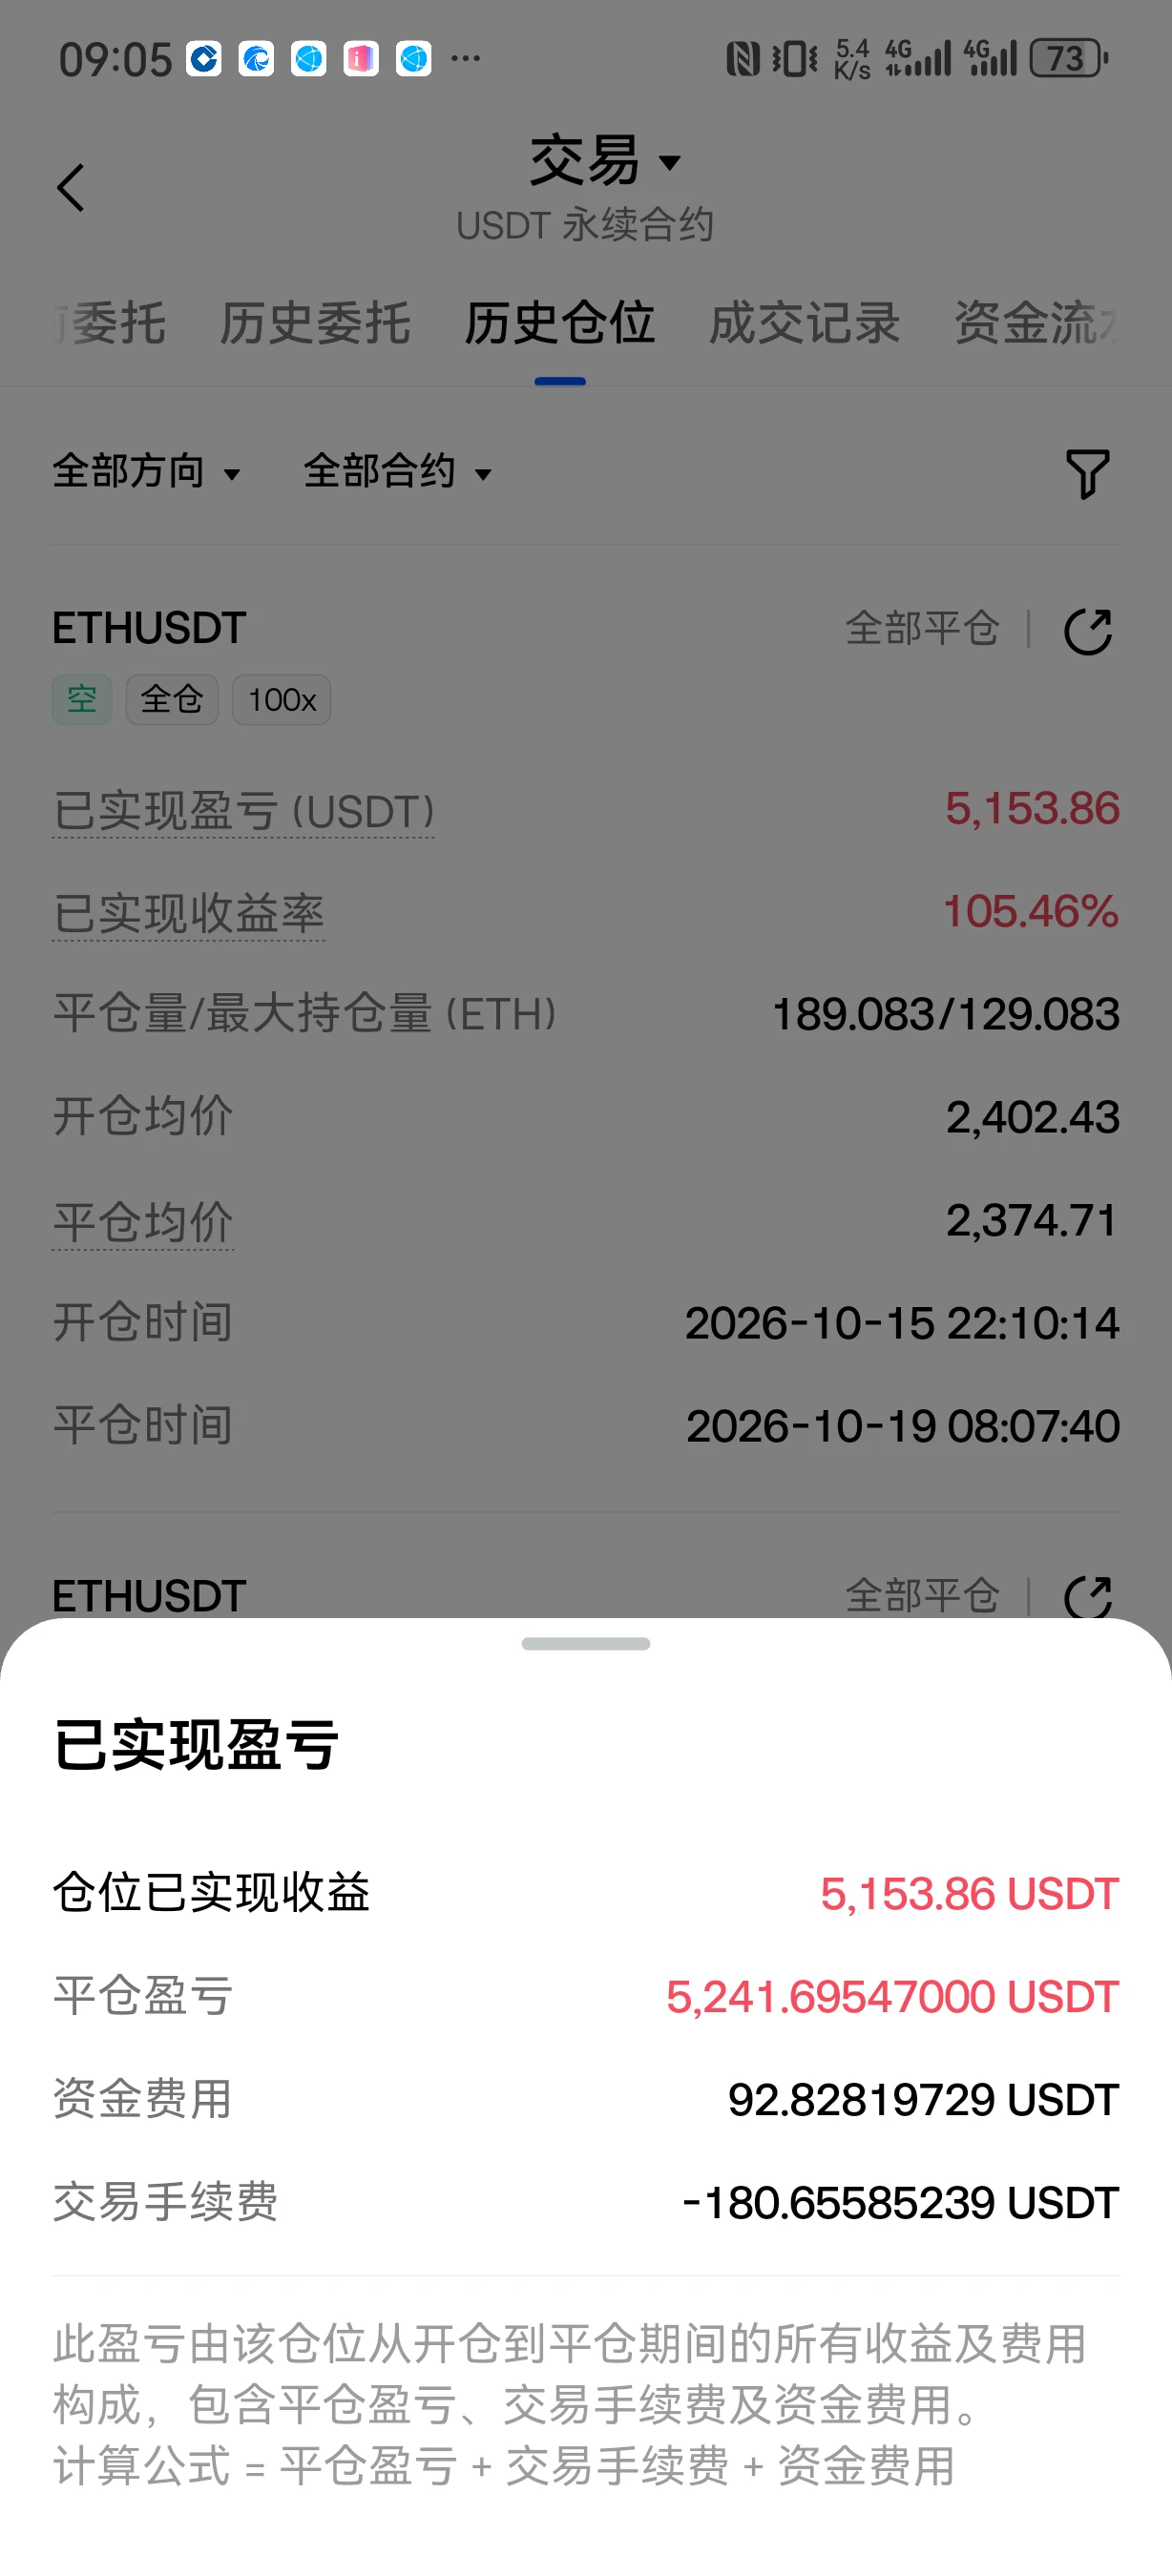
This morning, ETH likewise rebounded from the bottom to near 2480 before meeting resistance and pulling back. In the evening, it dipped to the 2400 level at its lowest. The shorting strategy played out as expected, with the 2400 target hit precisely, securing an 80-point move. The market has now begun a rebound recovery!

From the current market structure, the daily chart surged and then pulled back, with the price retreating to near the Bollinger middle band amid intense bullish-bearish contention. The upper Bollinger band is clearly exerting resistance, bullish momentum is weakening, and th
post-image
ETH-0.18%
Why is everyone suddenly bearish on ZEC when the 1D trend is clearly bullish and the setup is begging for a long?

$ZEC /USDT - LONG

Trade Plan:
Entry: 1126.85 – 1141.53
SL: 1063.71
TP1: 1187.05
TP2: 1222.28
TP3: 1275.14

Why this setup?
Why now? The 1D trend is firmly bullish, setting the structural stage for a continuation move. The 15m RSI sits at 27.42, signaling extreme oversold conditions that often precede a sharp reversal. The 1h ATR of 29.36 tells us volatility is compressed and ready to expand in the direction of the trend. The entry zone between 1126.85 and 1141.53 aligns perfec
ZEC-10.57%
[New Streamer] Market Prediction
live-cover
LIVE1,053
I minimized the app to reply to a message, and when I came back, it had already finished the job. During the repeated intraday swings, I watched for a long time and found that there were no buyers on the rebounds—the selling pressure was strong, and the funds had no intention of pushing it upward at all. When I checked the chart right after lunch, I came up with a short idea: entered at 1.3889, and it has now dropped to 0.1394, +1771.22%—that says it all. Feels great, brothers. This is exactly how you should hold a short position. In terms of execution, take 70% off first, set a protective lev
post-image
LAB-5.03%
ZEC-10.57%
#GateMeme
🔥 The memecoin dropped after the pump — is this an opportunity or a trap?
After a meme token posts strong gains, a price drop is often seen as a chance to buy cheaper. But a pullback by itself does not mean the asset has become more attractive to enter. After the hype, some traders begin taking profits, while early buyers may close their positions en masse. At this point, the price can fall much faster than new buyers expect. That is why I would not rush to call every pullback a “discount.”
👀 For me, something else is more important here: what happens after the first wave of the d
DOGE-2.34%
PEPE-4.79%
FLOKI-2.48%
  • 1
There is a kind of money you will experience that all logic will not exist.
I mean $245m at 22 years old 🤯
post-image
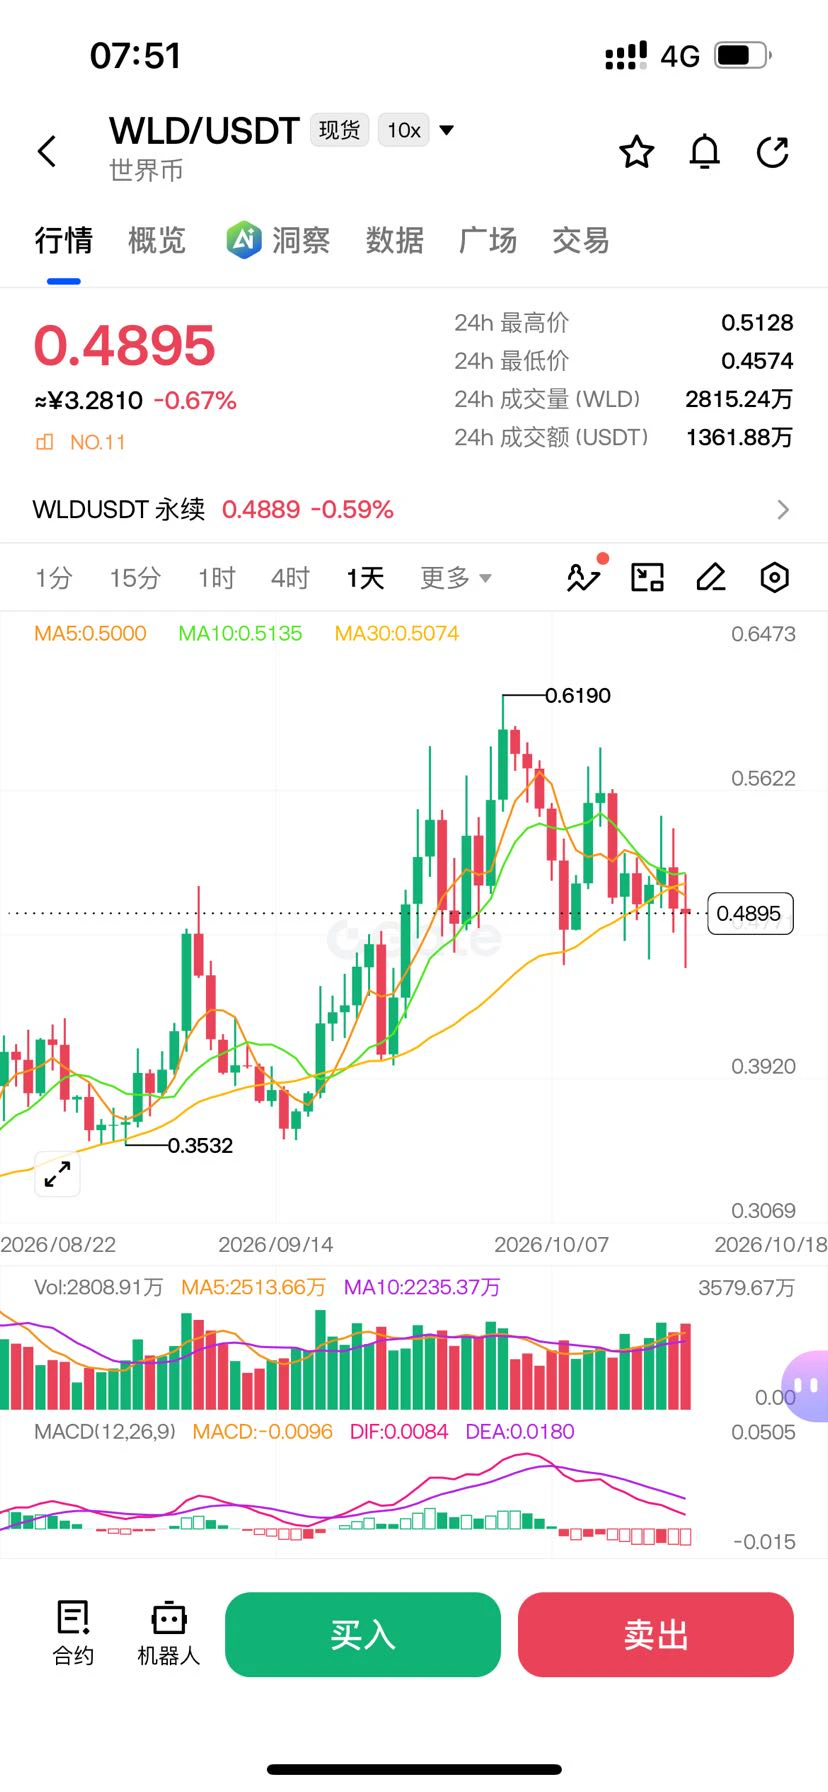
Nobody is talking about this quiet LONG setup forming right now.

$WLD /USDT - LONG

Trade Plan:
Entry: 0.4009 – 0.4059
SL: 0.3725
TP1: 0.4266
TP2: 0.4420
TP3: 0.4652

Why this setup?
Why now? The 1h price sits at 0.4034 inside a tight entry zone between 0.4009 and 0.4059, while the 15m RSI reads 25.32 showing extreme oversold pressure that often precedes reversals. The 1h ATR of 0.009905 confirms low volatility compression, which typically explodes into directional moves once the entry zone breaks. With the daily trend locked in range, this LONG bias targets TP1 at 0.4266 and TP2 at 0.4420
WLD-3.08%
SNDK also weakened throughout the day, facing resistance near 1770 after an early rebound and pulling back all the way to around 1674. Our high-level short setup targeting 1690 hit accurately again, securing another 100-point move! It is currently trading in a low-level consolidation!
From the current chart structure, the daily level has entered a pullback after a round of gains, while the price remains above the Bollinger middle band, meaning the larger-cycle bullish structure has not been completely broken; upward momentum is weakening, and the market has entered a high-level pullback phase.
post-image
SNDK-4.22%
ZEC is currently trading around 1132. After surging to a previous high of 1297, it came under pressure and pulled back. The intraday high reached 1257, while the low fell to 1112, with the market entering a high-level correction phase.

From the current chart, a sharp retracement has followed a strong rally on the daily timeframe. The price remains above the Bollinger middle band, and the broader bullish structure has not been completely broken. After consecutive sharp gains, bullish momentum has rapidly weakened, while the upper Bollinger band is exerting strong resistance, indicating that t
post-image
ZEC-10.57%
Load More

Join 40 M users in our growing community

⚡️ Join 40 M users in the crypto craze discussion

💬 Engage with your favorite top creators

👍 See what interests you