Share your thoughts
placeholder
Article
🚨 VIP SIGNAL: $STORJ /USDT
Pair: $STORJ USDT
BUY ZONE / ENTRY:
Entry Range: 0.05800 - 0.06150
TARGETS:
TP 1: 0.06900
TP 2: 0.07600
TP 3: 0.08500
STOP LOSS:
SL: 0.05150
$STORJ ‌#CoinDeskRevealsGateRWAPerpetualsTop3Globally
post-image
STORJ+35.03%
  • 3
  • 2
#CryptoMarketAnalysis
INFLATION HAS CHANGED THE GAME
The most important story this weekend is not simply whether inflation is rising or falling. It is the conflict between improving annual inflation and stubborn monthly pressure.
August CPI came in exactly at expectations, with headline inflation at 3.4% YoY, unchanged from July, while monthly CPI accelerated to 0.4%, the strongest monthly increase since May. Gasoline jumped 3.9% and contributed more than one-third of the monthly increase.
The deeper signal is more complicated. Core CPI cooled to 2.4% YoY, its lowest level since March 2021, b
post-image
This move is so obvious, I don’t even need to think—the account is dancing on its own.

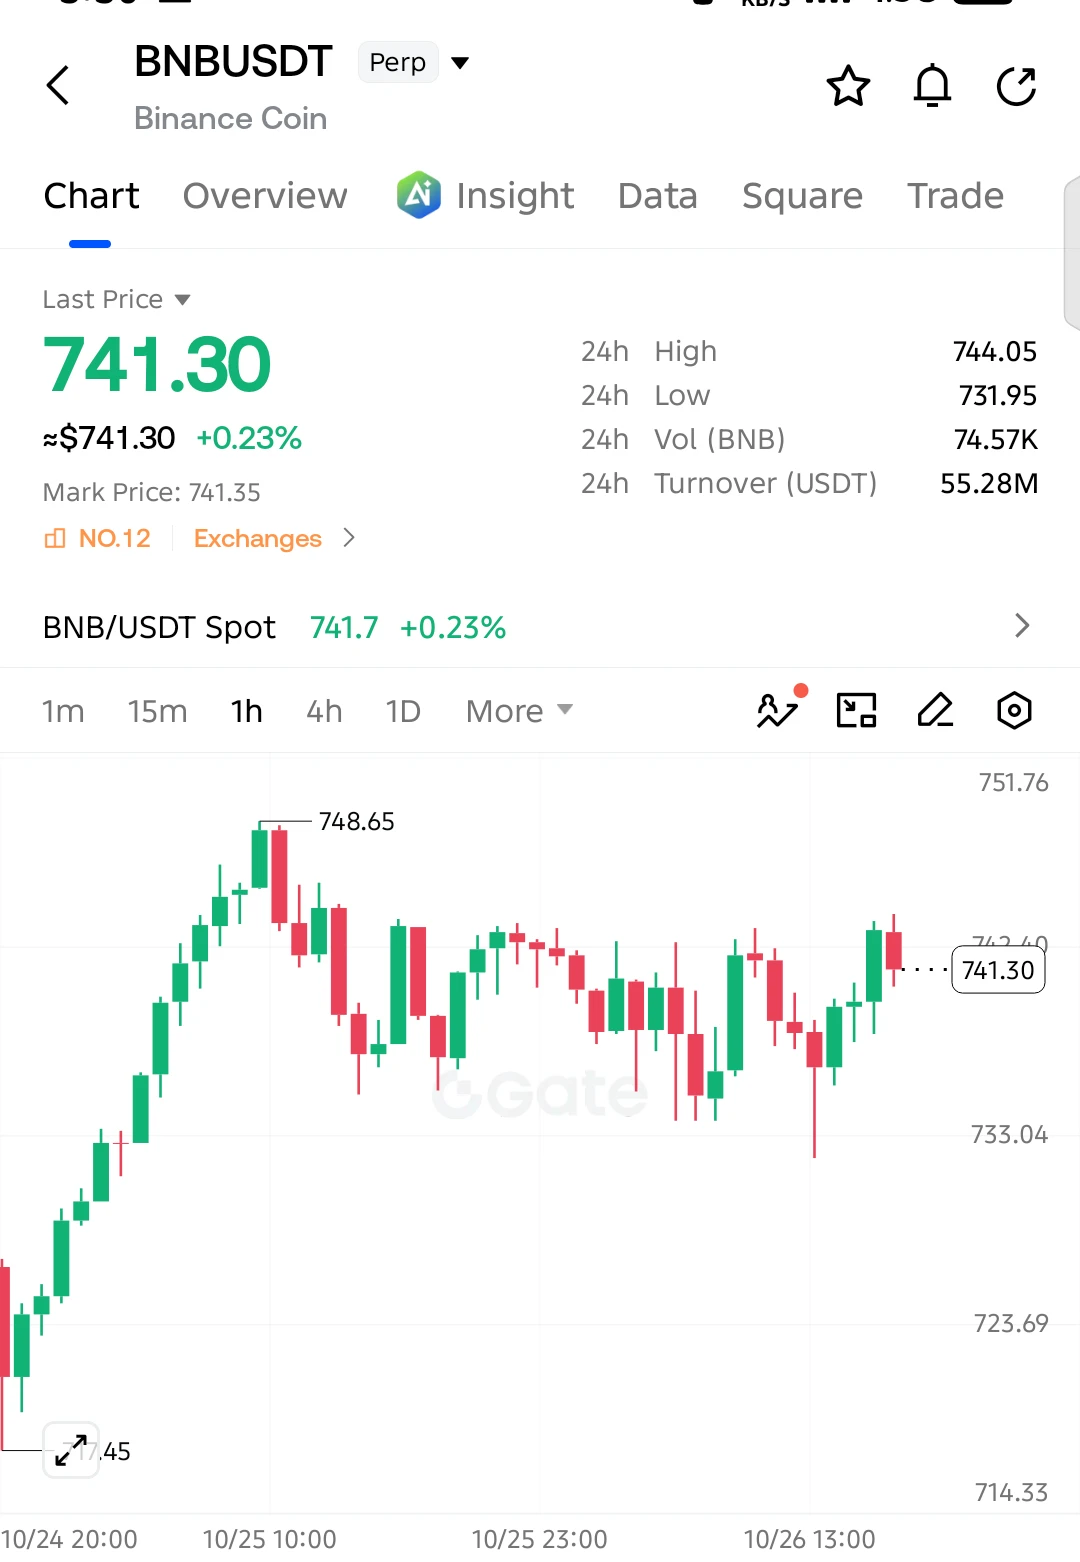
When I checked the chart after lunch, I found $BNB still grinding around 641.25. There were plenty of bearish candles, but it simply wouldn’t break lower. That wasn’t weakness; it looked more like funds quietly entering and changing hands. The chart hadn’t broken down and buying pressure was strengthening. I couldn’t be wrong about this bottom structure, so I opened a long position as planned. Then a single candlestick shot it up to 735.6, with +1044.18% secured. Feels good, brothers💪

Don’t get greedy—
post-image
BNB+0.40%
ADA-2.30%
ZEC-4.41%
#CoinDeskRevealsGateRWAPerpetualsTop3Globally
Gate's RWA Perpetuals Now Rank Top 3 in the World, and CoinDesk Research Confirmed It
According to CoinDesk's latest Exchange Review for August 2026, Gate's RWA Perpetuals segment has officially entered the global top 3. RWA stands for Real-World Assets, meaning assets tied to real financial value in the physical world such as gold, tokenized treasuries, equities and indices, brought together with the blockchain and crypto trading ecosystem. Alongside this, Perpetuals are futures-style contracts with no fixed expiry date, allowing traders to take
post-image
#GateMeme
#每周来晒
The collective pullback of popular Memes on Robinhood Chain (such as PONS and MEME) is essentially the combined result of short-term profit-taking, cooling market sentiment, and capital rotation. This pullback contains an element of shakeout, while also genuinely reflecting declining market hype.
I. Analysis of the Pullback: Shakeout and Cooling Sentiment Coexist
1. Profit-Taking and Cooling Sentiment (Primarily Cooling Sentiment)
Profit-taking: Previously popular Memes posted substantial gains, and some investors chose to take profits after prices reached highs, increasing
post-image
ThisIsTranslateContent:
#GateMeme The collective pullback of popular Memes on Robinhood Chain, such as PONS and MEME, is essentially the combined result of short-term profit-taking, cooling market sentiment, and capital rotation. This pullback reflects both some degree of shakeout and a genuine cooling of market enthusiasm.
I. Analysis of the Pullback: Shakeout and Cooling Sentiment Coexist
1. Profit-Taking and Cooling Sentiment (Primarily Cooling)
Profit-taking: Popular Memes posted massive gains earlier, and some capital chose to take profits after prices reached highs, increasing selling pressure and directly triggering the pullback.
Sentiment ebbing: Meme coins are highly dependent on market sentiment and capital inflows. As the earlier FOMO (fear of missing out) sentiment faded, market sentiment began to cool, and some momentum-chasing traders exited, causing prices to fall.
Capital rotation: Market hotspots rotate, with capital flowing to other chains, such as BSC and Solana, or to new projects, leading to a decline in localized enthusiasm for Robinhood Chain.
2. Changes in Market Structure and Shakeout (Some Shakeout Element)
Market clearing: The Meme market follows the “80/20 rule,” and many “shitcoins” lacking real value support rapidly go to zero after enthusiasm fades. This pullback is a process of eliminating weak coins and shaking out speculative positions, while some higher-quality or strongly narrative-driven assets may recover after the shakeout.
Mechanism test: The pullback of some platform tokens, such as $PONS , also tests the actual support provided by mechanisms like “buybacks funded by transaction fees” after enthusiasm fades. The pullback itself is also a process of market repricing.
II. Outlook: Short-Term Volatility, Long-Term Divergence
1. Short-Term Risks Remain High; Bottom-Fishing Requires Caution
Sentiment-driven risks: Meme coins lack fundamental support, and their prices are highly vulnerable to short-term sentiment and whale activity. Further downside remains possible after the pullback. “Shitcoins” lacking a strong narrative may go directly to zero, so blindly bottom-fishing sentiment-driven coins should be avoided.
Broad-market correlation risk: The overall trend of the crypto market, such as Bitcoin’s price movement, will directly affect the performance of on-chain Memes. If the broader market continues to weaken, the magnitude of the Meme pullback may increase further.
2. Long-Term Value Divergence; Select Targets Carefully
Focus on assets with real support: Some assets with practical product logic and the ability to capture genuine on-chain trading volume, such as certain platform tokens, may have some recovery potential after the shakeout. However, investors should wait for market sentiment to recover and capital to flow back in.
Focus on ecosystem value: The pullback in Robinhood Chain is primarily a pullback in the Meme sector. Progress in its on-chain RWA (real-world assets) and DeFi ecosystems will determine the chain’s long-term value.
III. Recommendations: Primarily Wait and See, Strictly Control Position Sizes
Wait and see: For ordinary investors, it is advisable to primarily wait and see, and make decisions only after market sentiment has fully stabilized and the broader market trend has become clear, avoiding blindly bottom-fishing and becoming trapped in a downtrend.
Strictly control position sizes: Use only idle funds you can afford to lose, test the waters with small positions, and set strict stop-loss levels. Never take large positions to gamble on a rebound.$PONS ‌
repost-content-media
PONS-1.55%
THIS IS CONCERNING
Despite the Fed's new Zero Forward Guidance policy,
the CME market is presenting a whopping 87.3% probability for a 25 bps rate hike.
If they raise with 25 BPS, we could be facing further dump on the stock and crypto market.
This would further drive US long-term yields higher.
The US30Y is now at 2007 levels pre-Great Financial Crisis yield levels.
My opinion remains the same: if they go through with rate hikes, they risk a systemic failure building up for the future.
The financial market is a house of cards built on leverage in the derivatives market.
If you raise rates to
post-image
CME+0.52%
Everyone is missing that SYMBOL is quietly arming for a move down

$DOT /USDT - SHORT

Trade Plan:
Entry: 1.039 – 1.045
SL: 1.075
TP1: 1.018
TP2: 1.001
TP3: 0.977

Why this setup?
Why now? The 1h price is pinned at 1.042 inside a tight 4h range, and the 15m RSI at 48.15 shows bearish momentum is still fresh. The 1h ATR of 0.013568 tells us volatility is compressed, so a single impulse can rip through the entry zone of 1.039 to 1.045. From there, TP1 at 1.018 and TP2 at 1.001 offer a stacked ladder of targets, but the trade dies instantly if price pushes above 1.057. Treat 1.057 as the line
post-image
DOT-5.31%
  • 1
Everyone is missing the real setup forming inside SYMBOL right now.

$SPCX /USDT - SHORT

Trade Plan:
Entry: 150.04 – 150.32
SL: 151.55
TP1: 149.15
TP2: 148.47
TP3: 147.44

Why this setup?
Why now? The 1h price is locked at 150.18 inside a tight entry zone between 150.04 and 150.32, while the daily trend is range, creating a perfect squeeze for a directional move. The 15m RSI sits at 57.81, showing just enough bullish exhaustion without being overbought, which makes a short reversal more believable. The 1h ATR of 0.571159 confirms the market is calm enough for a sharp leg down to hit TP1 at
post-image
SPCX+1.43%
  • 1
Back to charting 😂
BTC sitting around $77K and the chart is at a key decision point.
$76K is the level I’m watching 👀
Hold it → $78K → $80K becomes likely.
Lose it → $74K → $73K comes into play.
Not chasing here. Waiting for a confirmation.
#BTC #Bitcoin #CryptoTrader
post-image
BTC-2.06%
$ETH
ETH is now at 2,533. There’s not much to say about today’s session, but it still needs to be said. The last candle closed flat, with a 0.07% range—just grinding sideways. It’s up 2.41% over 24 hours, still 5.30% below today’s high of 2,667 and only 2.46% above the low of 2,471. I don’t pay much attention to indicators; watching this kind of market too much makes it easy to overinterpret things. If 2,550 can’t be broken, it’s still just a rebound; breaking 2,523 would be a different story. The biggest purpose of this kind of market is to filter out impatient people. Across the broader mar
ETH-2.57%
Sometimes, what you see is not actually important
What matters is what you think
post-image
$龙虾 Signal】Long + 1H momentum continuation, buy the wick on pullback
$龙虾 1H RSI 85.41, overbought at high levels; 4H MACD histogram expanding, 1H histogram contracting. Price at 0.135634 has moved above the 4H Bollinger upper band at 0.1302. Order book depth -18.07%, Bid/Ask 0.69, with dense sell orders. Long momentum is continuing, but chasing is crowded; entering on a pullback is cleaner.
🎯Direction: Long
⚡Entry/limit orders: 0.13522710 - 0.13563400
🛑Stop-loss: 0.12885230
🚀Target 1: 0.14580655
🚀Target 2: 0.15089283
🛡️Trade management:
- Execution strategy: After reaching Target 1, redu
post-image
龙虾+185.88%
BTC-2.06%
ETH-2.56%
SOL-1.79%
Market BTC Coin
live-cover
LIVE1,286
Hull City will concede their first goal today against Chelsea.
I know they are coming to pack the bus but we will show them that we are not Manchester United
My prediction: Chelsea 4 - 1 Hull City
#CHEHUL #EPL
Why is SYMBOL sitting at 2.3596 when the 1d trend screams bullish?

$NEAR /USDT - LONG

Trade Plan:
Entry: 2.3480 – 2.3712
SL: 2.2479
TP1: 2.4434
TP2: 2.4992
TP3: 2.5829

Why this setup?
Why now? The 1d trend is already bullish, but the 1h price is still hovering at 2.3596, meaning the big move has not yet arrived. The 15m RSI at 45.13 shows the short term is not overbought, leaving room for a clean push. The 1h ATR of 0.046531 tells us the next candle could easily span the gap to TP1 at 2.4434. If momentum holds, TP2 at 2.4992 becomes the real target, but the trade is invalidated the momen
NEAR-9.57%
In this kind of market, honestly, it’s way too easy to get punished by blindly guessing long or short. Some people chase the pump, only to find it has already started shorting; others think it’s going to drop, but it goes long ahead of time.
Having a reference is still very important.
I took a look at @VergeX, and this AI trader really seems to know its stuff.
A lot of people are trading on Hyperliquid, but only a minority can make money consistently. I think VergeX’s model is pretty practical—putting profitable AI strategies right out in the open, so you can check the track record, choose a s
post-image
HYPE-3.07%
🔥Before you know it, the subscription has entered its 4th year; the annual low of 5.5gt at half price ends tonight‼️ Both longs and shorts made money this month‼️ Pingguo can be accessed by clicking 👇
🎉https://www.gate.com/zh/profile/The swing-trading king, K-god
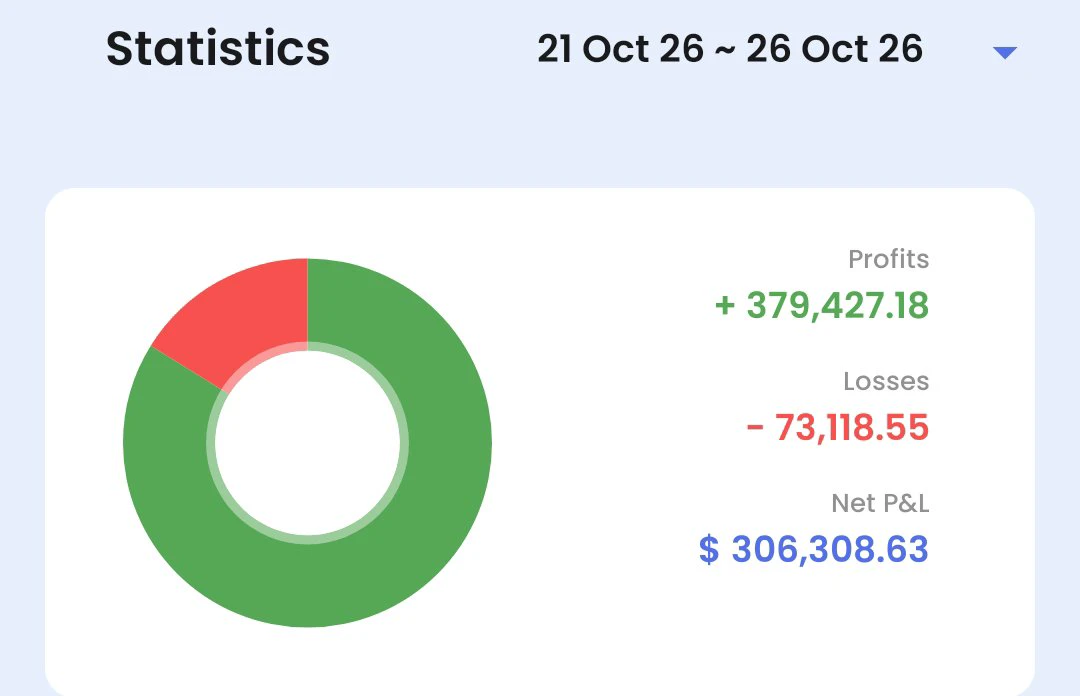
🔥 Last week, 62800/1865 and 76500/2355 longs to 82250/2565, making over 1 million
🔥 Last night’s CPI wick: long at 75900/2435, pushed up to 79850/2640, taking profit at resistance📈
🔥Reversed into a precise short at 79850/2640, taking profit today at 76850/2505
🔥Shandi went long at 1440 and reached 1820, making 800K📈 Reversed
  • 10
The first 30 minutes after the U.S. stock market opens may reveal the direction of the final 30 minutes in advance.
A study covering 20 years of SPY data found that the price move from the previous day's close to 30 minutes after the open has predictive power for the direction of the final 30 minutes, with this relationship more pronounced on days with high volatility, high trading volume, and major macroeconomic data releases.
A set of clear trading rules can be designed around the price range formed during the first 30 minutes after the open. We refer to this opening-range breakout as ORB.
T
post-image
BREAKING: 🇺🇸 President Trump says the stock market is now higher than it has ever been in American history.
post-image
  • 5
Load More

Join 40 M users in our growing community

⚡️ Join 40 M users in the crypto craze discussion

💬 Engage with your favorite top creators

👍 See what interests you