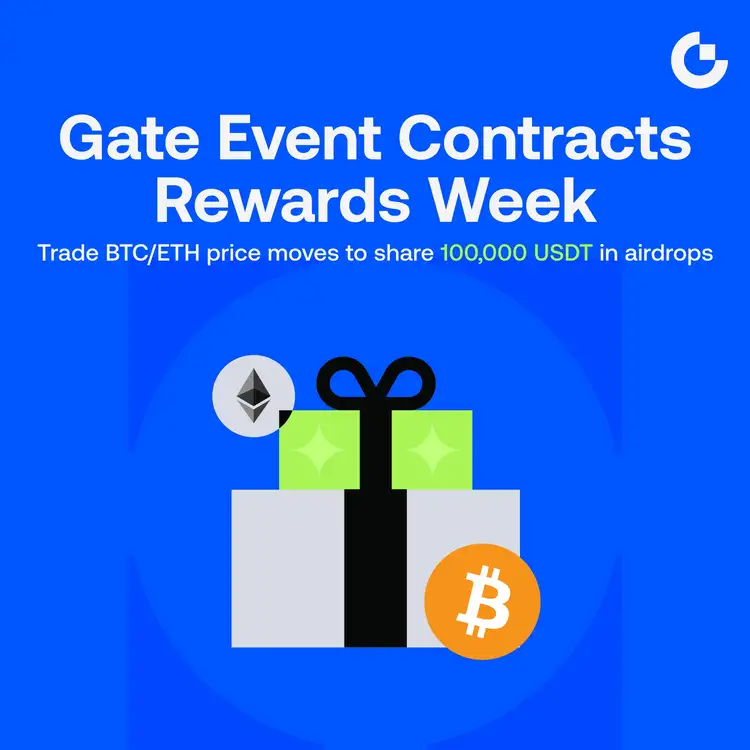


🔥 Gate Event Contracts Rewards Week Begins
Simply predict short-term BTC/ETH price movements and join the trades to unlock 4 exclusive benefit tracks❗️
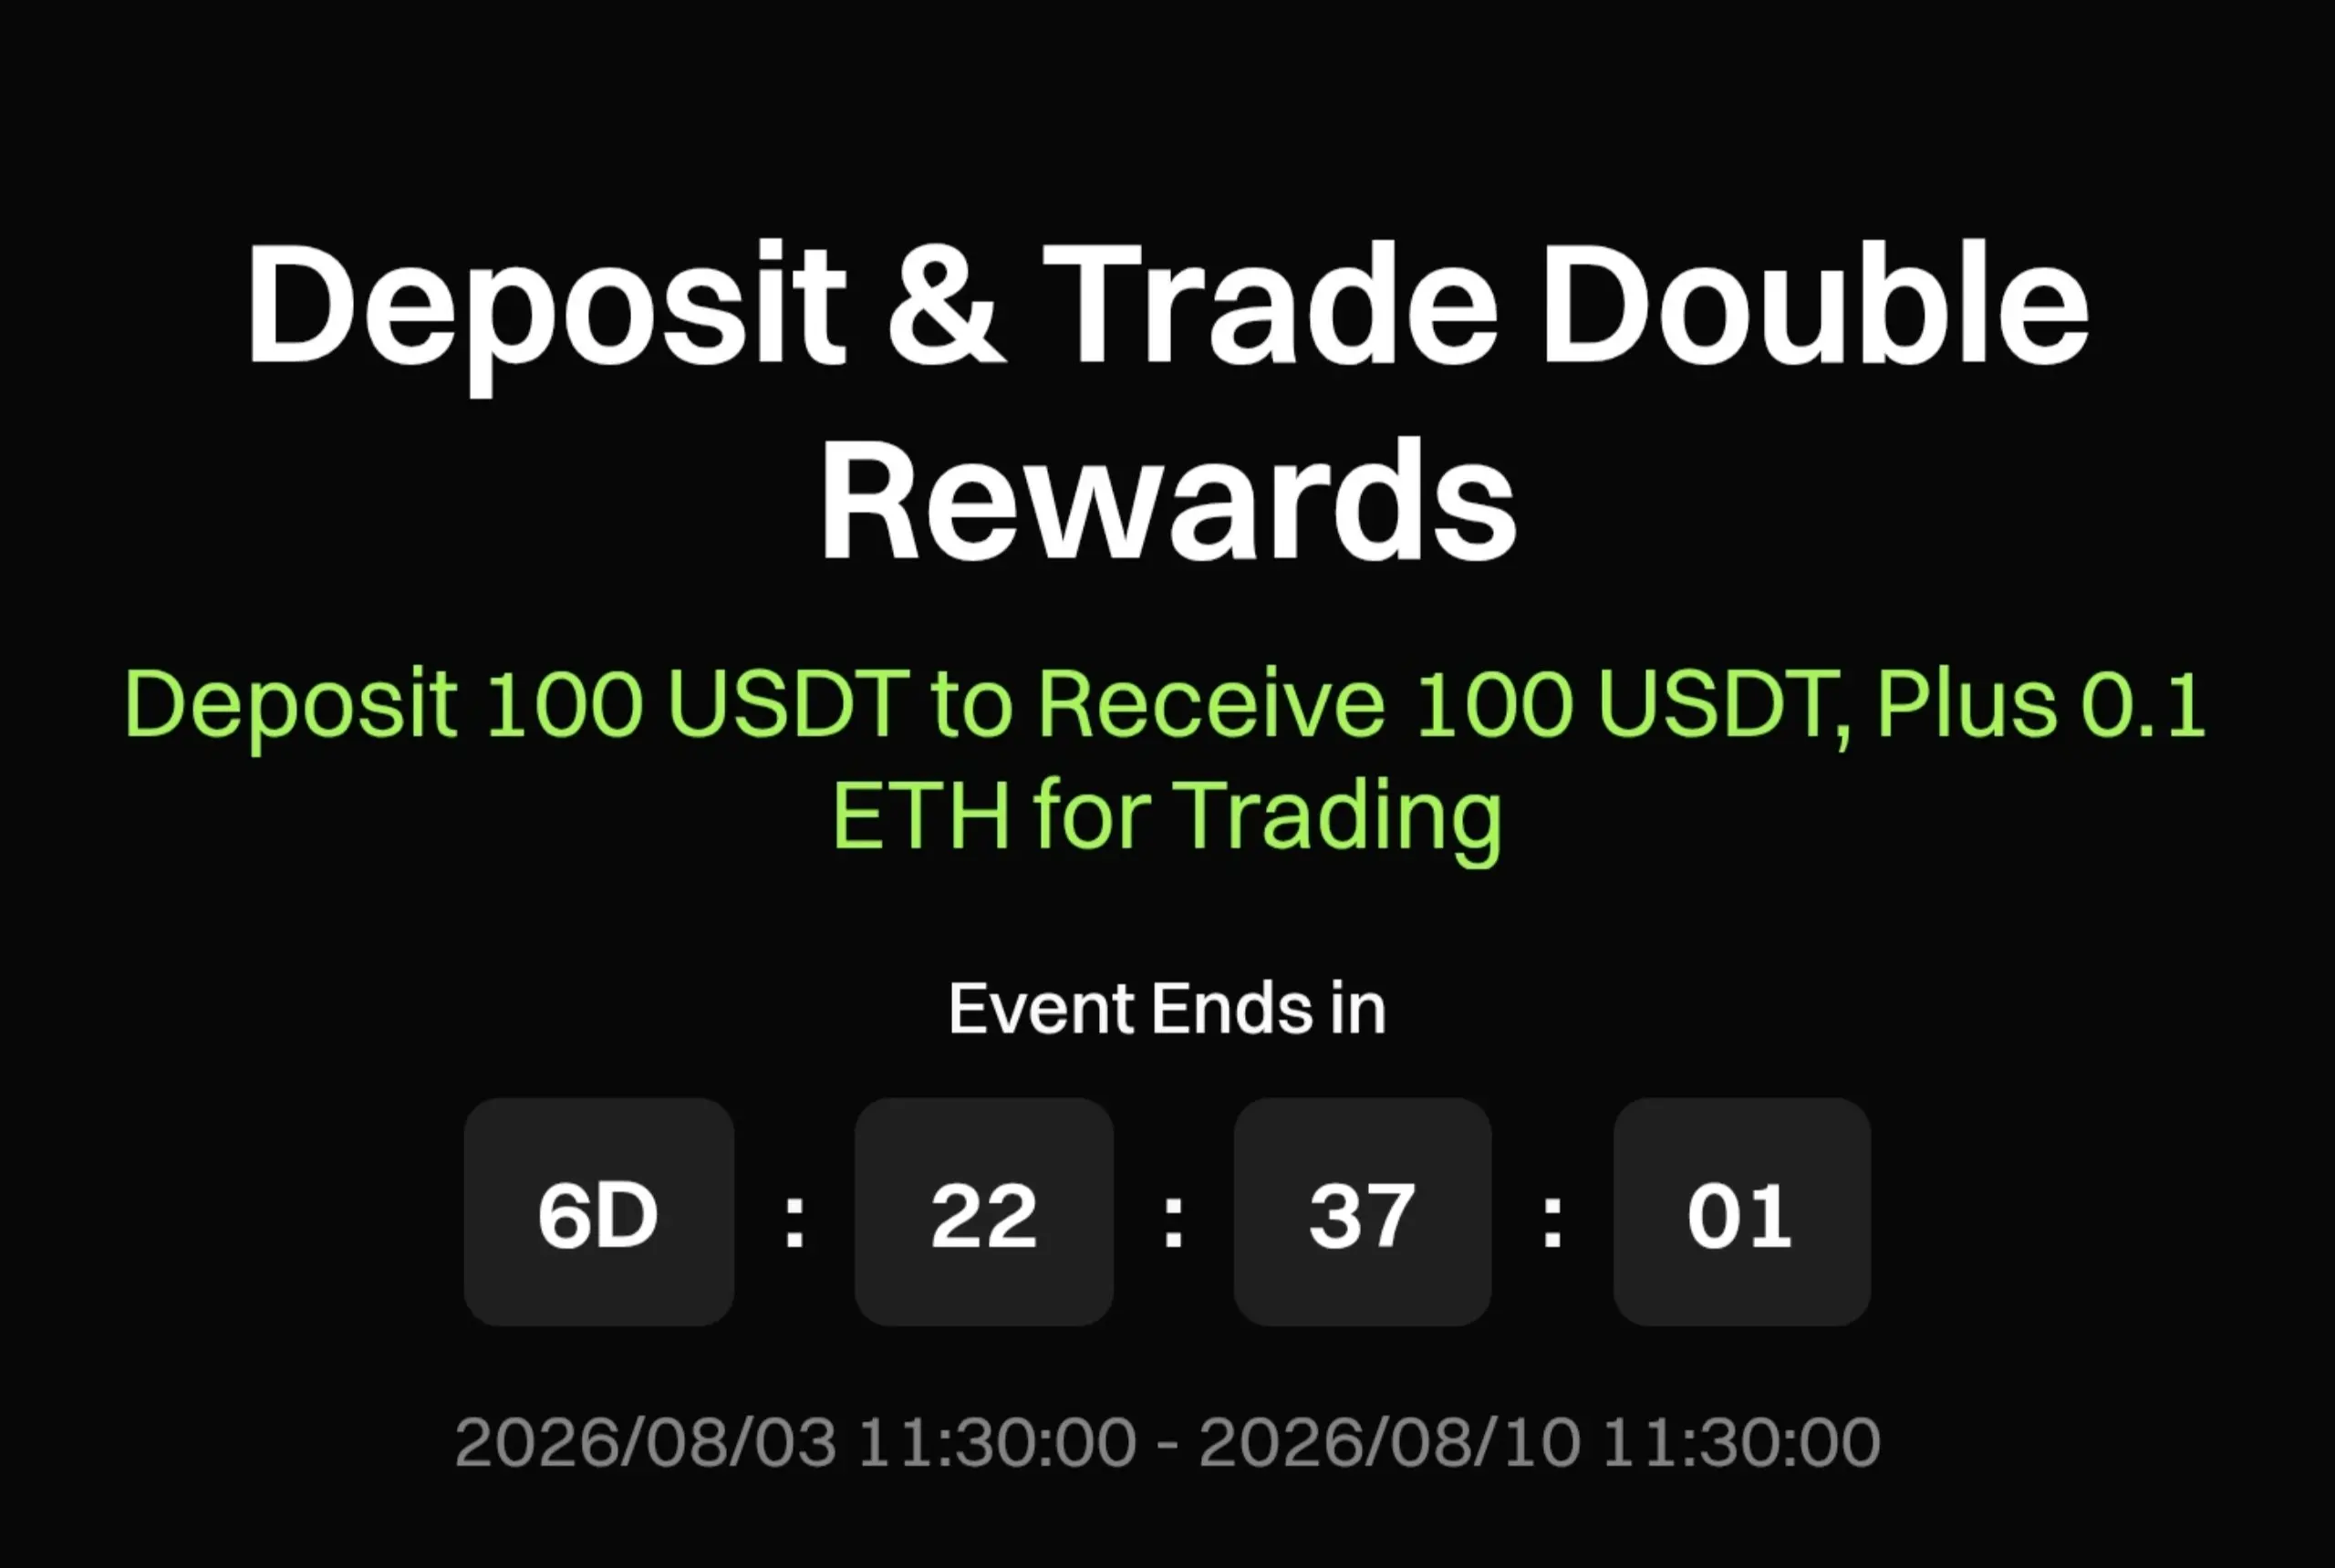
⏰ Event Period: August 3, 2026, 04:00 – August 10, 2026, 00:00 (UTC)
🔹 Activity 1: Loss Coverage for New Users’ First Order
The first 5,000 new users who incur a loss on their first trade will receive compensation based on their actual losses, with a maximum compensation of 5 USDT per user.
🔹 Activity 2: New User Check-In Competition
Complete no less than 3 trades with a daily trading volume of at least 20 USDT to complete daily check-in.
Users with cumulative check-ins of 3 days or more will share the 10,000 USDT prize pool; users with full 7-day attendance will receive an additional guaranteed 3 USDT.
🔹 Activity 3: Advanced Check-In Competition
Complete advanced daily check-in by reaching a daily trading volume of ≥ 500 USDT.
Users with cumulative advanced check-ins of 3 days or more will share the 20,000 USDT prize pool; users with full 7-day attendance will receive an additional guaranteed 10 USDT.
🔹 Activity 4: Peak Trading Competition
Users with a cumulative trading volume of ≥ 20,000 USDT will share the 30,000 USDT prize pool.
Participants with a cumulative trading volume of ≥ 150,000 USDT will get a guaranteed 500 USDT reward, and Top 10 ranked traders can earn an additional reward of up to 2,000 USDT.
📈 Volume Bonus: All trading volume generated from August 8 to August 9 enjoys a 1.2x multiplier.
👉 Join Now: https://www.gate.com/campaigns/5715Event?pid=TG&ch=nSsLZDDi
Simply predict short-term BTC/ETH price movements and join the trades to unlock 4 exclusive benefit tracks❗️
⏰ Event Period: August 3, 2026, 04:00 – August 10, 2026, 00:00 (UTC)
🔹 Activity 1: Loss Coverage for New Users’ First Order
The first 5,000 new users who incur a loss on their first trade will receive compensation based on their actual losses, with a maximum compensation of 5 USDT per user.
🔹 Activity 2: New User Check-In Competition
Complete no less than 3 trades with a daily trading volume of at least 20 USDT to complete daily check-in.
Users with cumulative check-ins of 3 days or more will share the 10,000 USDT prize pool; users with full 7-day attendance will receive an additional guaranteed 3 USDT.
🔹 Activity 3: Advanced Check-In Competition
Complete advanced daily check-in by reaching a daily trading volume of ≥ 500 USDT.
Users with cumulative advanced check-ins of 3 days or more will share the 20,000 USDT prize pool; users with full 7-day attendance will receive an additional guaranteed 10 USDT.
🔹 Activity 4: Peak Trading Competition
Users with a cumulative trading volume of ≥ 20,000 USDT will share the 30,000 USDT prize pool.
Participants with a cumulative trading volume of ≥ 150,000 USDT will get a guaranteed 500 USDT reward, and Top 10 ranked traders can earn an additional reward of up to 2,000 USDT.
📈 Volume Bonus: All trading volume generated from August 8 to August 9 enjoys a 1.2x multiplier.
👉 Join Now: https://www.gate.com/campaigns/5715Event?pid=TG&ch=nSsLZDDi