Square
Following
Hot
News
Profile
Share your thoughts
placeholder
Article
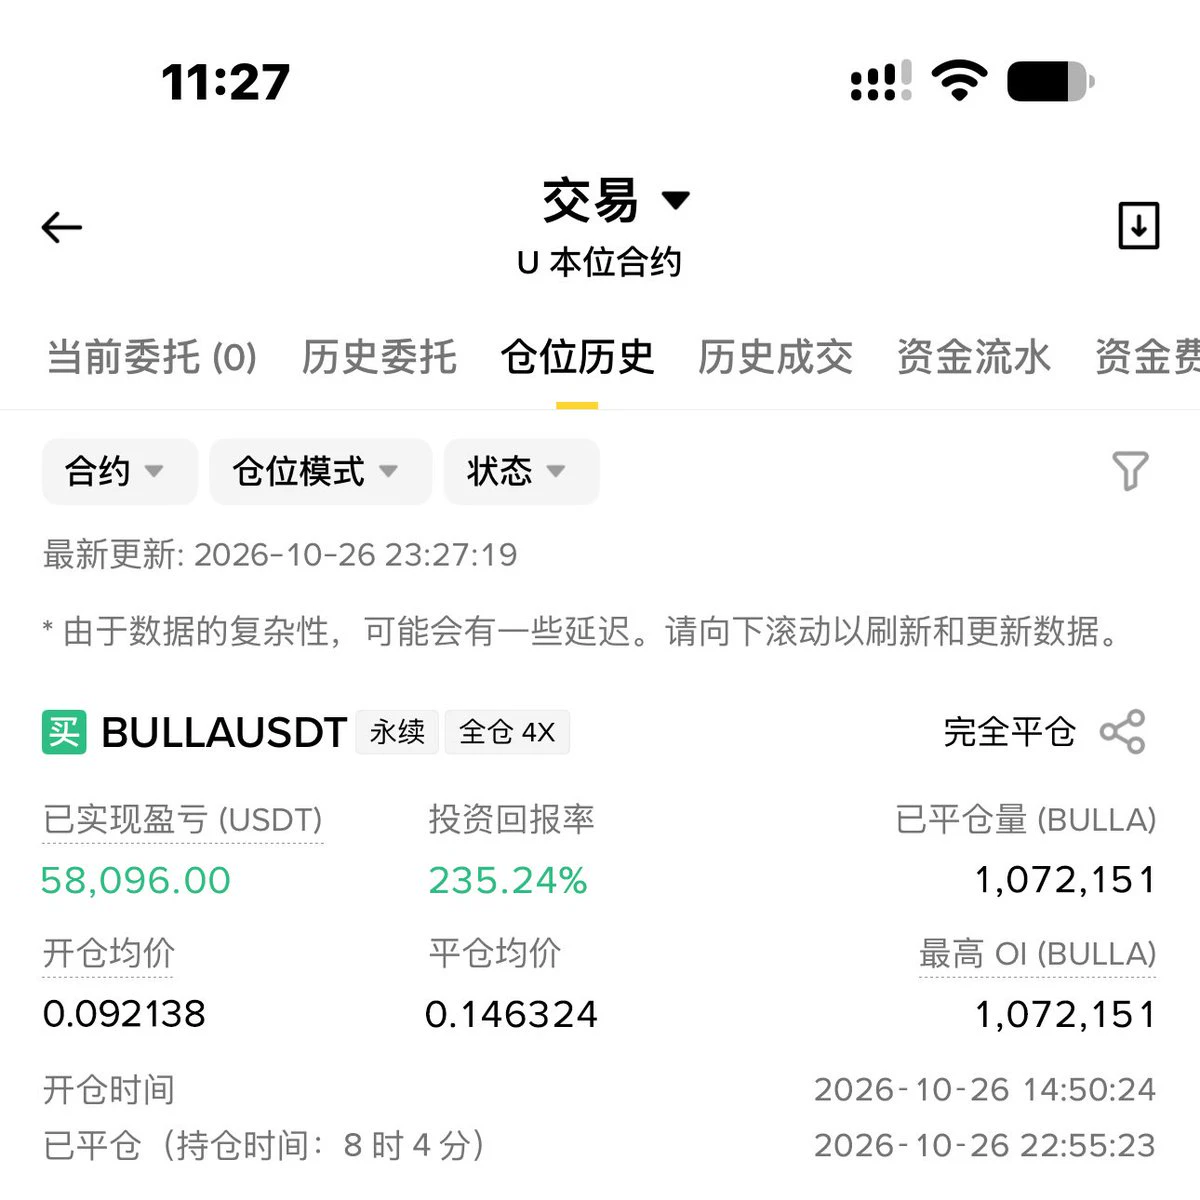
In 8 hours, net profit of 50k U. BULLA’s 234% gain this time was luck, but also a great example of building experience with a solid MACD strategy.
Many people think meme coins run on news, but MACD had already given the signal before the move began.
Meme coins never give you a heads-up, but they always leave footprints. A golden cross above the MACD zero line, consecutive expansion of the red bars, and rising trading volume—that’s the footprint.
For new retail traders looking to catch the explosive move, remember this: trend sets the direction, pattern sets the entry, and volume confirms the m
post-image
BULLA+10.92%
Hedge funds hold $2T in US debt, but next trade may need fewer bonds
Washington has grown used to hedge funds buying its debt, even though those purchases depend on trades that can become less attractive.
Quick Take
⚠️ Personal market analysis only. NFA — manage risk and DYOR.
Educational content, not investment advice or a recommendation to buy, sell, deposit, or withdraw any asset. No paid promotion or referral/affiliate links.
post-image
Trenches
STONK
S
bade
b
STONK
6GmA...UNgx
Market Cap
$.
Change
.
24h Vol
$.
Holders
.
LAUNCH
L
bade
b
LAUNCH
AhBi...Qj6C
Market Cap
$.
Change
.
24h Vol
$.
Holders
.
CNPY
C
bade
b
CNPY
0xc6...ddd2
Market Cap
$.
Change
.
24h Vol
$.
Holders
.
ZIG
Z
bade
b
ZIG
0x8c...1145
Market Cap
$.
Change
.
24h Vol
$.
Holders
.
BTC
B
bade
b
BTC
C5xp...pump
Market Cap
$.
Change
.
24h Vol
$.
Holders
.
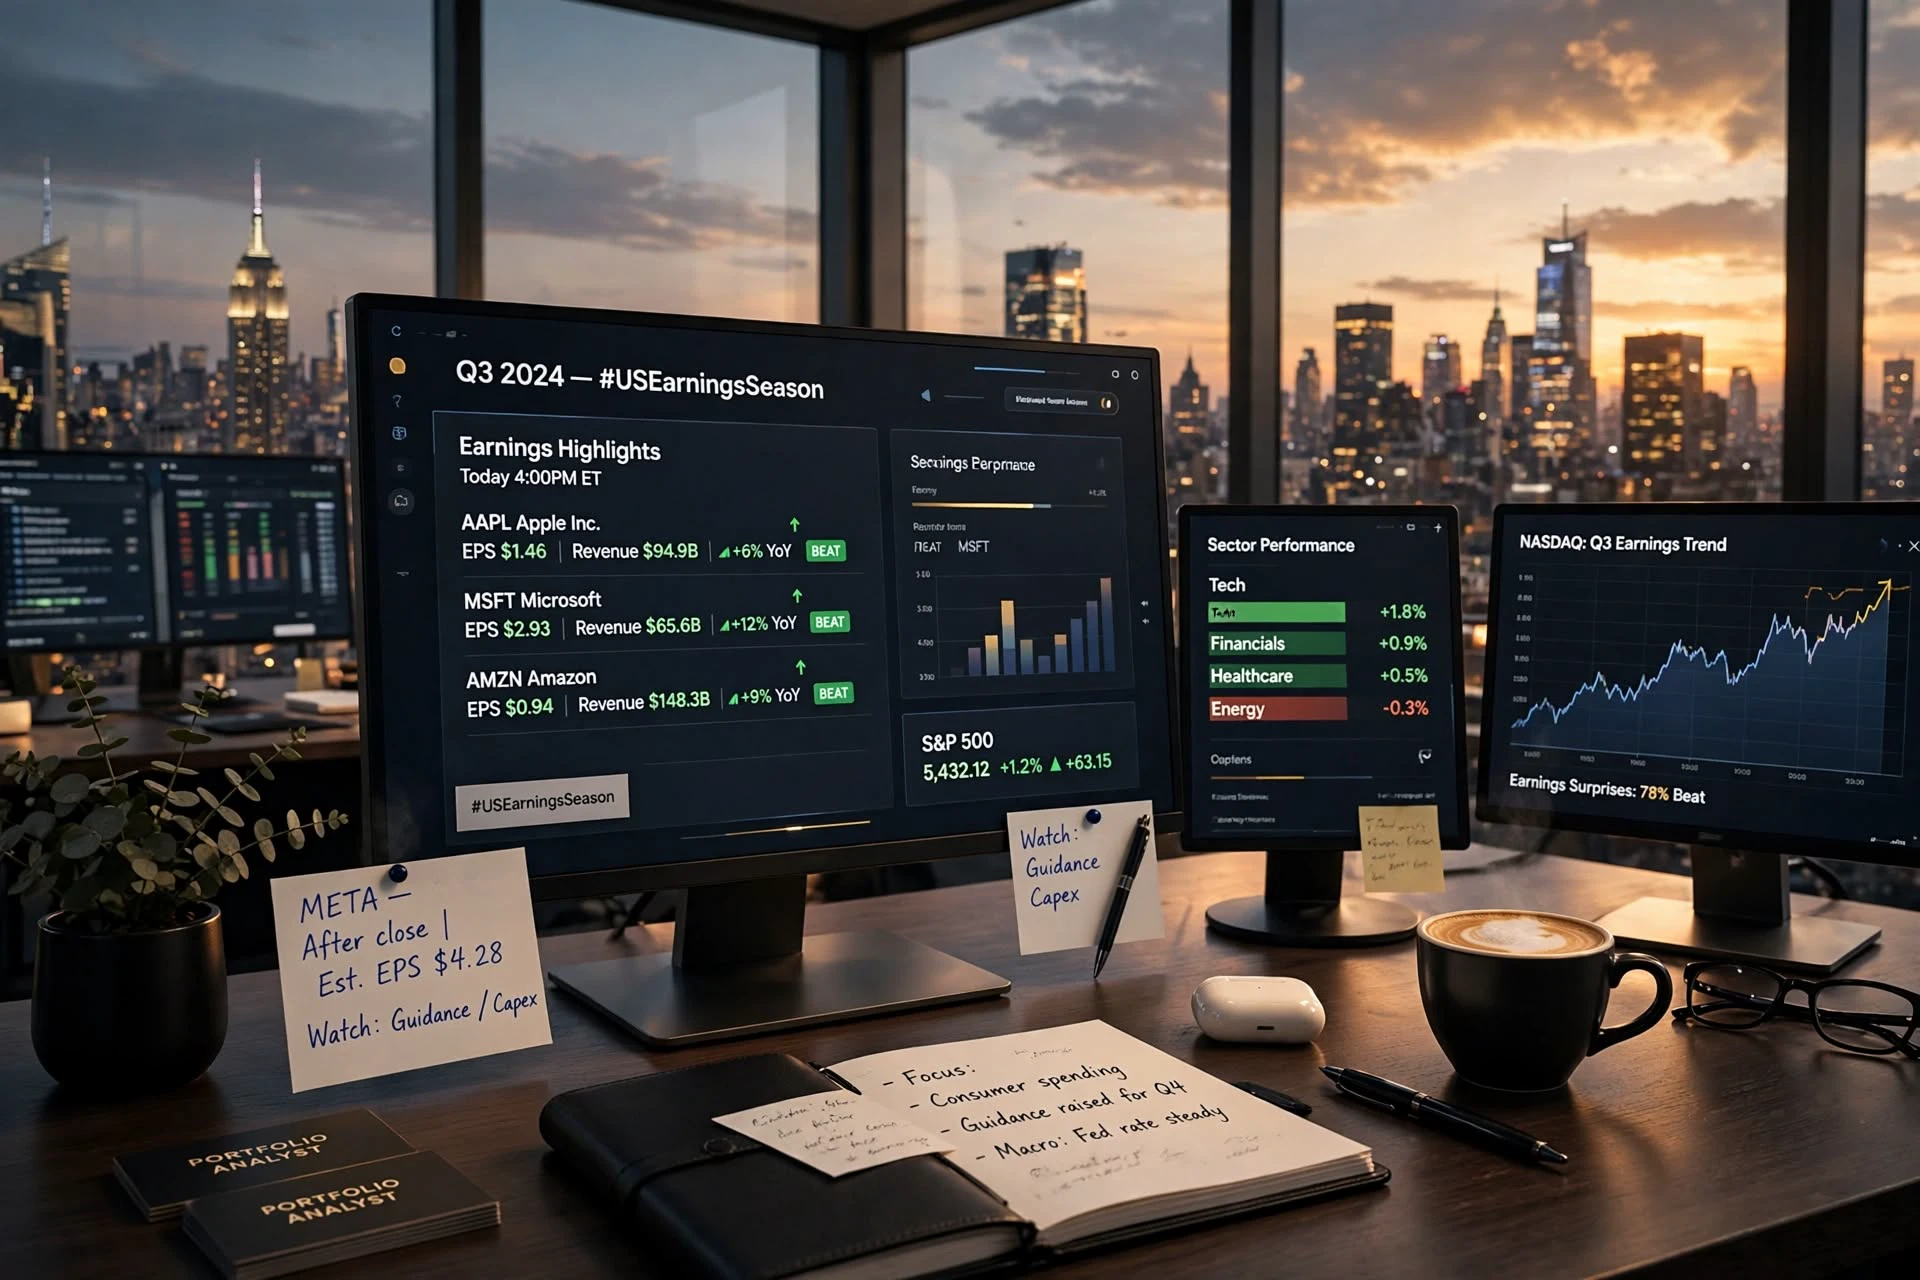
#USEarningsSeason
US Earnings Season: Corporate Results Could Shape the Next Market Move
US earnings season is one of the most important periods for global financial markets. Investors closely examine quarterly reports from major American companies to understand whether businesses are growing, whether profits can meet expectations, and whether the economy remains strong enough to support future earnings.
During this period, stock prices can react sharply to revenue figures, earnings per share, profit margins, management guidance, and expectations for the next quarter. A company may report hig
post-image
  • 2
GM, it won’t be long anymore before you will wake up financially free
post-image
$BR I missed this entire move and had to pay six figures in tuition before learning not to chase highs. It's at 0.5286 today, up 20.68% in 24 hours, with a low of 0.4286 and a high of 0.5337, and 48.1M in trading volume—anyone else in the group place a 0.45 limit order last night that didn't fill? Drop a 1 so I can see.
Back to the chart. What’s interesting about this move isn’t the gain, it’s the volume. 48.1M in trading volume alongside a 20% range shows real turnover, not some fake move driven by a few orders. In the 0.4286–0.5337 range, buyers from yesterday likely got in around 0.47–0.50.
BR+6.00%
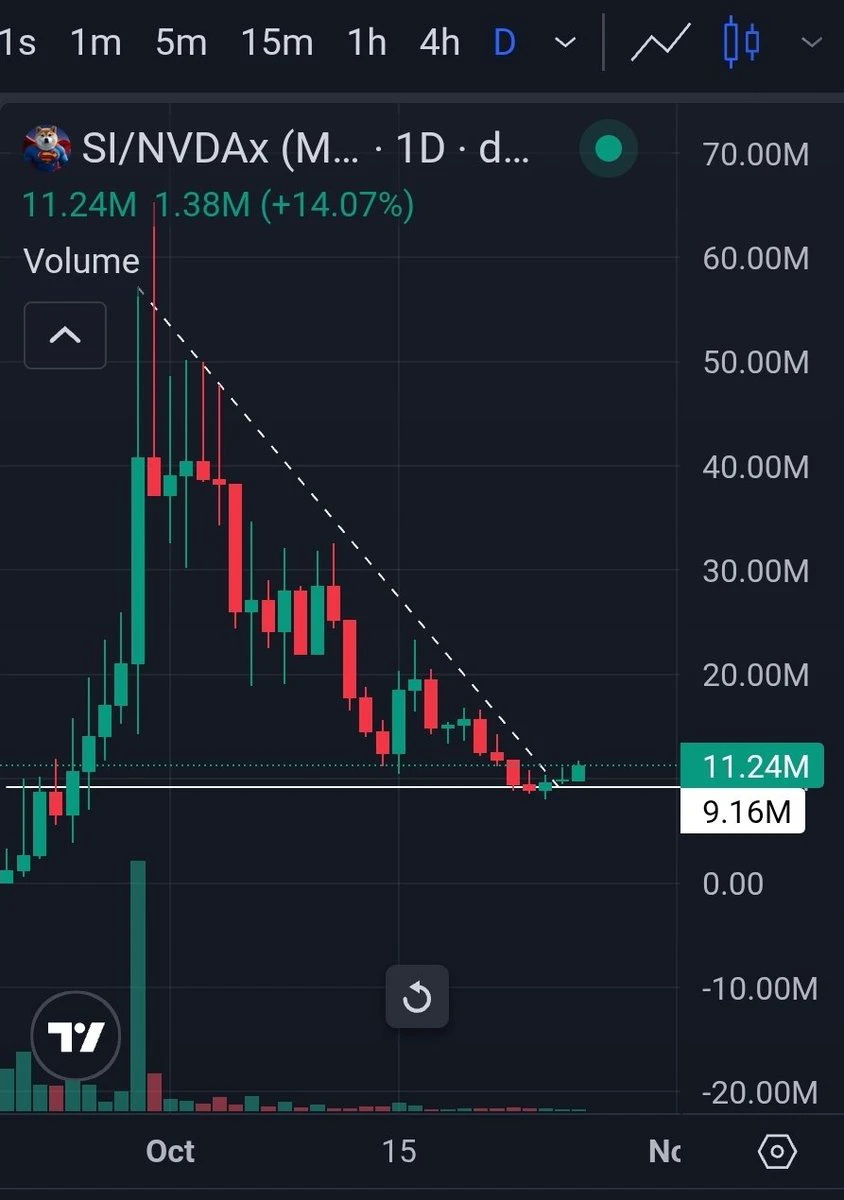
Impressed by the daily price action on $SI / @SuperinuOG.
Although onchain markets are still shaky and there's a lot of fear in the market, $SI has broken its downward trendline and is on its way to closing its 3rd consecutive daily candle in the green.
It hasn't done this since its run up to ATH at 65M MC.
With $STONK also reversing, I actually see $SI becoming the #1 meme on their platform, accruing buying pressure from the STONK ecosystem.
The Midterm elections are also right around the corner. Expect a lot of bullish catalysts and mentions of superintelligence.
Target remains 200-300M MC o
post-image
SI-0.73%
STONK+11.55%
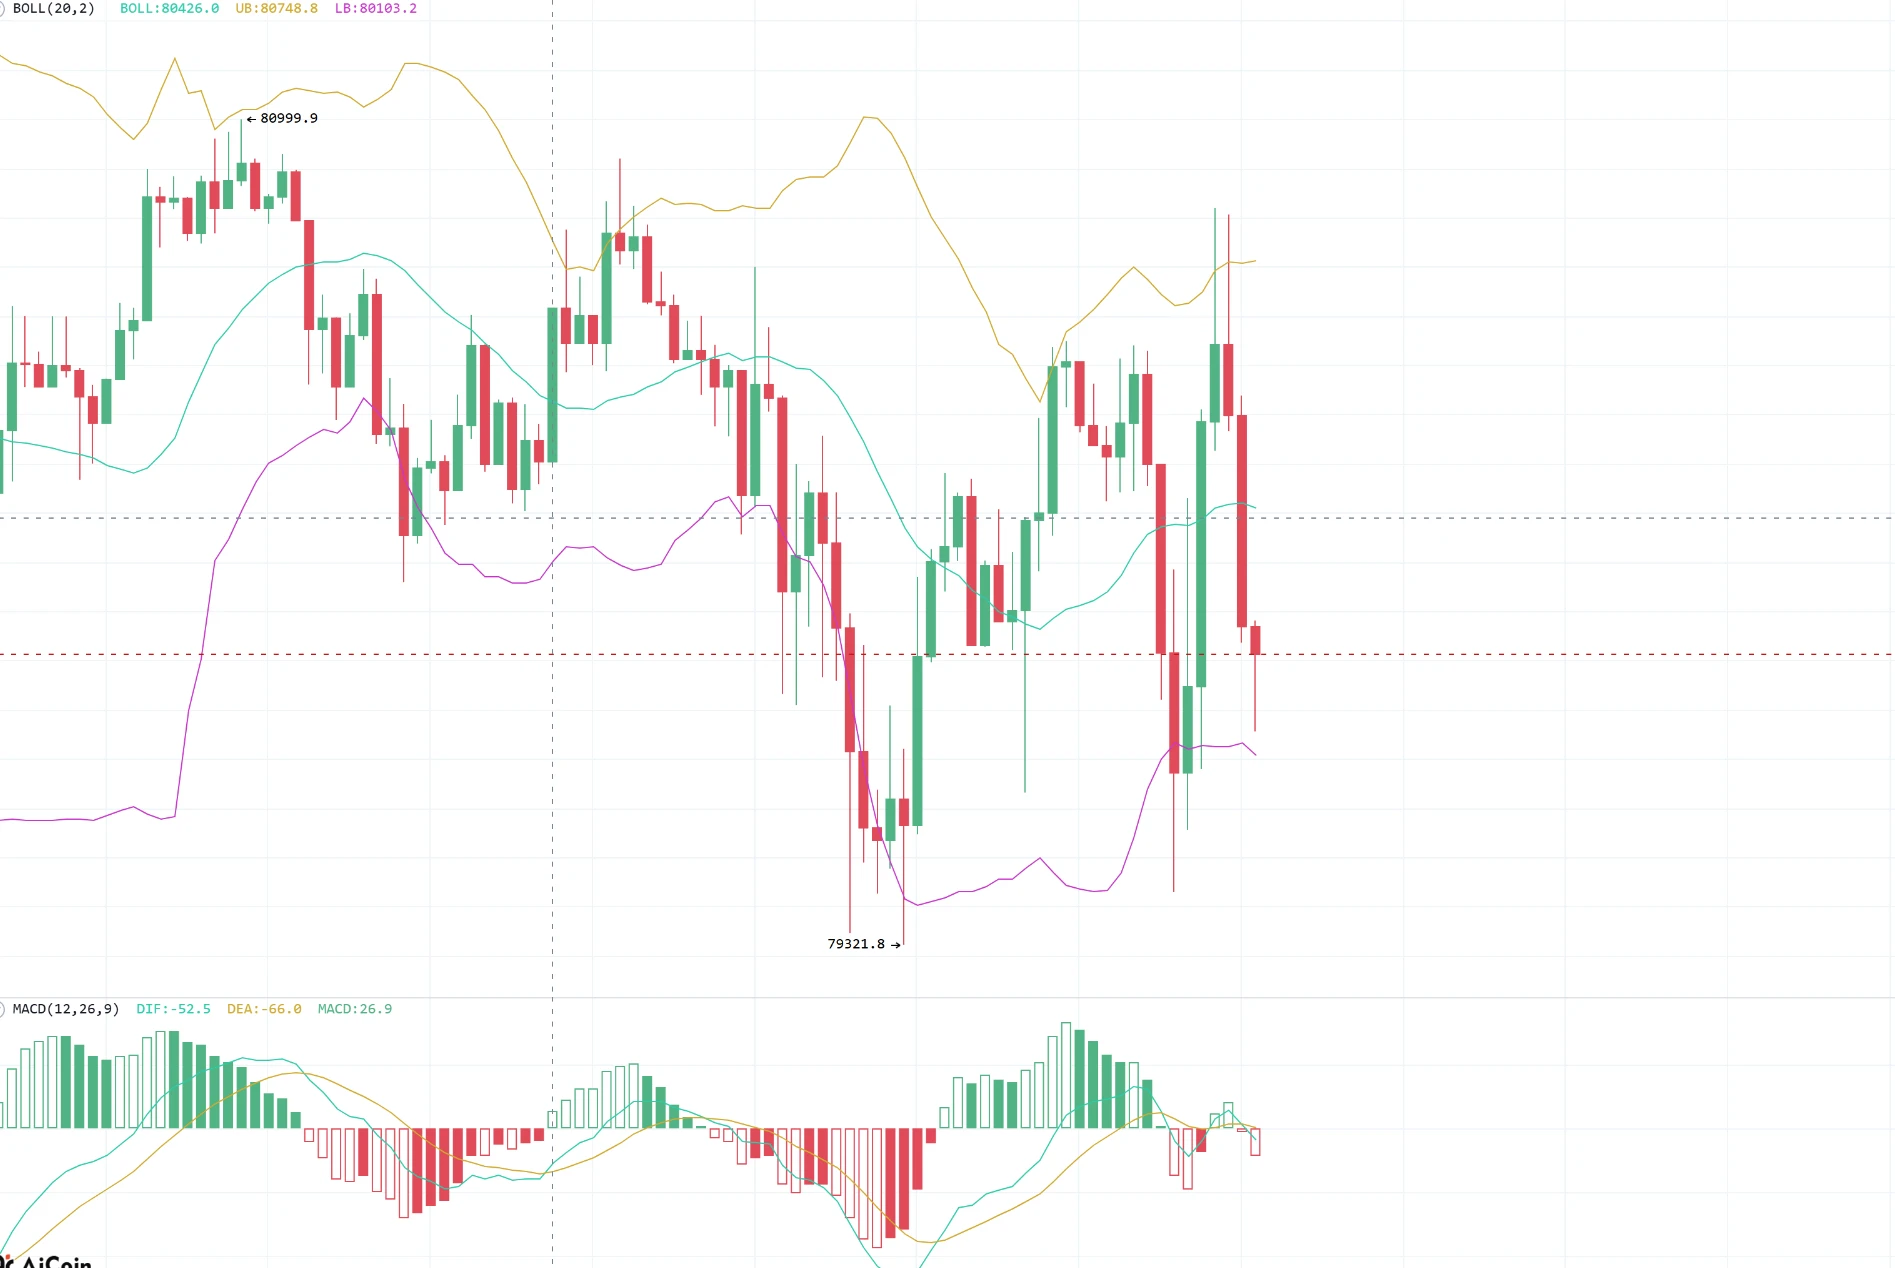
10.27 BTC Early-Morning Market Analysis
BTC=Market=Price pulled back from the interim high of 80999, tested a low of 79321, then staged an oversold rebound. After rebounding to around 80700, it came under renewed pressure and weakened. It is currently trading at 79897 below the Bollinger Band midline. The Bollinger Bands are contracting, indicating that short-term downside momentum has eased and the market has entered a choppy recovery phase. The MACD formed a golden cross below the zero line, and the red bars have continued, giving the short term momentum for a rebound and recovery. However,
post-image
BTC-0.65%
altcoins face more selling pressurre
live-cover
LIVE2,266
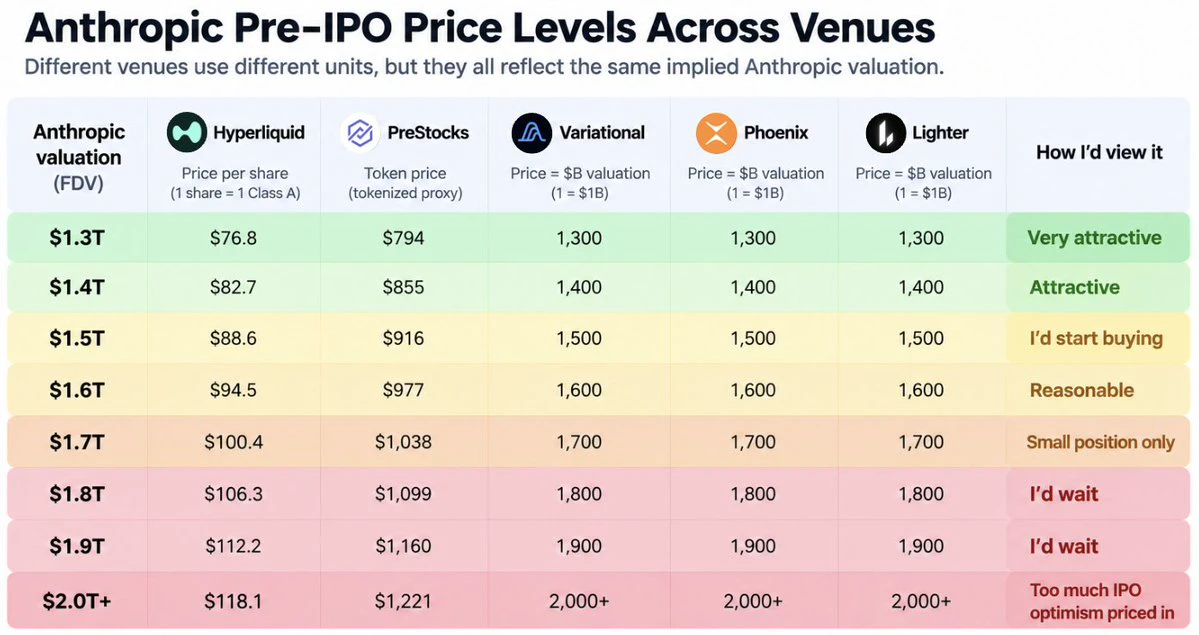
I think I found a way to buy Anthropic ~10% cheaper
But there's a (big) catch
Anthropic is now tradeable across multiple onchain venues, but not all of them are selling you the same thing...
There are basically 2 models:
1. Hyperliquid, Variational, Phoenix & Lighter
These are derivatives
You're simply betting on Anthropic's future price/valuation
No Anthropic shares sit in your wallet, you aren't a shareholder and you don't get voting or ownership rights.
Hyperliquid tracks the expected price of 1 Class A share
Anthropic's S-1 implies ~16.94B fully diluted shares.
So:
$111 × 16.94B = ~$1.88T
post-image
ANTHROPIC+0.63%
HYPE+0.33%
LIT-4.42%
USDC+0.01%
$BTW Once the funding rate hits -2, the damn market maker’s dump is imminent. Short ASAP. BTW, tonight is almost over.$BTW
post-image
BTW-7.75%
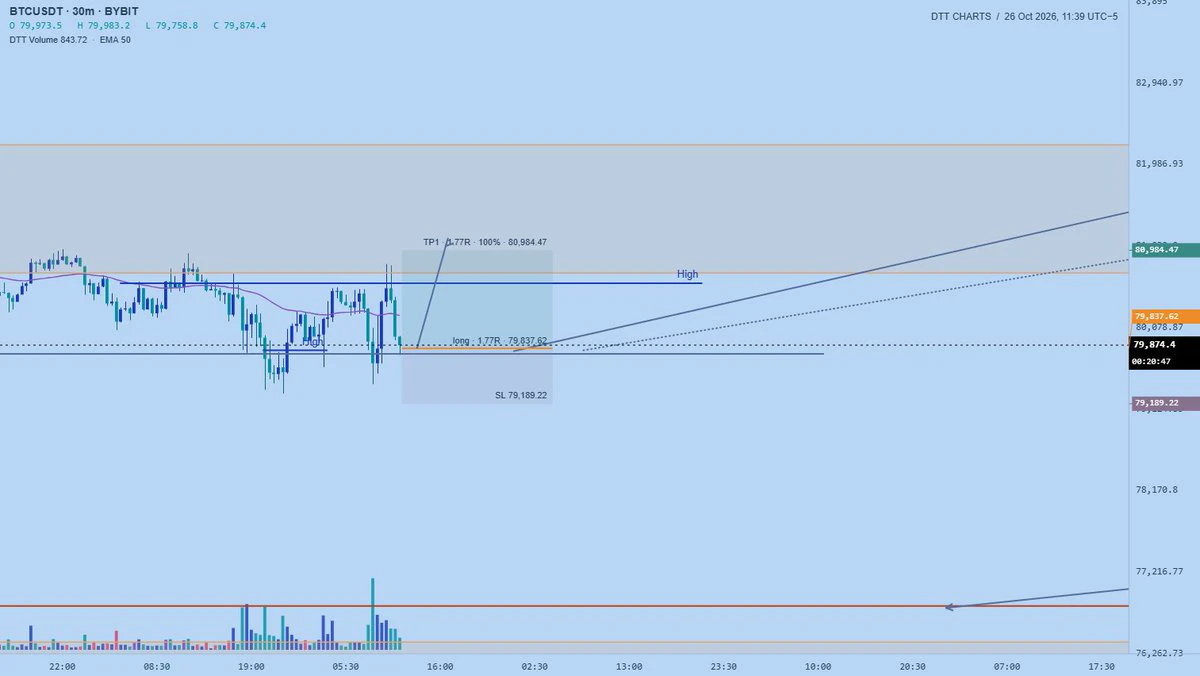
$btc scalp long
post-image
BTC-0.65%
📰 ANTHROPIC REVENUE UP AROUND 1,200%
🔹 AI company Anthropic reports sharp revenue growth
🔹 Growth of around 1,200% driven by demand for AI services
🔹 Many companies are starting to adopt AI solutions for their businesses
🔹 Major partnerships with tech giants are also helping drive growth
🔹 The AI trend is expected to continue developing rapidly
💡 Impact on Assets:
• $BTC — Technology adoption = more institutions entering digital assets
• $BNB — AI integration into ecosystems strengthens token utility
• $PAXG — AI drives economic growth = hedges become more popular
Do you think AI wil
post-image
BTC-0.67%
BNB-0.76%
PAXG+0.37%
$XRP : What matters this time isn’t simply whether it will “go up” or “go down,” but which of the two nearby boundaries price actually deals with first after reaching 1.3008. Rather than picking a side, first check for a touch, a breakout, and whether price holds. Touching resistance is just a test; moving above it intraday is a breakout attempt; only closing above it and staying there with supporting volume comes closer to a confirmed hold.
The price is currently looking for direction between 1.2733 and 1.3109. Only once it truly moves out of this range will 1.2546 or 1.3307 become the next us
post-image
XRP-1.15%
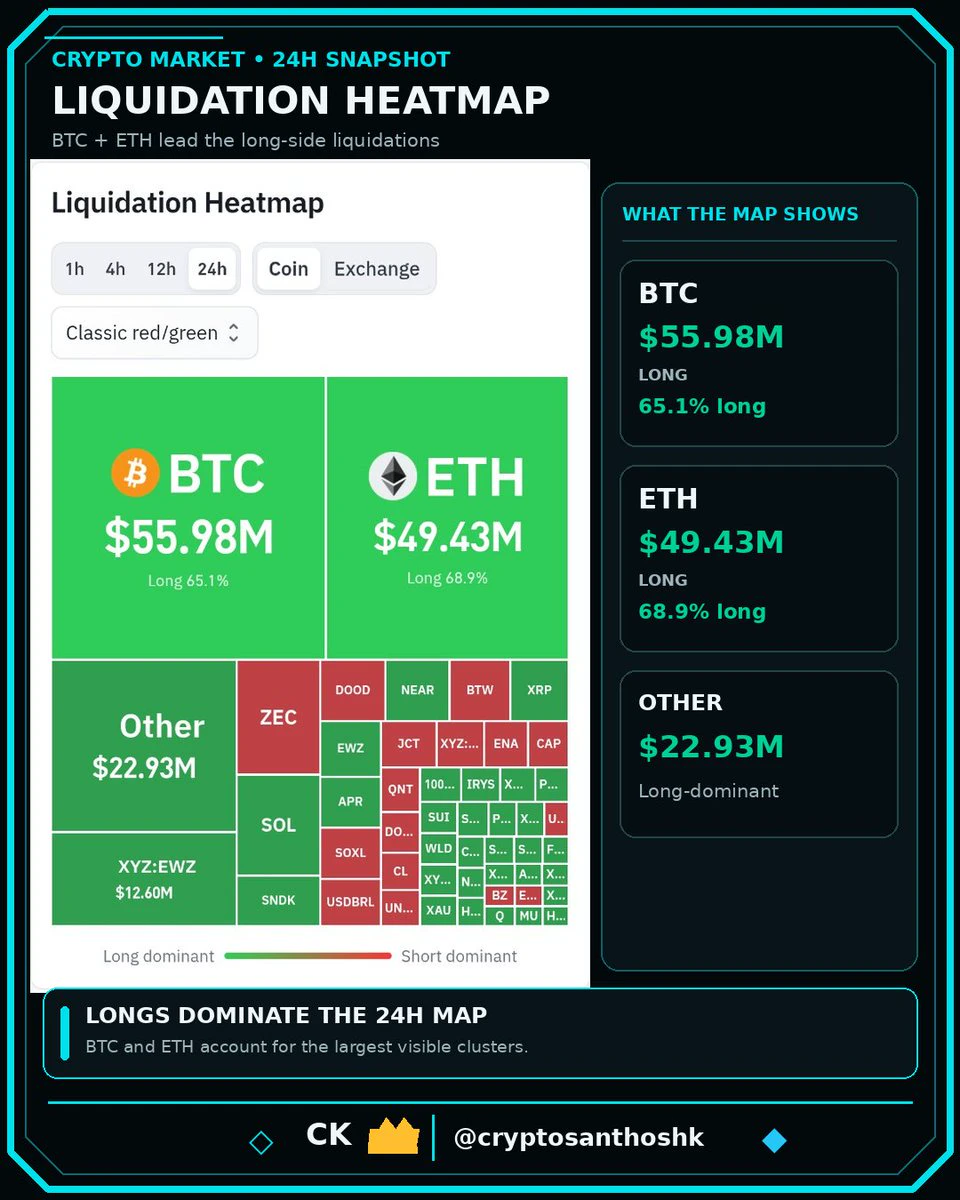
Market has been punishing today.
Insane liqudiaitions around Bitcoin happening as we speak.
post-image
BTC-0.65%
$BEAMX After a 17% rally, I’m still holding half my position in my live account—here are the numbers first: current unrealized profit is 11.3%, entry cost is 0.00305, and I’ve moved the stop-loss up to 0.0031, the breakeven point. Tonight, either I catch the main rally or get stopped out flat.
Here’s the full plan—just follow it: Split the entry into two buys: take a 30% position at the current price of 0.0034, then add 20% if it pulls back to the 0.00315–0.0032 range. Keep the total position at or below 50%; don’t gamble with a full position. Set the stop-loss at 0.00295, just below the 24-ho
BEAMX+5.82%
Bitcoin is now like a spring compressed to its limit. Nine days of narrow-range consolidation have compressed the 30-day price range from 13% to 6%, and historical patterns tell us that the longer volatility contracts, the more forcefully it tends to be released once a direction is chosen. The actual move could far exceed the $2,100 suggested by the current ATR. Heavily betting on a direction at this point offers an unfavorable risk-reward.
Technically, $82,700 is the invalidation level for the medium-term bearish structure. Until the daily chart closes back above this area, price remains rang
post-image
BTC-0.67%
IBIT-1.08%
ETH-1.26%
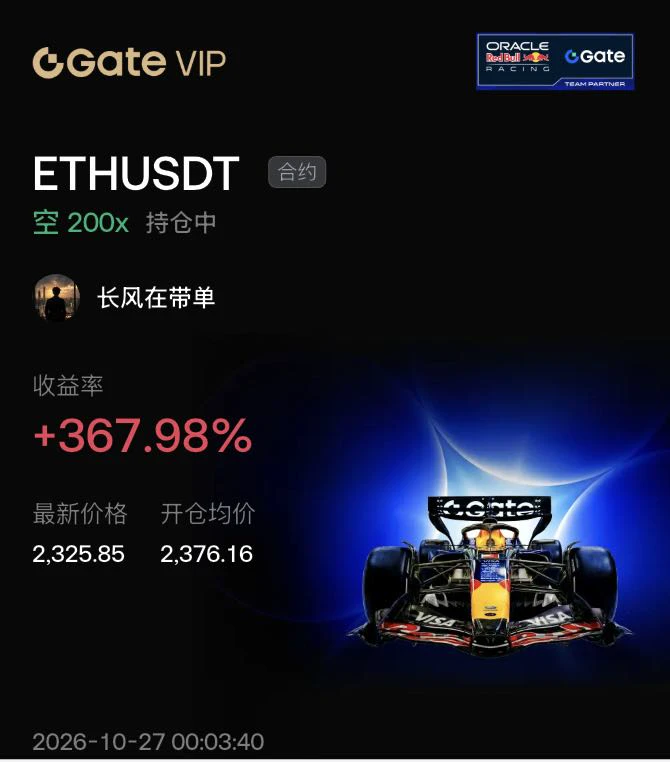
$ETH Ethereum is testing the market’s confidence. The next move depends on whether real demand can absorb selling pressure.
Ethereum remains under pressure, with the $2,300 support zone now one of the key levels to watch. The recent pullback is about more than just falling prices; it reflects a broader battle: sellers are reducing their risk exposure, while buyers are weighing whether current valuations offer enough reason to enter. I believe the market could still recover, but a temporary bounce alone won’t be enough for a sustainable reversal. Price structure, trading volume, spot demand, an
post-image
ETH-1.23%
BTC-0.65%
  • 1
#USEarningsSeason
🇺🇸 US Earnings Season: The Numbers That Could Decide What Markets Do Next
Wall Street is entering another earnings-driven phase, and investors are watching more than just whether companies beat or miss expectations.
Every earnings season creates a fresh test for the market. Companies reveal revenue growth, profit margins, guidance, capital spending, hiring plans, AI investments, consumer demand and management expectations for the quarters ahead. These numbers can quickly reshape the outlook for stocks, technology, interest rates, the US dollar and even crypto markets.
For i
BTC-0.67%
$BEAT Show you skills. Up to 20x.
post-image
BEAT-1.19%
🔹 How to trade this action-packed week? Which will make the first major move—U.S. stocks, gold, BTC
live-cover
LIVE3,460
Load More

Join 40 M users in our growing community

⚡️ Join 40 M users in the crypto craze discussion

💬 Engage with your favorite top creators

👍 See what interests you

Trending Topics

USEarningsSeason

139.2k Views3.77k Discussing

The U.S. Q3 earnings season is in full swing, with major tech companies including Tesla and Meta reporting results. Market focus is shifting beyond revenue and profit toward AI spending, capital expenditure, margins and forward guidance. Which company’s earnings are you watching most closely?

GateWCTCS9GlobalTradingCompetition

845.76k Views8.35k Discussing

BTCBattlesFor80000

78.55k Views24.73k Discussing

View More