



Square
Following
Hot
News
Notifications
Profile
Share your thoughts
placeholder
Article
Mi Ge’s Crypto Trading Macro Cheat Sheet: 8 Key Indicators

1. CPI Consumer Price Index (month-over-month/year-over-year)
Meaning: The price increase for a basket of goods and services consumed by households; tracks consumer-side inflation.
>Above expectations: Inflation is elevated, rate cuts are delayed and rate hike expectations rise; Treasury yields and the U.S. dollar strengthen, bearish for crypto
<Below expectations: Inflation cools, rate cut expectations rise, bullish for crypto
Quick take: High CPI = sticky inflation, pressure on crypto; falling CPI = expectations of looser liquidity,
post-image
GAS-0.57%
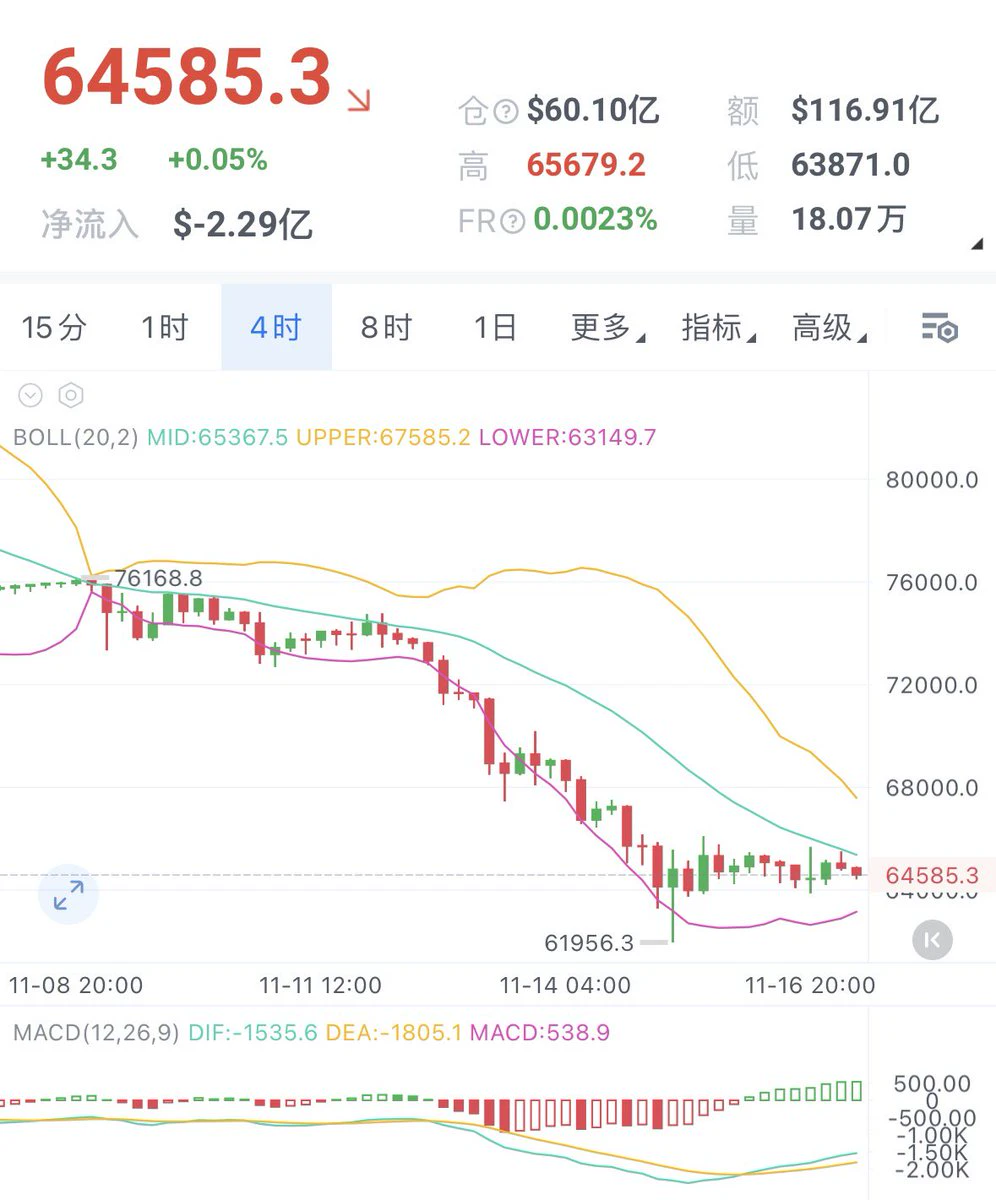
What’s interesting now is that the market is severely oversold, yet the rebound has been very weak. The daily RSI has fallen to 23.6. Although an oversold bounce is possible, being oversold does not mean the market has bottomed.

On the 4-hour chart, the RSI is 34.5, the MACD is firmly in bearish territory, and the price is below key moving averages. The bears remain in control.

Although the price failed to break below 62000 last time, it may test that level again.

Short at 65000–65400, stop-loss at 66100, targets at 63000 and 61200.
post-image
Trenches
BP
B
bade
b
BP
BPxx...jPCy
Market Cap
$.
Change
.
24h Vol
$.
Holders
.
BAWSAQ
B
bade
b
BAWSAQ
4La9...pump
Market Cap
$.
Change
.
24h Vol
$.
Holders
.
mihao
m
bade
b
mihao
4Cxj...pump
Market Cap
$.
Change
.
24h Vol
$.
Holders
.
Marvin
M
bade
b
Marvin
HkRQ...pump
Market Cap
$.
Change
.
24h Vol
$.
Holders
.
GTA6
G
bade
b
GTA6
4kjr...zDnz
Market Cap
$.
Change
.
24h Vol
$.
Holders
.
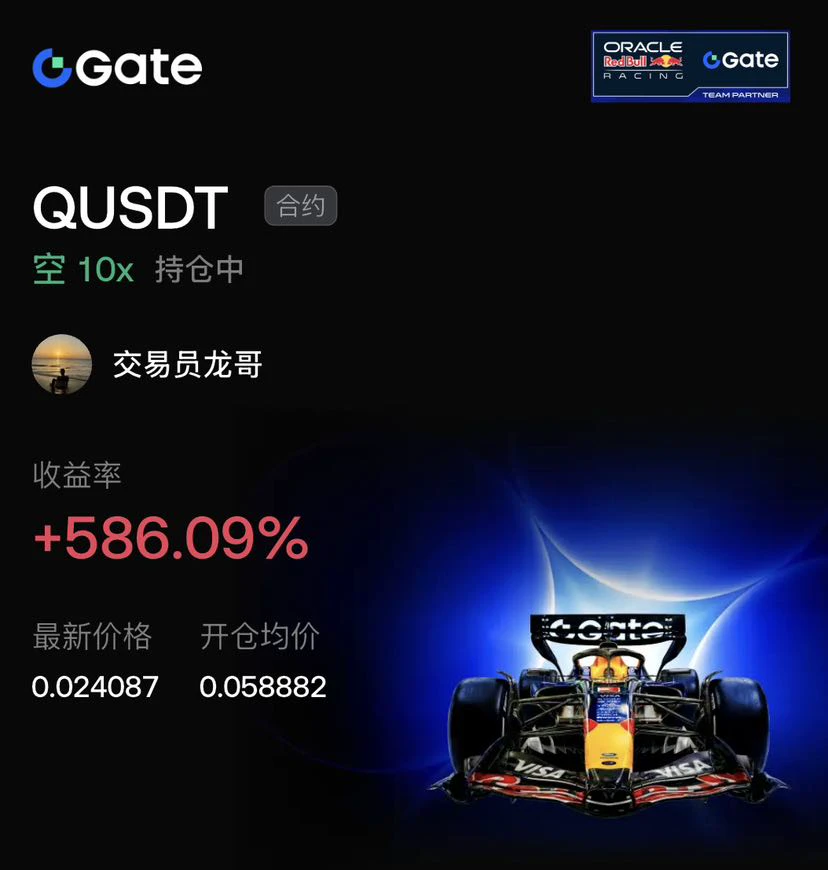
$Q The 10x leveraged short return surged to +586.09%! The average entry price was 0.058882, and as the broader market collapsed, the latest price fell to 0.024087. The position's profit went absolutely wild. This extreme one-way market perfectly captured the bearish trend.

After BTC plunged below the 70k mark, it rebounded to above 60k, with the market remaining weak and choppy. News triggered a sentiment collapse, and leveraged long positions were liquidated in a cascade. QUSTDT's rebound lacked strength, and the downtrend remains intact—don't get greedy.

Maintain strict risk controls and t
post-image
Q-27.77%
BTC-0.65%
MOVE-2.02%
Everyone talks about compounding, but I really can’t keep my hands off it. Moved 100 to spot. Taking today off. I keep blowing up: 0.8-320-0, 15-300-0. It’s been the same cycle all along. Need to adjust my mindset. Take it slow; don’t enter unless the price hits my target. $XAUUSD
post-image
XAUUSD+0.00%
  • 1
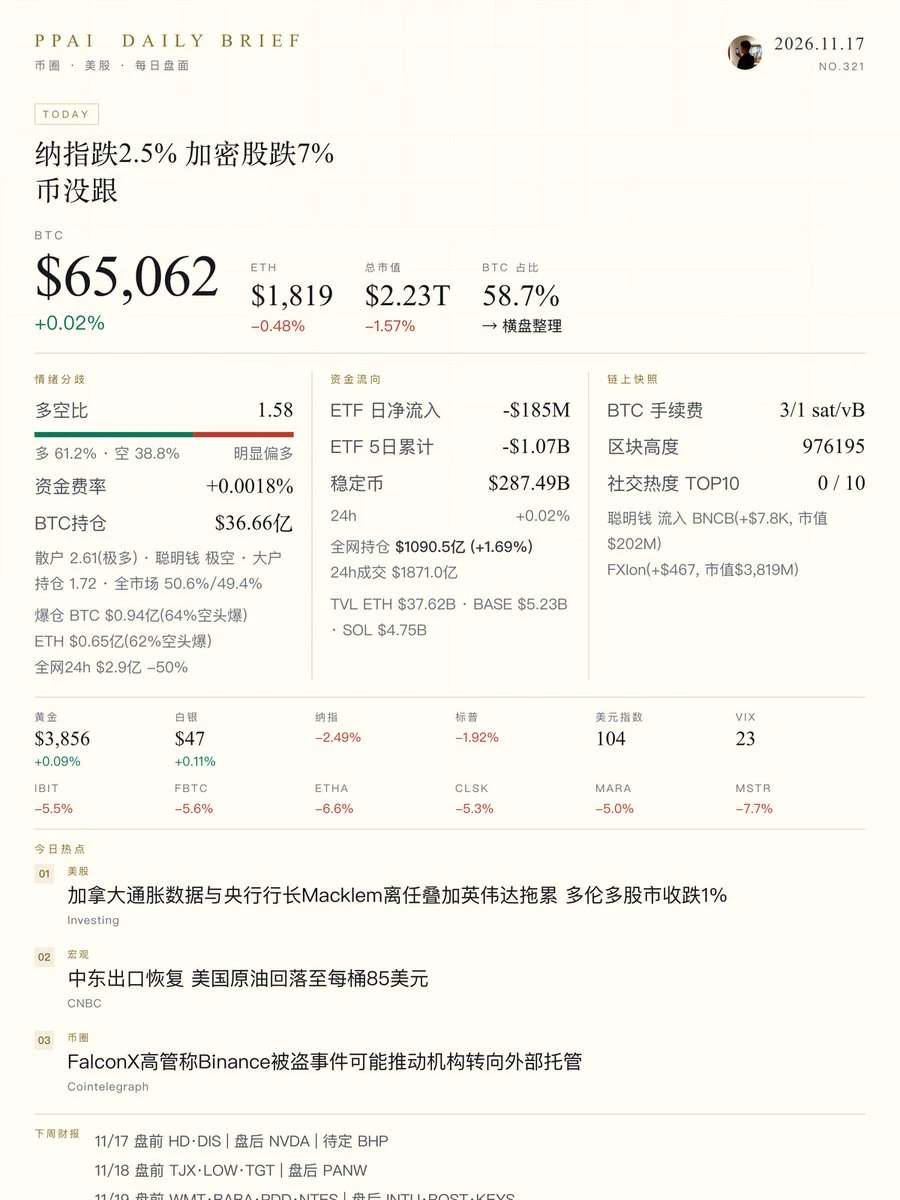
U.S. tech stocks suddenly plunge! Nasdaq falls nearly 2.5%, SanDisk drops over 8%—who’s quietly hitting the sell button?

Another dramatic moment in the U.S. stock market! Nasdaq falls nearly 2.5%, SanDisk drops over 8%, and tech investors may be in for another unpleasant trading day.
When the market falls, everyone likes to ask: Who’s selling? Are institutions pulling out? Are funds rebalancing? Or are investors starting to worry about future growth?
In reality, stock price swings are usually not caused by just one factor. Interest rate expectations, corporate earnings, industry valuations, f
SNDK-8.60%
  • 1
11.17 BTC Trading Plan
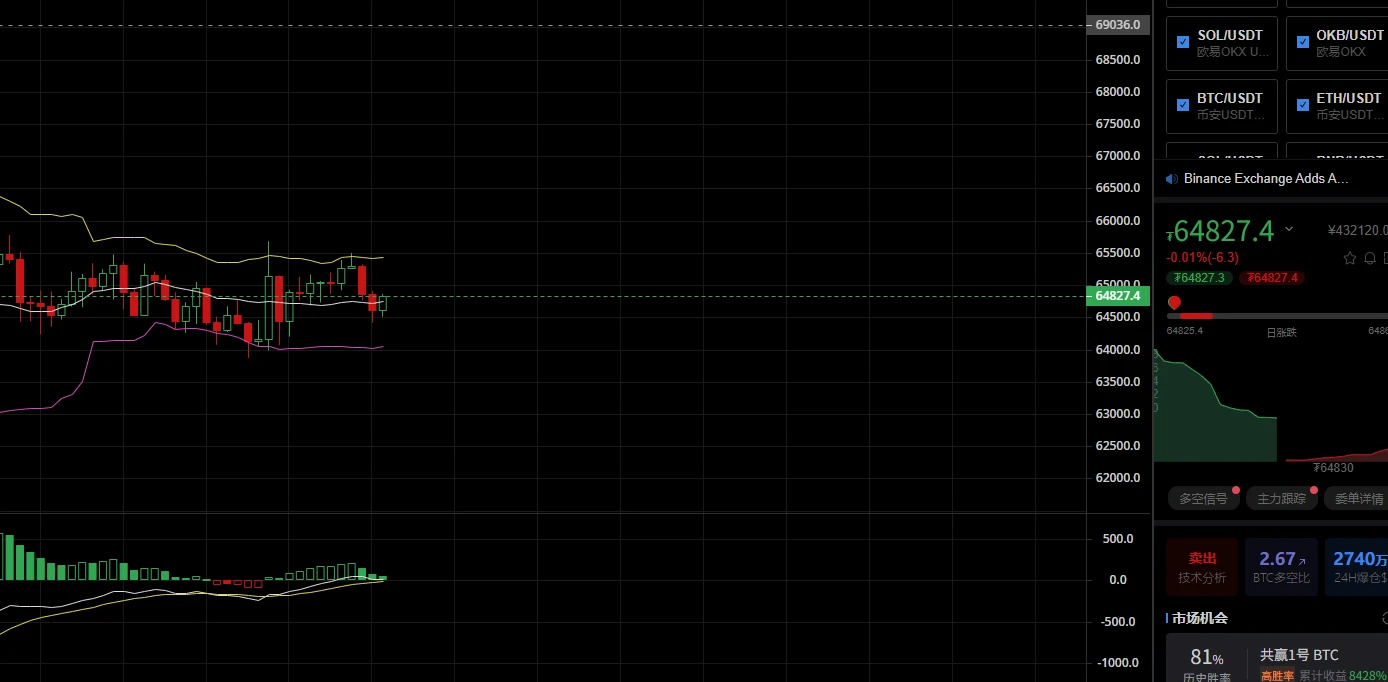
Market logic: The market is currently range-bound, with the hourly Bollinger Bands contracting. Buyers are stepping in at the support zone below, so only look to buy dips after a pullback stabilizes; don't chase the rally.

- Entry range: 64000 - 63800. Wait for a candle to show signs of holding support (a small bullish candle / long lower wick) before entering; don't place orders in advance
- Stop-loss: 63500. A decisive break below this level means support has failed; exit the long immediately and don't hold on
- Take-profit:
First target: 64900; take partial profit
post-image
BTC-0.65%
Whales Moves In Sync!
live-cover
LIVE1,739
$BTC Oversold for three days, yet unable to bounce. RSI 23.4 says it all: this isn’t a one-off sell-off, but sustained selling by someone. Futures open interest keeps rising as prices fall, with shorts continuing to pile on. ETFs have seen net outflows for seven straight days, with $2.1 billion withdrawn in November; compared with the $35 billion in net inflows in 2024, this year has flipped straight to net outflows. Long-term capital isn’t shaking out weak hands—it’s leaving with real money.
$ETH The 2000 level has been lost for half a month. The Glamsterdam upgrade could cut gas costs by 7
post-image
BTC-0.67%
ETH-1.26%
ZEC+1.16%
11.17 $SOL Today's Silk Road
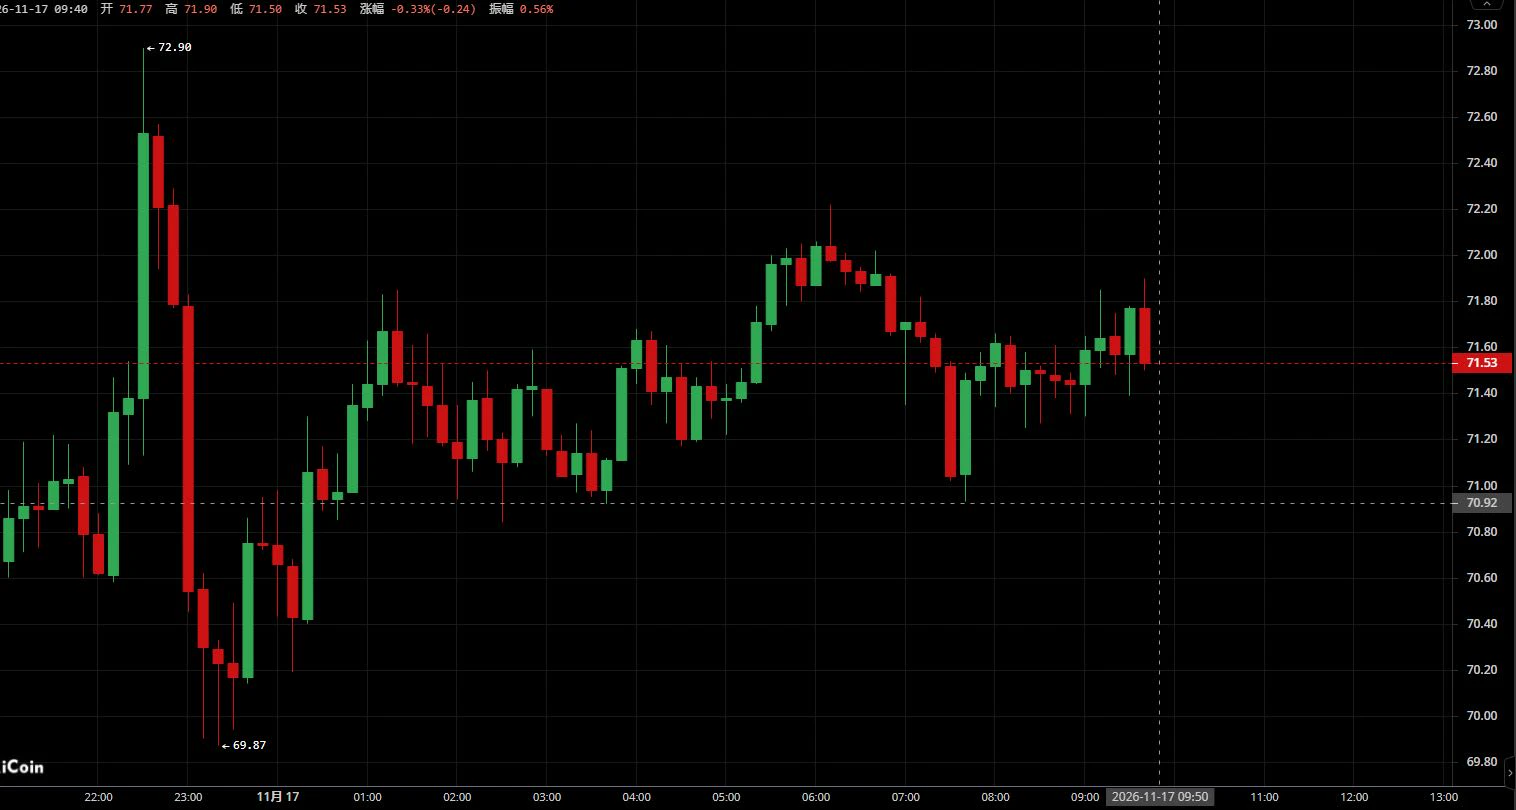
The weak, choppy pattern remains unchanged, with a feeble rebound
After rising overnight to around 72.90, the price met resistance and pulled back. The bullish rebound lacks sustained momentum, and the price has retreated to consolidate in the lower range. The overall downtrend has yet to reverse; the market remains in a weak recovery phase following the decline, and further downside is possible after the rebound encountered resistance.
#纳指跌近2.5%闪迪跌逾8%
Resistance: 72.0-72.3, 72.9
Support: 70.0-70.2, 69.8
Strategy: Prioritize short positions on rebounds; don't cha
post-image
SOL-0.77%
  • 2
  • 1
11.17 ETH Market Analysis

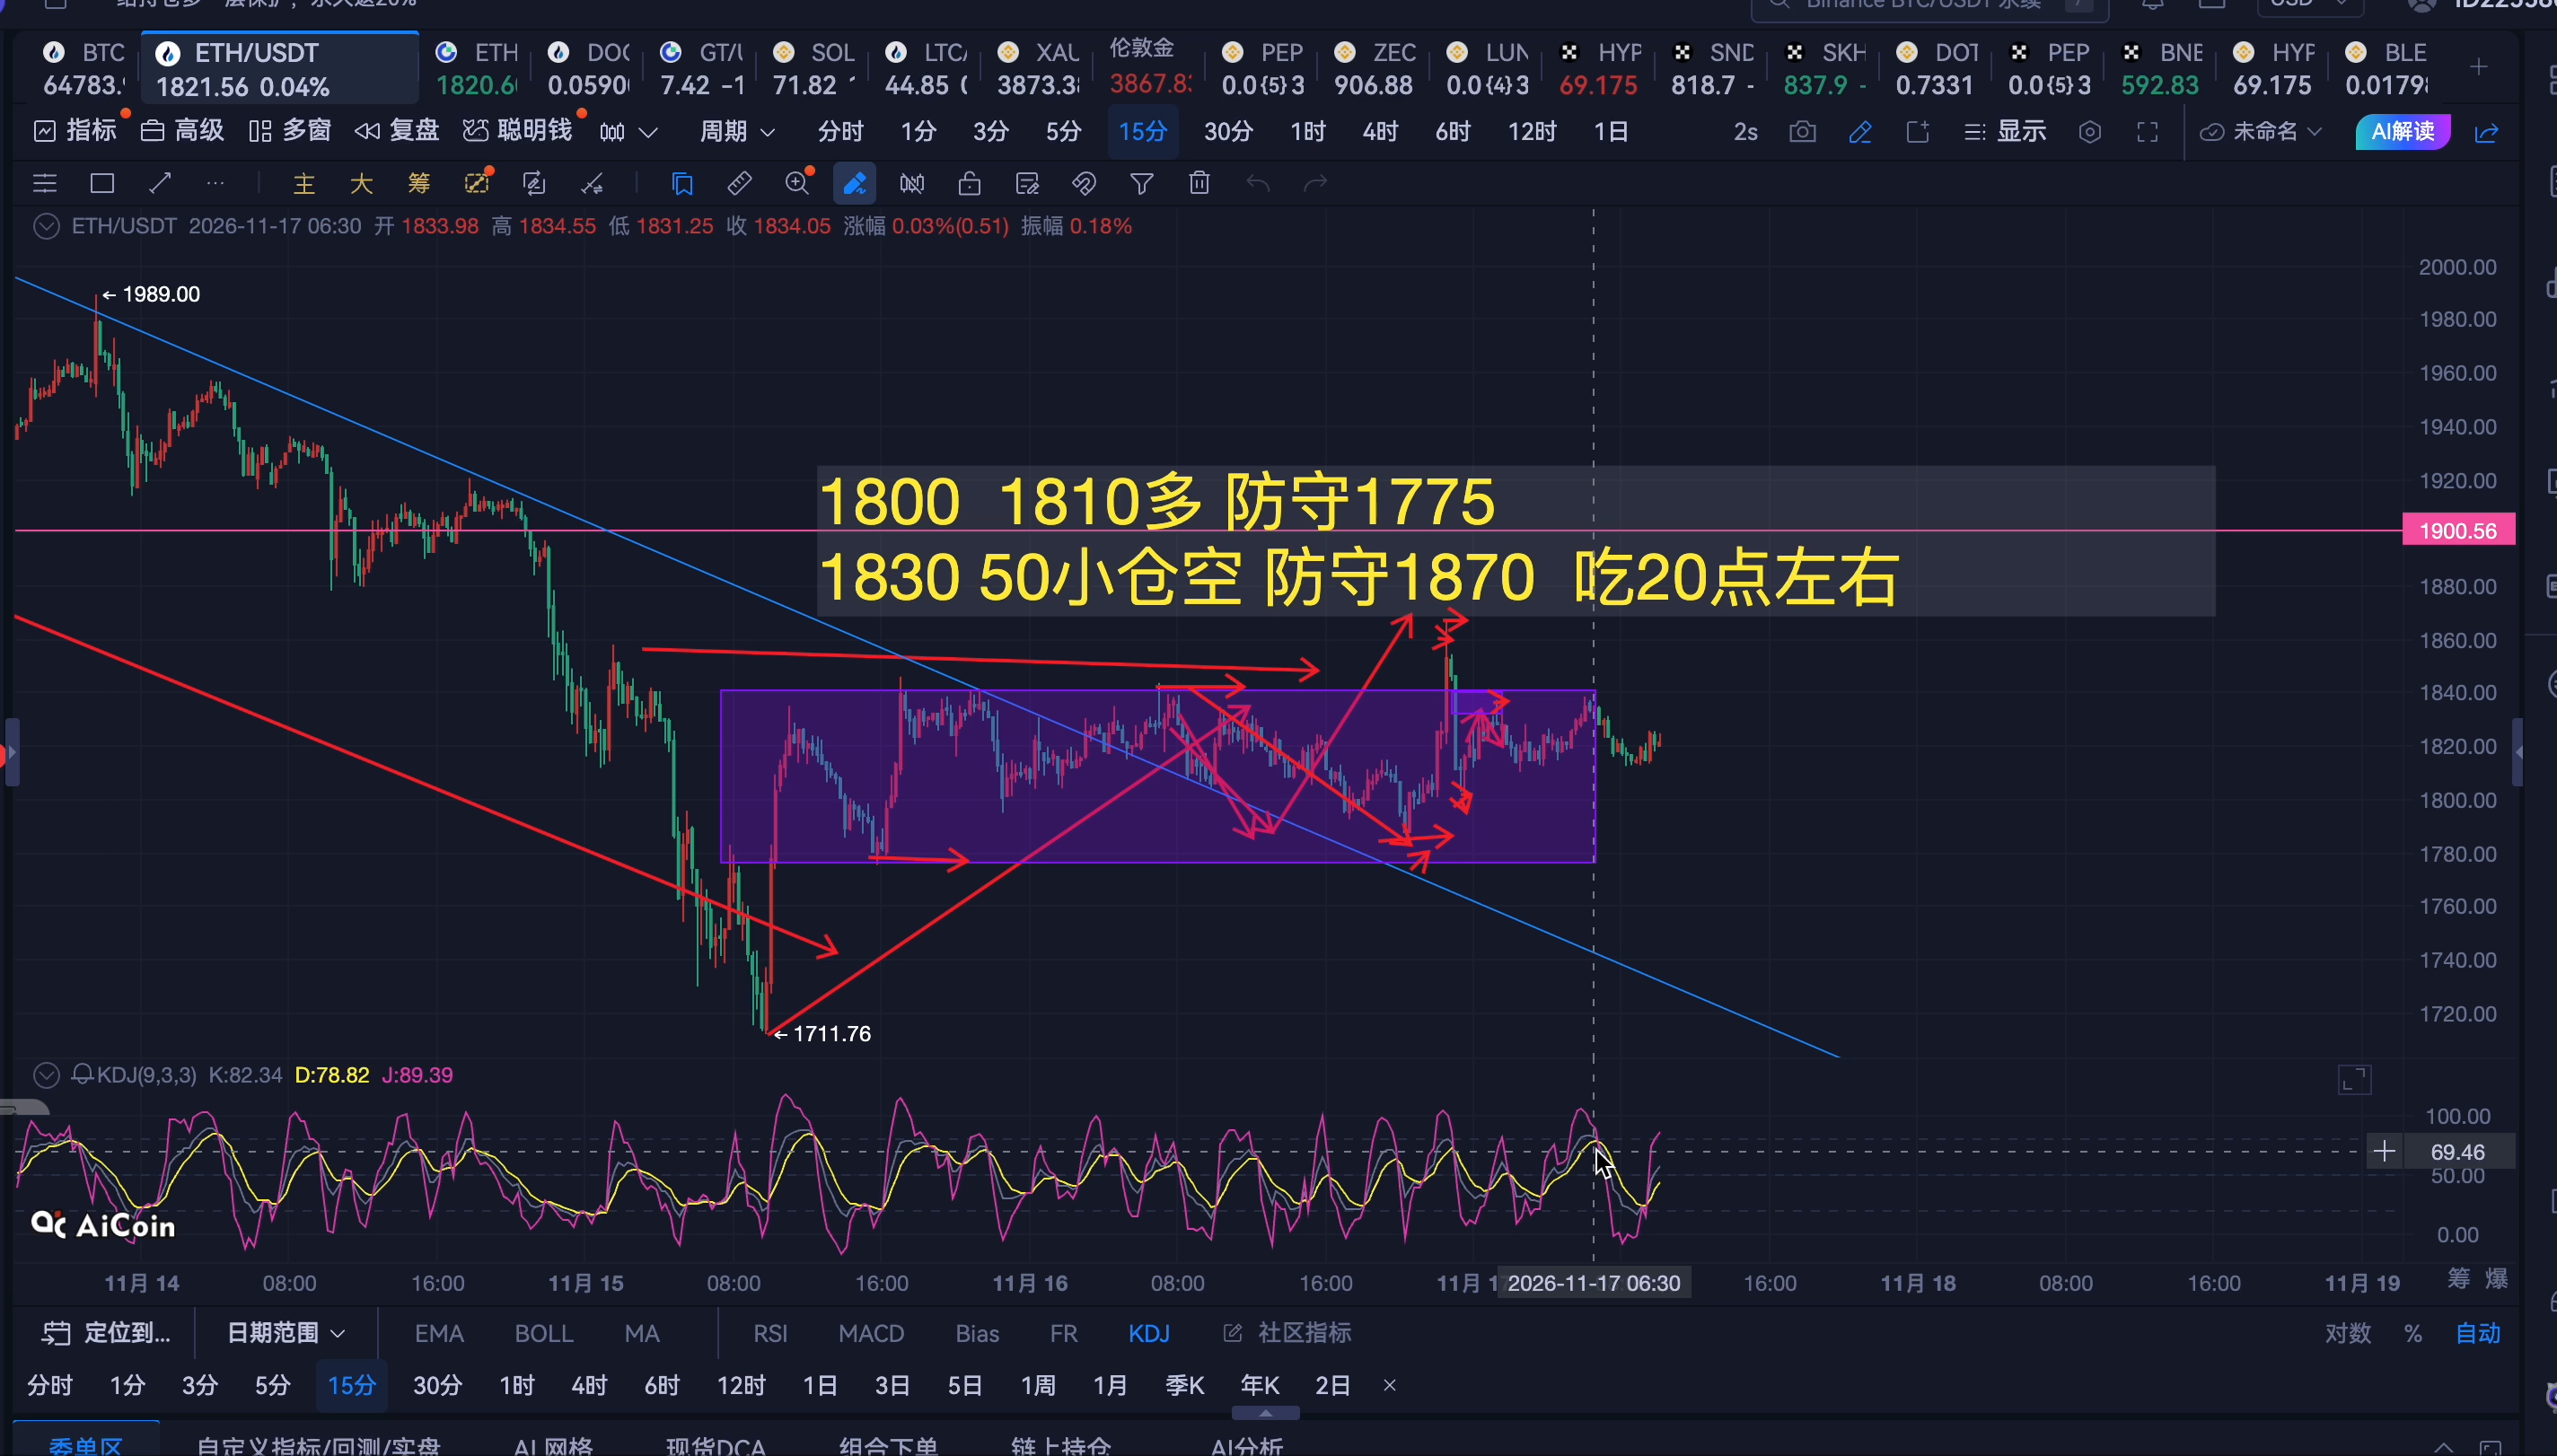
Short: around 1835-1850, stop loss at 1875, targets at 1790/1760.

ETH is currently at 1823. Since retreating from a peak of 1866, the market has failed to stage a meaningful rebound, with its center of gravity gradually moving lower. The moving averages are starting to form resistance above the price. Bullish upward momentum seems nearly exhausted, and the overall bearish structure remains solid.

At 1823, the current price is stuck in the middle, so opening a short directly risks getting stopped out by wicks in either direction. The 1835-1850 range above is a conso
post-image
ETH-1.23%
BTC ETH market
live-cover
LIVE1,911
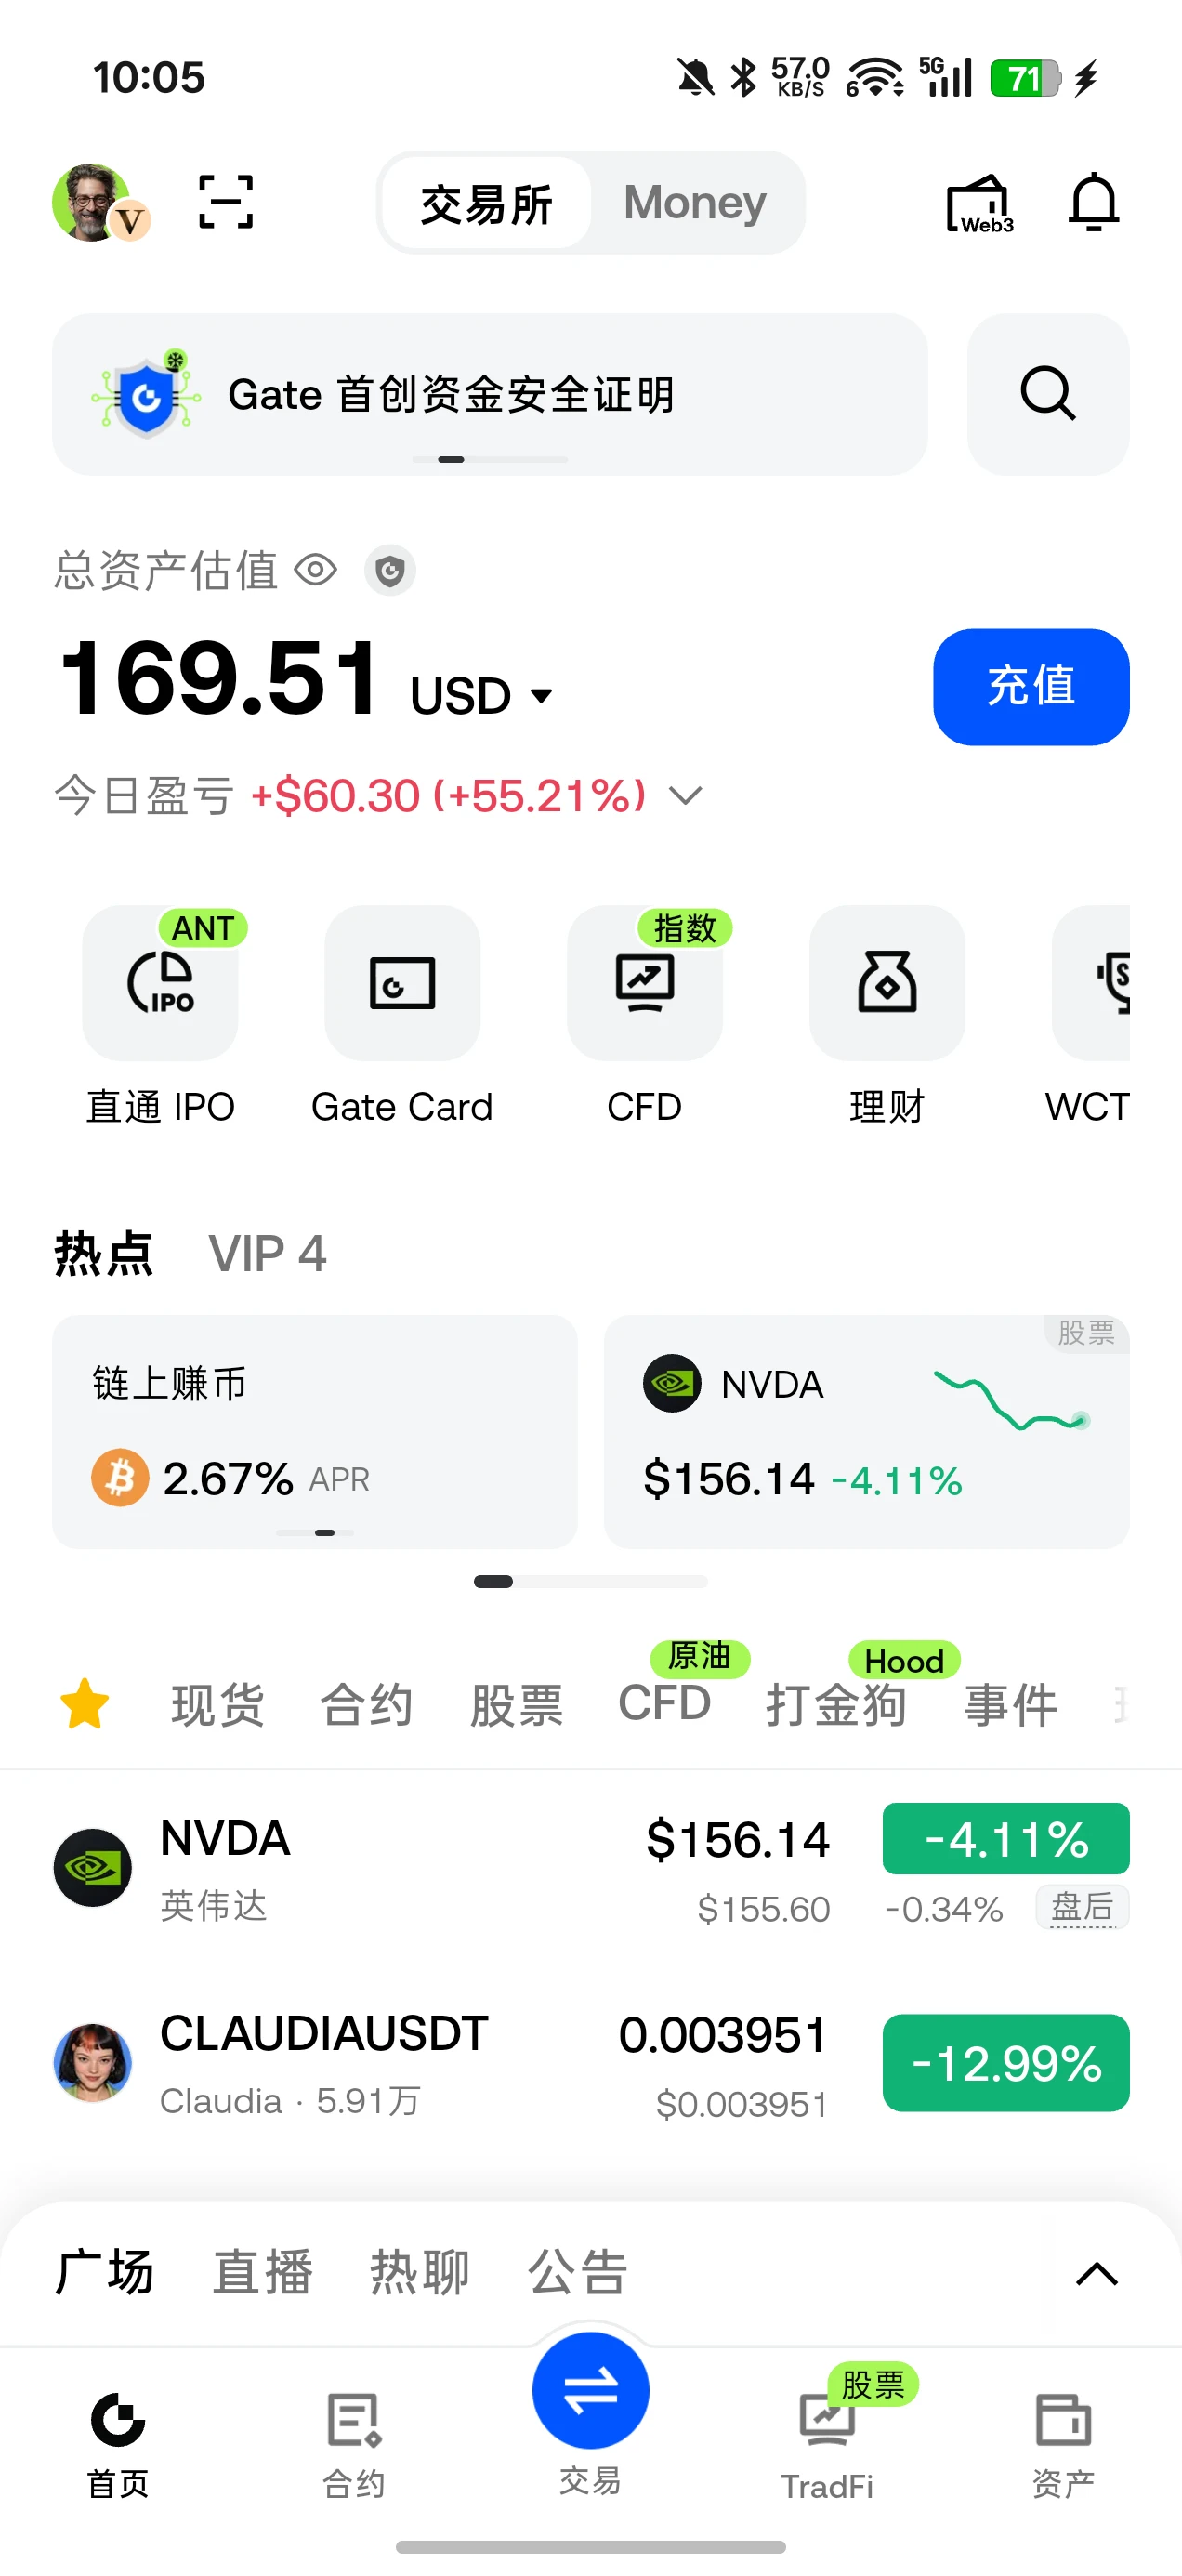
$NVDA The Q3 earnings report won’t be released until around 5:20 a.m. on the 18th, with a meeting at 6:00. Quite a few people will probably trade this today, betting on whether the stock will go up or down. We’ll know by tomorrow morning.
post-image
NVDA-4.11%
#GateIPOAccessAnthropic
FINAL 7 HOURS: ANTHROPIC IPO ACCESS ON GATE — WHY THIS OPPORTUNITY MATTERS, HOW SUBSCRIPTION WORKS, AND WHAT INVESTORS SHOULD KNOW

Only around seven hours remain before the indicative subscription window for Anthropic (ANT) closes. For me, this is an important opportunity to discuss one of the most closely watched AI companies and explain why Gate's IPO Access service deserves attention. Anthropic is developing technology that could reshape how businesses operate, while Gate is providing eligible users with a convenient way to submit an IPO subscription using USDT and
GateSquare
⏳ 1 day left: Share your Anthropic IPO subscription application for a chance to win stocks worth 150 USDT
🐟 The Gate Square Anthropic IPO lucky draw closes tomorrow
🏆 1 winner will be selected at random to receive stocks worth 150 USDT $ANT
📸 After completing this round's subscription application, share #Gate直通IPO第三期Anthropic,晒出本人申购截图 + your reason or experience to enter the lucky draw.
Share your thoughts and join the discussion for a chance to win these prizes:
✍️ 10 quality posts will be selected, each winning $ANT stocks worth 10 USDT
💬 10 quality comments will be selected, each winning $ANT stocks worth 5 USDT
🎁 100 additional valid comments will be selected, each winning a 10 USDT futures position experience voucher
Talk about your experience with Claude, discuss Anthropic's prospects, and share your subscription strategy—tell us what you really think.
👉 Subscribe now: https://www.gate.com/zh/ipos/ipo-access/anthropic-ipo-access/69
📝 Event details: https://www.gate.com/announcements/article/102761

repost-content-media
  • 1
INTC, buy the dip in spot and futures. INTC, go long at the current price of 54, stop loss at 49, target around 70. $INTC
post-image
INTC+0.05%
Spot positions are unwinding; futures positions are piling up.
ETFs have seen net outflows for five straight days, while aggregate futures open interest keeps rising.
Retail traders are all long; smart money is extremely short.
post-image
Bitcoin scored three straight wins across long and short trades in a single day, racking up nearly 3,000 points! Captured the full move by shorting near the highs during the day, then chased longs in the evening for another satisfying win!

Yesterday in review:
Shared a shorting strategy in the early session, then followed the trend to take profits on two short trades during the day (+306%, +194%).
As the market started to pick up in the evening, I decisively chased longs and scored a massive 318% gain!

Stay flexible in trading and follow the trend—that’s the way to go.$BTC $ETH #Gate直通IPO第三期
BTC-0.65%
ETH-1.23%
2026.11.17 When will Bitcoin break out of its ongoing consolidation? Ether's surge does not change the bearish trend; medium- to long-term positioning $BTC $ETH
BTC-0.65%
ETH-1.23%
$BLESS 🚨 BLESS Meme Coin Survival Guide 🚨
💥 One-sentence summary:
A “skyrocket” that doubles in a day, and a pure meat grinder for whales playing with leverage. Fine to watch, but be cautious about entering!
🔍 Quick chart teardown
· 📈 A checkered past: The daily chart just pulled a “rocket launch + waterfall” on the left, and now it’s taking off from the same spot again. The 0.024 - 0.030 range above is all graveyard, with massive resistance.
· 🎈 Floating in the clouds: The 4-hour chart has shot straight outside the upper Bollinger Band, severely overbought and ready for a free fall towa
post-image
BLESS-2.00%
$SOXL ’s hourly chart flashed an RSI oversold signal, so I decisively entered for the rebound. After momentum shifted, the price made a clean 56% move up, and I locked in profits. This pattern is worth monitoring; next, I’ll focus on whether $BTC and BLESS show similar oversold reversal setups.
I remain bullish on the long thesis for $SOXL , and the trade plan is ready: entry zone 47.46–48.53, first target 50.69, second target 52.85, with a stop at 45.56. Bottom signals are already fairly clear, and a rebound could begin at any time, so it may be worth being a little more aggressive.
That sai
post-image
161
161161
Pump.Fun
MC:$2.19KHolders:2
2.08%
SOXL-1.16%
BTC-0.67%
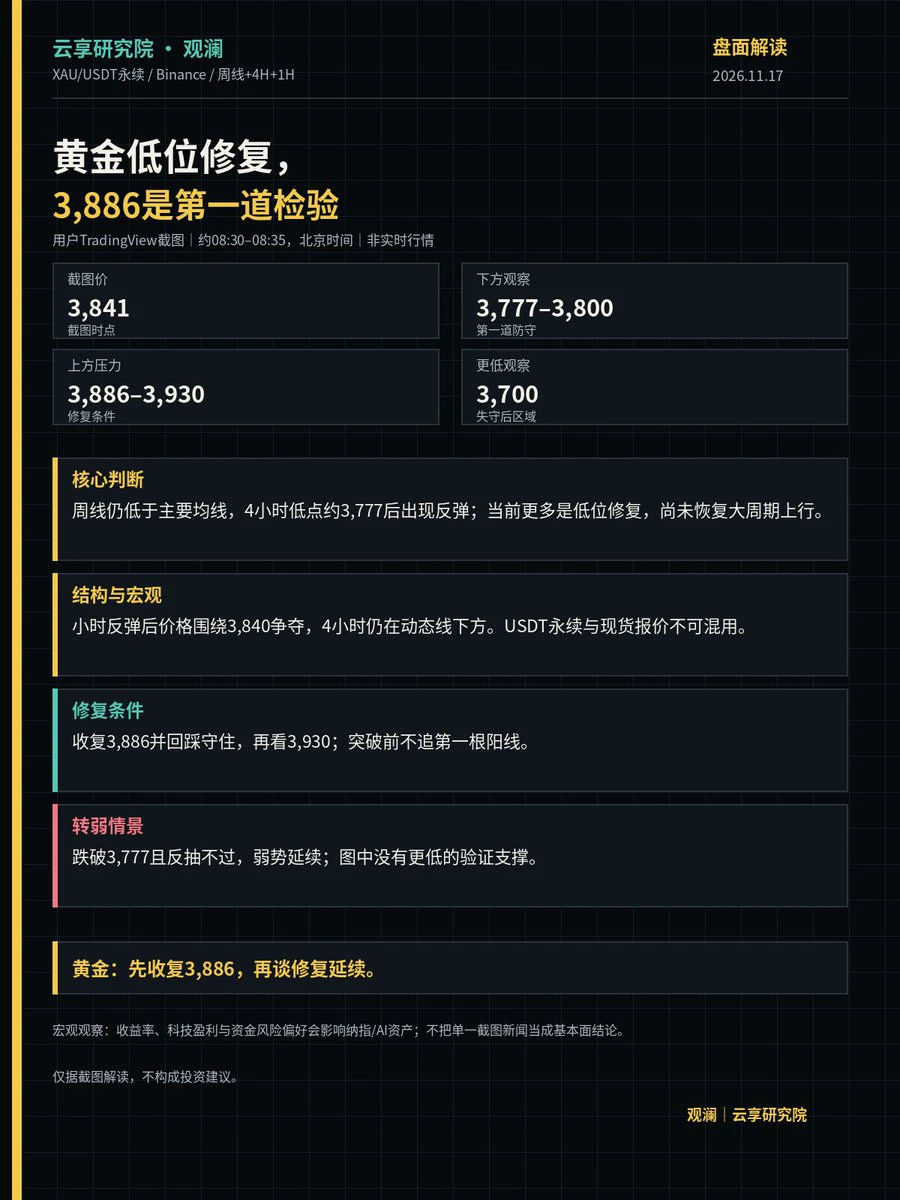
【Gold Is Recovering From the Lows; 3,886 Is the First Key Confirmation Level】
From the chart, gold rebounded after pulling back to around 3,777 on the 4-hour timeframe, and is now back near 3,840. There has been a short-term recovery, but the weekly price remains below the major moving averages. For now, it is more appropriate to describe this as a rebound from the lows; it is too early to conclude that the larger trend has reversed.

The key levels to watch next are:
3,886–3,930: Overhead resistance and the confirmation zone for the recovery;
3,777–3,800: First line of short-term support;
3,7
post-image
GLDX-0.40%
PAXG+0.37%
Load More

Join 40 M users in our growing community

⚡️ Join 40 M users in the crypto craze discussion

💬 Engage with your favorite top creators

👍 See what interests you

Trending Topics

GateIPOAccessAnthropic

431.6K Views3.1K Discussing

Gate IPO Access Phase 3 features Anthropic (ANT), with USDT subscription interest starting from 100 USDT. Successful allocations will be delivered as real shares to Gate Stock Accounts. Indicative price: $70–$78/share Subscription: Nov 12–17 (UTC+8) Allocation is not guaranteed. Please manage risk accordingly.

Dr.HanOxfordUnionSpeech

327.7K Views1.7K Discussing

ANTPreMarketFuturesNowLive

355.6K Views3.6K Discussing

View More