Share your thoughts
placeholder
Article
Unpopular opinion: Dracula was such a present Dad
post-image
CRYPTO MARKET TALK
live-cover
LIVE44
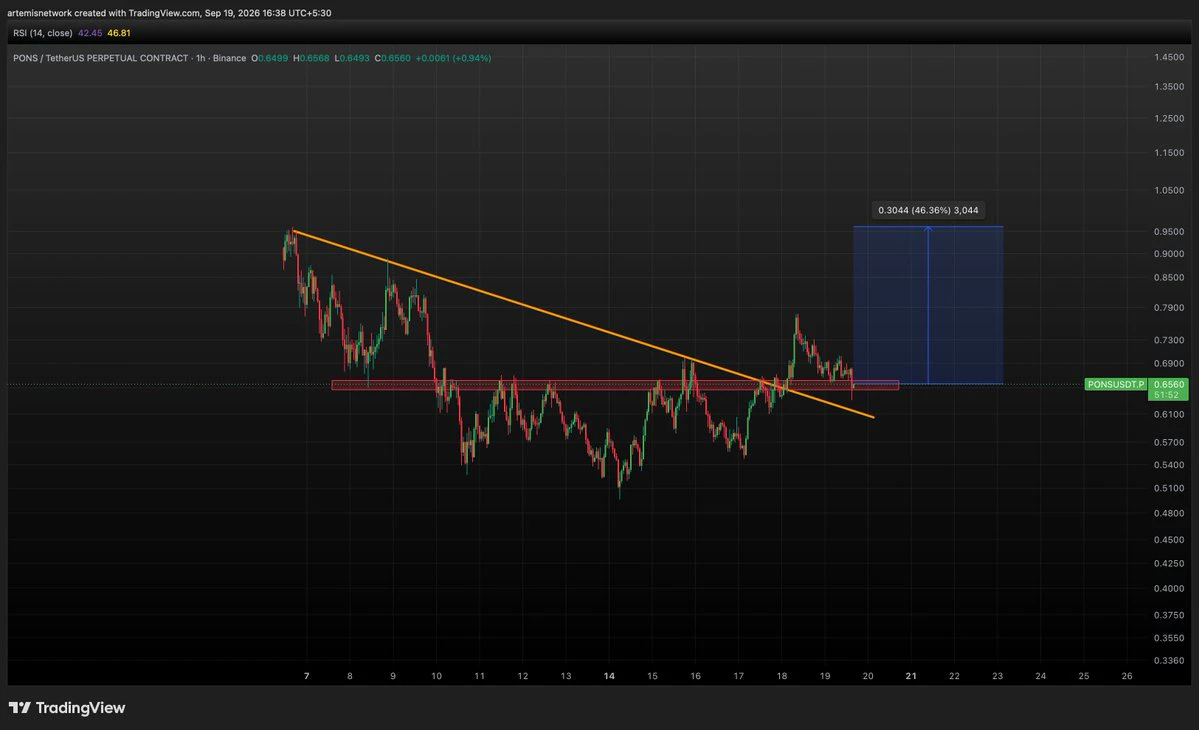
$PONS to ATH very soon, chart is retesting now and will fly soon
post-image
PONS-6.24%
  • 1
Layout of zec usdt
live-cover
LIVE1,358
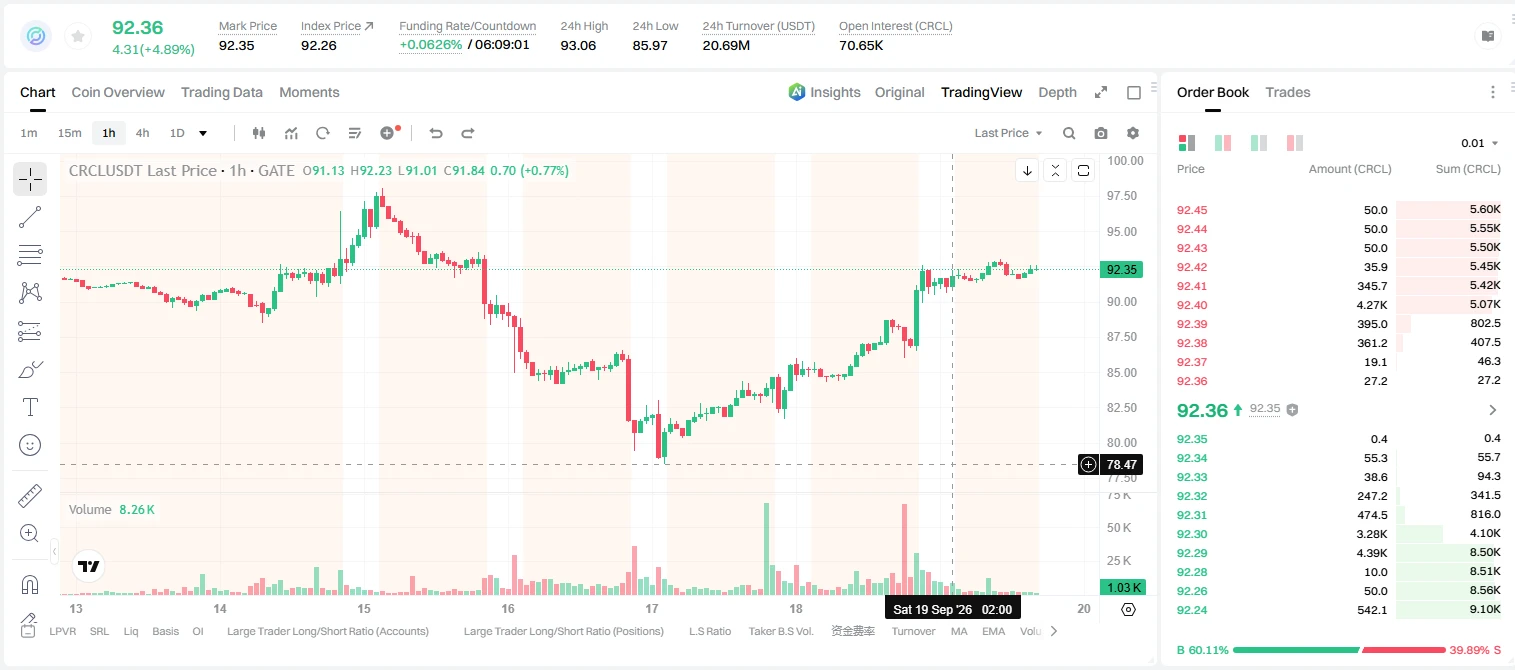
Insiders are quietly setting up a short on $CRCL /USDT while the 1h price sits at 92.36.

$CRCL /USDT - SHORT

Trade Plan:
Entry: 92.15 – 92.57
SL: 94.36
TP1: 90.86
TP2: 89.85
TP3: 88.35

Why this setup?
Why now? The daily trend is range-bound, which often precedes a directional breakdown. The 15m RSI at 50.93 shows the market is balanced on the short-term, leaving room for a move lower. The 1h ATR of 0.835184 confirms enough volatility to reach our targets. The entry zone between 92.15 and 92.57 aligns with the 1h price of 92.36, offering a precise trigger. TP1 at 90.86 and TP2 at 89.85 de
post-image
CRCL+5.17%
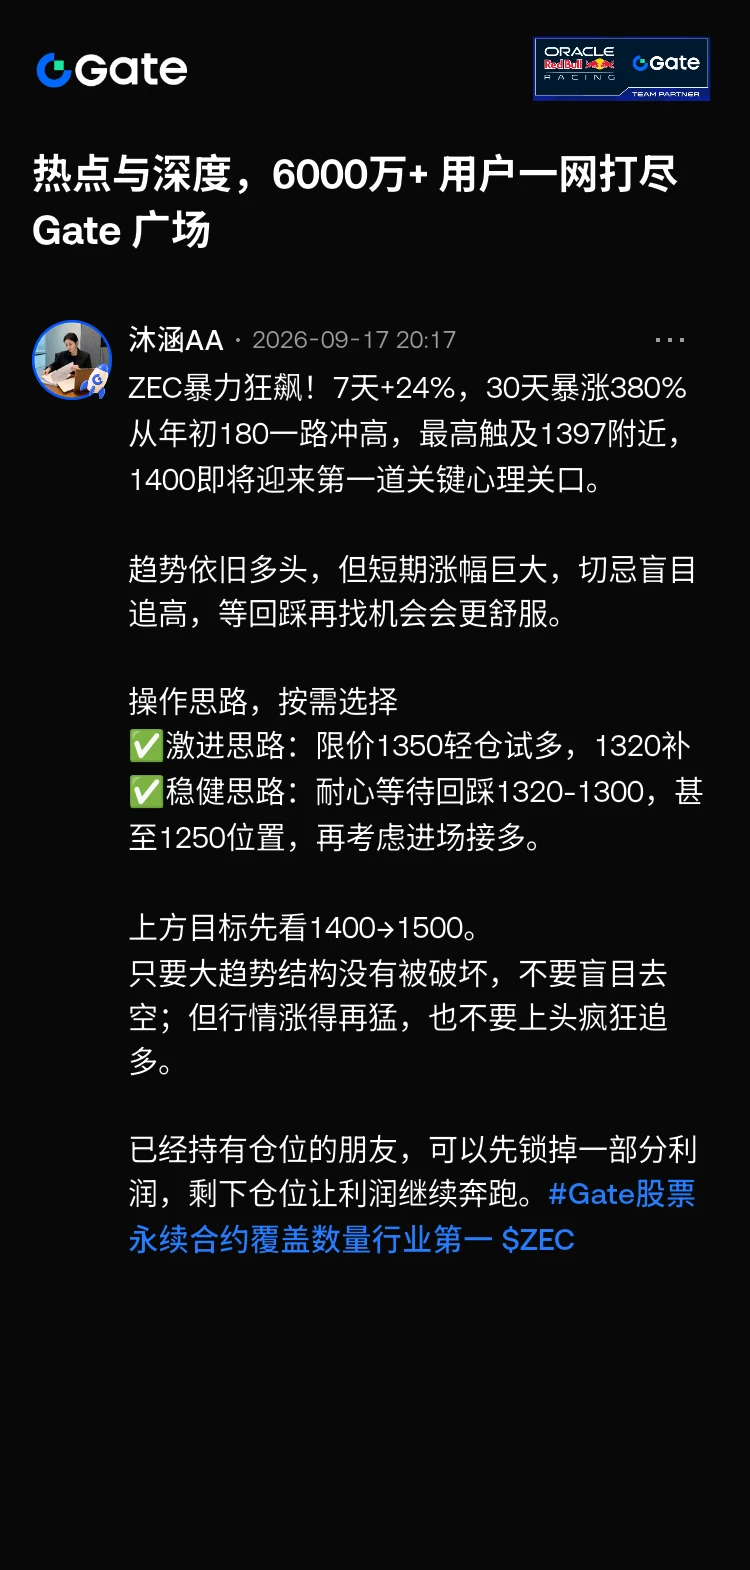
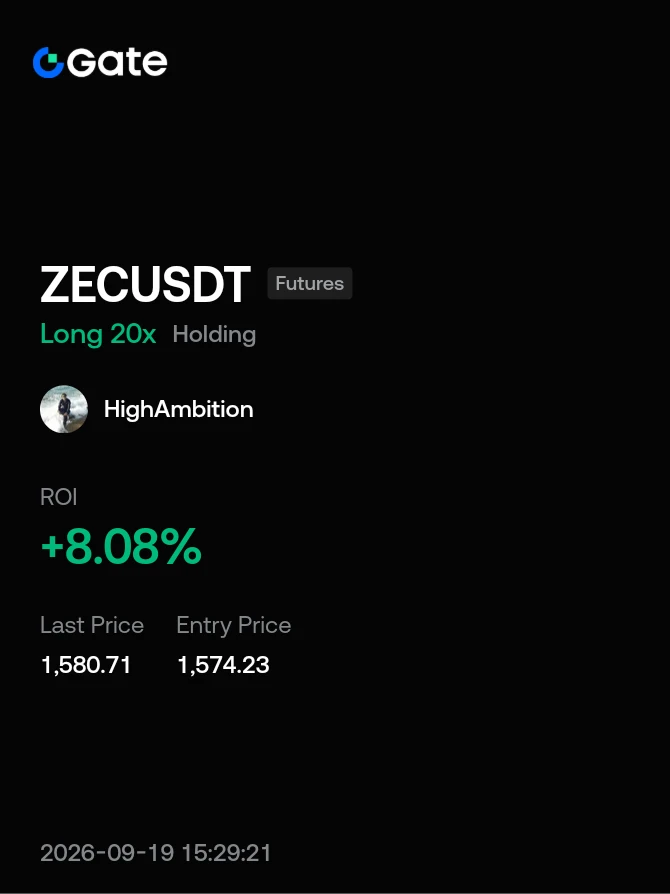
ZEC hits a new all-time high
How are my short-selling friends doing now? At this short-squeeze pace, breaking above $2,000 really is just a matter of moments!

Remember how ZEC plunged in the first half of the year due to unlimited issuance, with pessimism everywhere.
Long-time followers of Muhan know that I publicly flagged it on the 17th: build long positions at 1,350, with a target of 1,500.
After the price broke above 1,500, I still remained bullish without wavering!

Today, it set another all-time high, reaching as high as 1,588!
The ZEC spot ETF attracted as much as $98.2 million in a
post-image
ZEC+4.82%
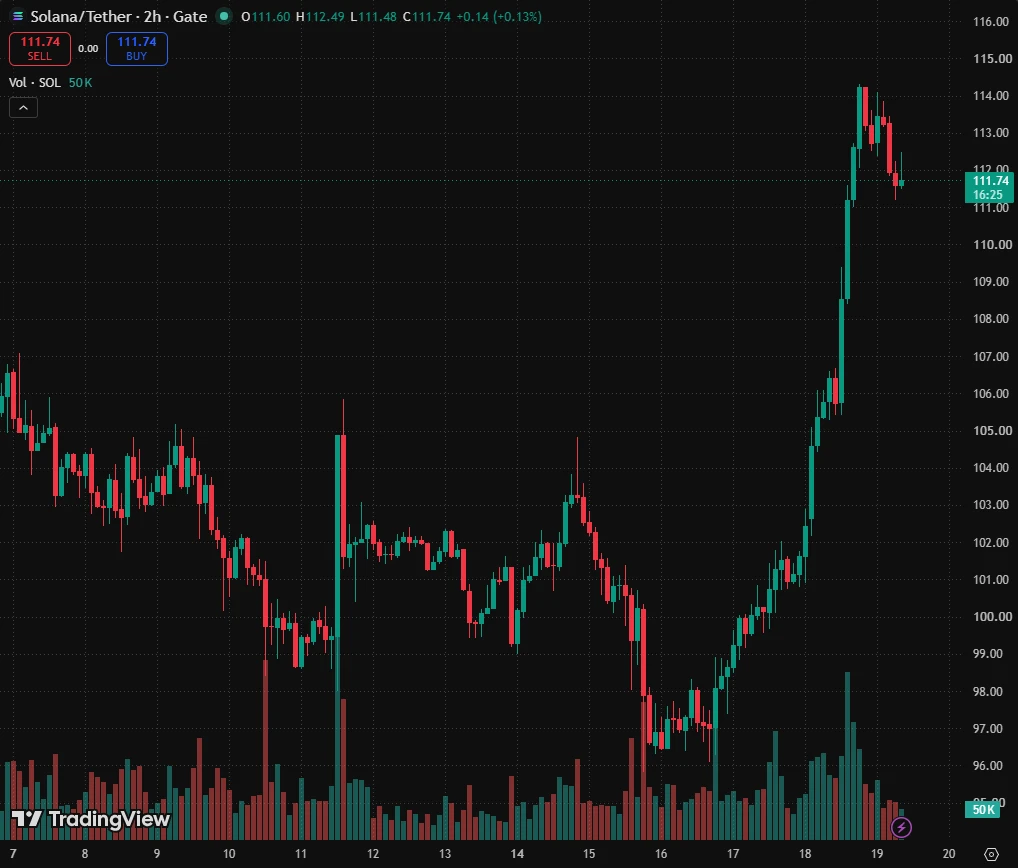
$SOL SOLUSDT - A hunt for liquidity ahead of the rally's continuation
SOLUSDT
confirms its bullish market structure. The long squeeze of support that we expected in the previous analysis played out perfectly. The bulls quickly took control of the situation and strengthened their positions...
Previously, we discussed how the market turned out to be stronger than expected: Bitcoin showed virtually no reaction to higher interest rates, the Fed’s hawkish stance, or the fact that the CLARITY Act was not passed. Consolidation continued, which further confirmed the strength of the market.
As for Sola
post-image
SOL+5.83%
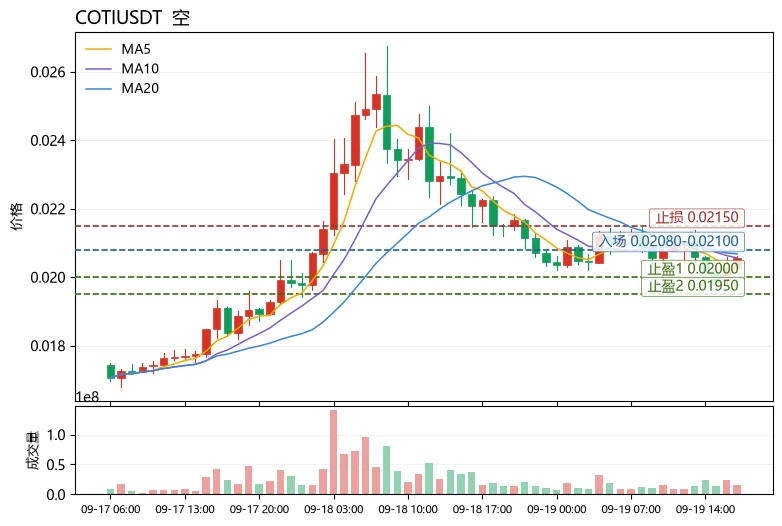
$COTI The most unusual point today: the Fear & Greed Index came in at 71, with the entire market in the greed zone, yet it fell 6.42% against the trend, becoming the only one of the three candidates in the red. This divergence of “index greed, individual coin selloff” is often where short-term sentiment is most conflicted.
Looking at the technicals: MA5=0.020276 has fallen below MA20=0.020677, turning the moving-average structure bearish; the MACD histogram at -6.462e-05 is maintaining bearish momentum, while RSI=46.6 is in the neutral-to-weak zone and still some distance from oversold, indic
post-image
COTI-0.56%
XTZ+26.92%
MORPHO+18.56%
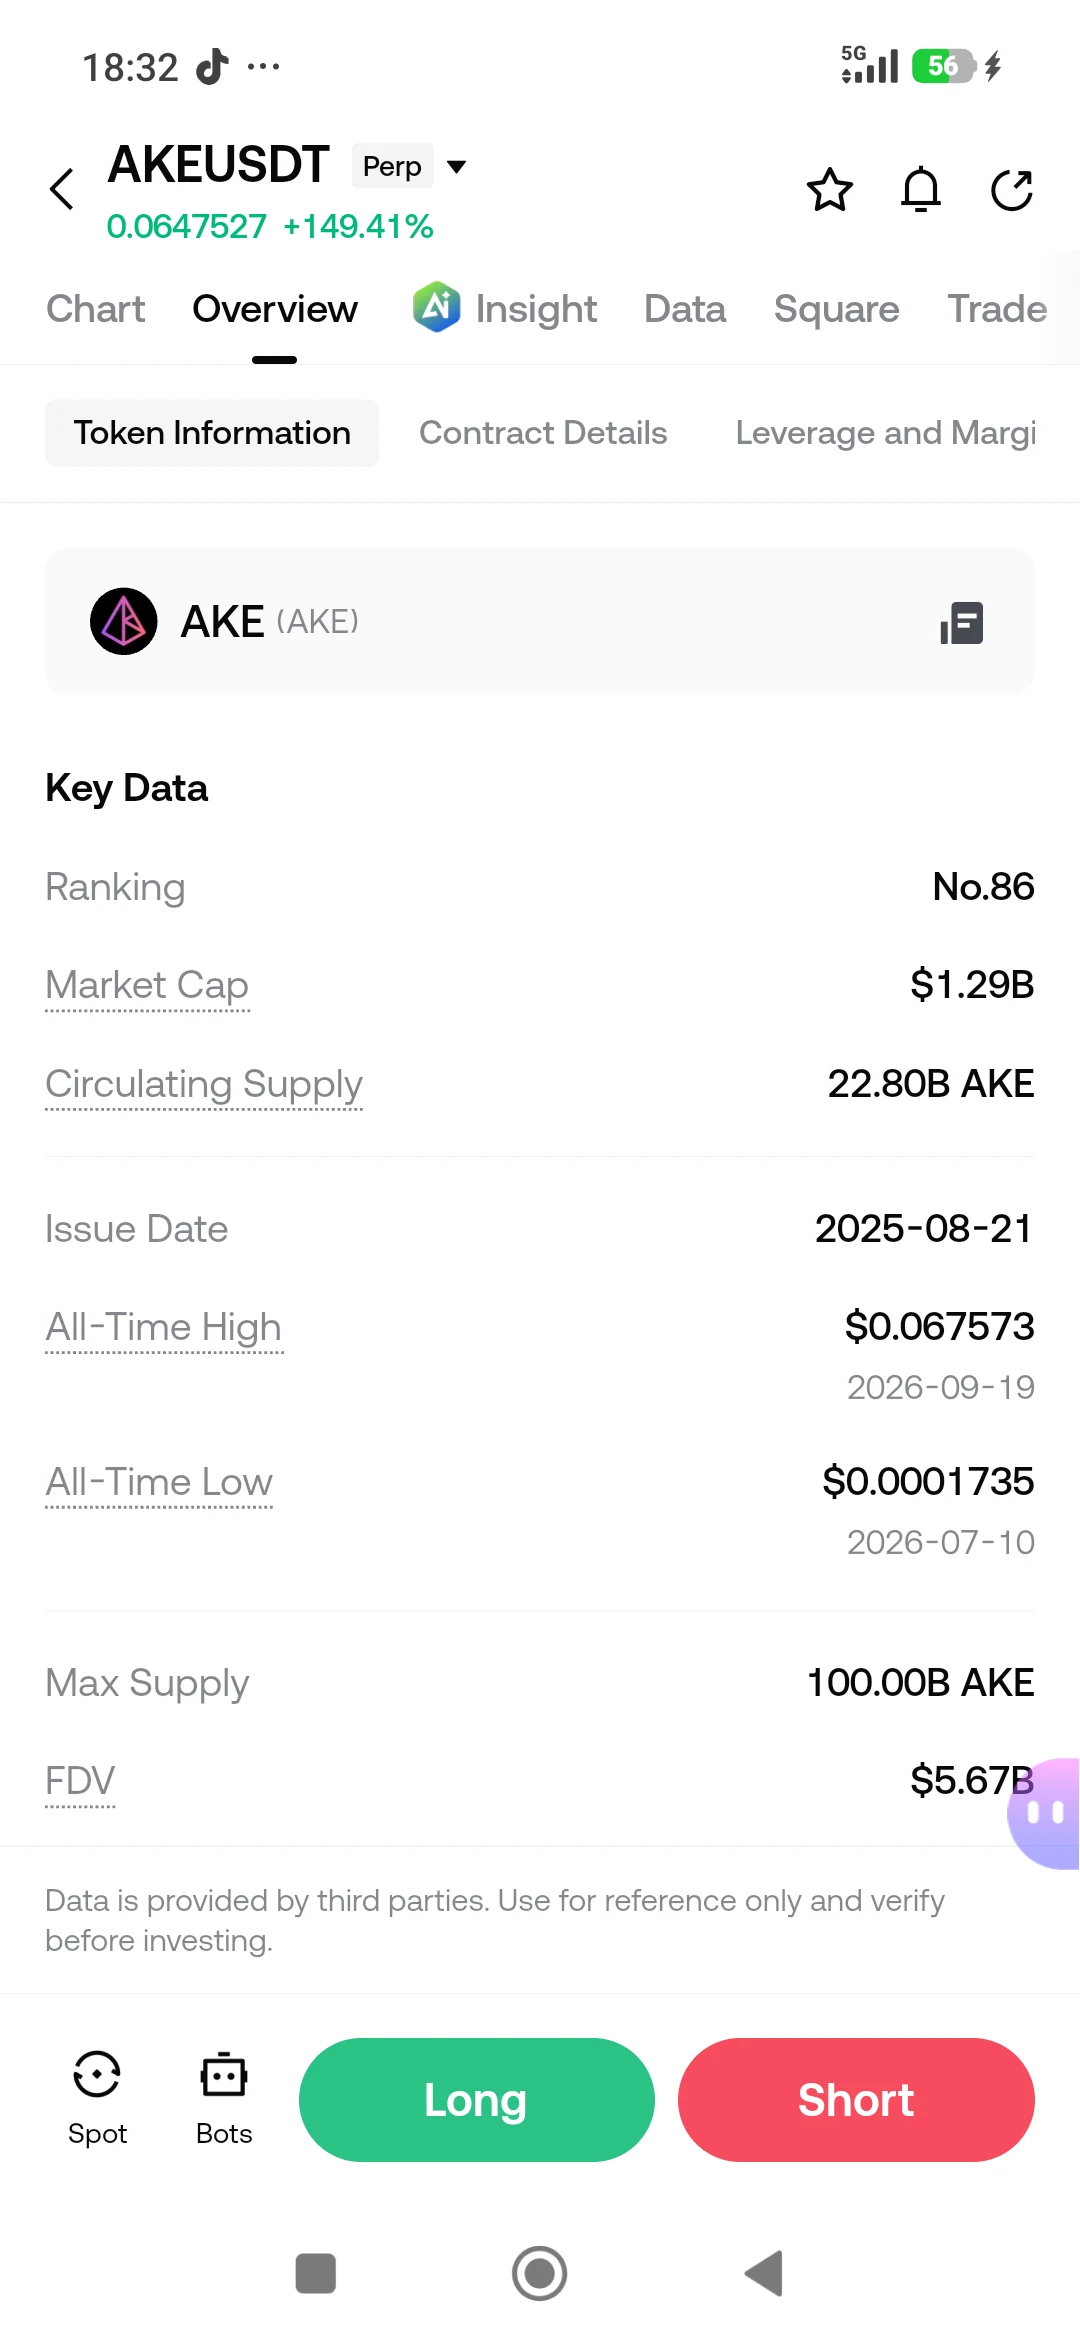
$AKE more than 20b circulation supply. cmonn lets fking go
post-image
AKE+156.44%
Hey @kale_abe
You can now hold these $NUTZ and earn $STONK
post-image
STONK-5.85%
🌕 $BTC
It’s that simple: you can directly buy 🎋$BTC $81,200, then $86,500, then $99,900, then $115,400, then $125,700. Soon, $BTC is about to spark a frenzy🎗️
post-image
BTC+4.04%
#GateTopsStockPerpetualCoverage Gate Expands Stock Perpetual Coverage, Bringing Traditional Markets Closer to Crypto Traders
The financial world is changing rapidly, and the connection between traditional markets and cryptocurrency is becoming stronger every day. Gate continues to expand its trading ecosystem by strengthening its stock perpetual coverage, creating new opportunities for traders who want exposure to global financial markets through a crypto focused platform.
For years, traditional stock markets and cryptocurrency markets have operated in separate environments. Traders interested
  • 2
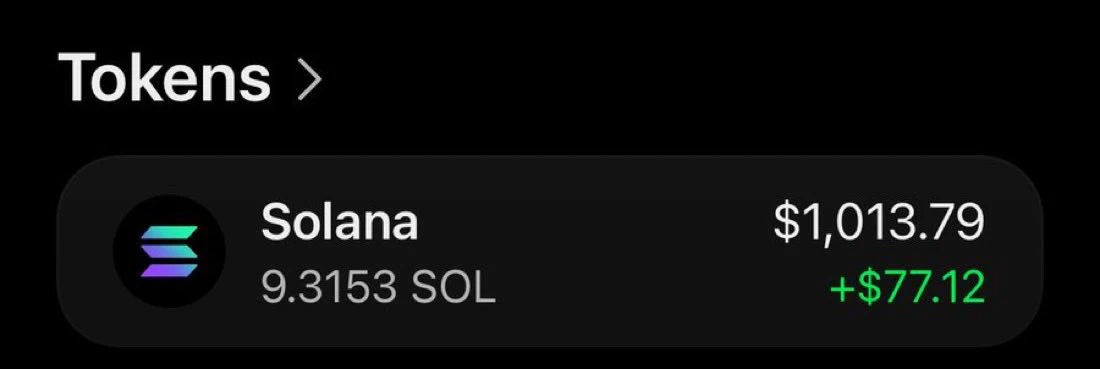
$1000 SOLANA giveaway for my active followers
LIKE AND RETWEET THIS POST AND MY LAST 10 posts
Drop proof and your solana address.
Let’s share some money.
Winners in 24 hours
post-image
SOL+5.85%
Everyone's watching SYMBOL break out but this SHORT signal tells a different story.

$XRP /USDT - SHORT

Trade Plan:
Entry: 1.4165 – 1.4245
SL: 1.4706
TP1: 1.3829
TP2: 1.3578
TP3: 1.3202

Why this setup?
Why now? The daily trend is stuck in a range, meaning SYMBOL has been circling without direction and a breakdown could spark any moment. The 15m RSI at 55.54 shows mild bearish lean without being oversold, suggesting room to fall before any bounce. The 1h ATR of 0.016066 confirms active volatility, so moves will be sharp and worth trading. Entry around 1.4205 with a 1.4165 to 1.4245 zone gi
XRP+7.88%
codex now sends messages and feedback to other conversations on its own,
the world is one giant IM
post-image
Long paragraph starting here $JUP
. Trading plan: Entry 0.2764 - 0.2814Take profit 0.2950 / 0.308Stop loss 0.2681Like a caffeine-fueled Chad, it blasted straight through the previous high—JUP bulls simply refuse to back down! Note: Rejection at the 24-hour high could trigger a sweep of local support. Don’t go all in, bro/sis. Use a position size suitable for your own account. Let’s go.👇👇👇Watching these today:$XRP and $AR .
post-image
JUP+9.06%
XRP+7.86%
  • 1
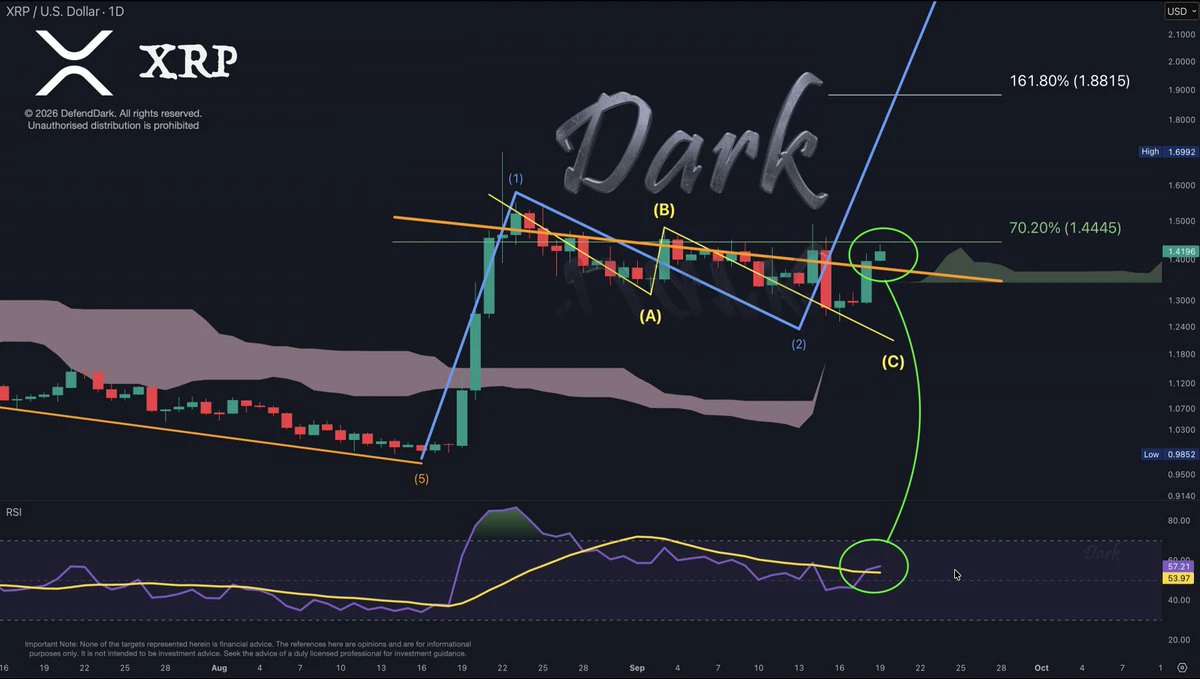
Our 5-Wave Structure is rock solid!
#XRP is coiling inside $1.33 – $1.44, and said bye-bye to the Orange resistance capping the price.
Next: You know the targets.
⁽ⁿᵒᵗ ᶠⁱⁿᵃⁿᶜⁱᵃˡ ᵃᵈᵛⁱᶜᵉ ᵇᵘᵗ ʲᵘˢᵗ ᵐʸ ᵗʰᵒᵘᵍʰᵗˢ ᵒⁿˡʸ⁾
post-image
XRP+7.86%
$XAG /USDT is quietly coiling for a move that catches most longs off guard.

$XAG /USDT - SHORT

Trade Plan:
Entry: 66.42 – 66.52
SL: 66.97
TP1: 66.10
TP2: 65.85
TP3: 65.48

Why this setup?
Why now? The daily trend is range bound, which often precedes explosive directional breaks. The 1h price sits at 66.47, right inside the entry zone of 66.42 to 66.52. The 15m RSI at 52.76 shows neither overbought nor oversold, suggesting the market is about to choose a side. With the 1h ATR at 0.207017, a single candle holds enough volatility to sweep stops and push the price from the entry toward TP1 at
XAG-1.07%
#JapanRealEstatePowerChipStocksRise
Nikkei 225 Breaks 65,000: Investment Opportunities Amid BOJ Rate Hikes and Sector Rotation
The Japanese stock market is experiencing a remarkable rally. On September 18, 2026, the Nikkei 225 extended its gains, closing up 882.70 yen at 65,018.95 yen, successfully breaking through the 65,000 yen integer mark and touching an intraday high of 65,436.57 yen. This marks the index's third consecutive trading day of gains.
The catalyst for this rally comes from the Bank of Japan (BOJ). On September 18, the BOJ decided at its monetary policy meeting to raise its po
  • 1
Load More

Join 40 M users in our growing community

⚡️ Join 40 M users in the crypto craze discussion

💬 Engage with your favorite top creators

👍 See what interests you

Trending Topics

JapanRealEstatePowerChipStocksRise

59.36k Views4.23k Discussing

Japan's Nikkei extended gains on Sept 18, with real estate, power, and semiconductor sectors leading. Gate covers over 12,800 global stocks and ETFs, offering one-stop USDT trading across US, HK, Korean, and Japanese markets. [👉 Read more](https://www.odaily.news/en/newsflash/518749)

USAIConceptStocksRally

34.05k Views856 Discussing

GateTopsStockPerpetualCoverage

38.24k Views2.52k Discussing

View More