



Share your thoughts
placeholder
Article
An important level to watch for bitcoin:native.
A break below the dotted line at approximately $76,300 would suggest that the fifth wave is complete and that a much deeper decline may be beginning.
If support holds, however, the latest high may represent only wave 1 of the final fifth wave, leaving waves 2, 3, 4 and 5 still to unfold higher.
Two valid scenarios but price will provide the confirmation. #Bitcoin #ElliottWave #Crypto
post-image
BTC-1.00%
🔥 Trenches is open—what Meme are you watching today?
Post your Meme views, trading ideas, or real trades on Gate Square with #GateTrenchesGasFree for a chance to win rewards!
🏆 10 Outstanding Creators
Each receives a 100 USDT Position Voucher + 7-Day Gate Square Traffic Boost
🍀 Trade & Win More
Trade via Trenches and share your trade or position screenshot for a chance to be one of 3 winners × 5 USDT
Trending Memes, Robinhood Chain, trade recaps—share your take 👇
🔥 Post now: https://www.gate.com/post
📈 Learn more: https://www.gate.com/announcements/article/101581
post-image
MEME+2.38%
  • 5
  • 5
I wasn’t even expecting to break even, but it went straight into profit for me—the service really delivered🙏. Held $SNDK from 1500.51 all the way to 1770.3, +1276.82%. All those late nights weren’t for nothing—really weren’t.
The last thing I checked before bed, the market was still grinding sideways, and I was honestly a little uneasy. But bottoming sideways is the most honest signal: funds are quietly accumulating, not buying blindly. So I didn’t hesitate much—I placed a long order as planned and waited for the market to answer. It really did, and rather aggressively.
Closed 75% of the posi
post-image
SNDK-1.06%
ETH-0.33%
DOGE+0.43%
Layout for Bitcoin, Ethereum, and Dogecoin
live-cover
LIVE1,467
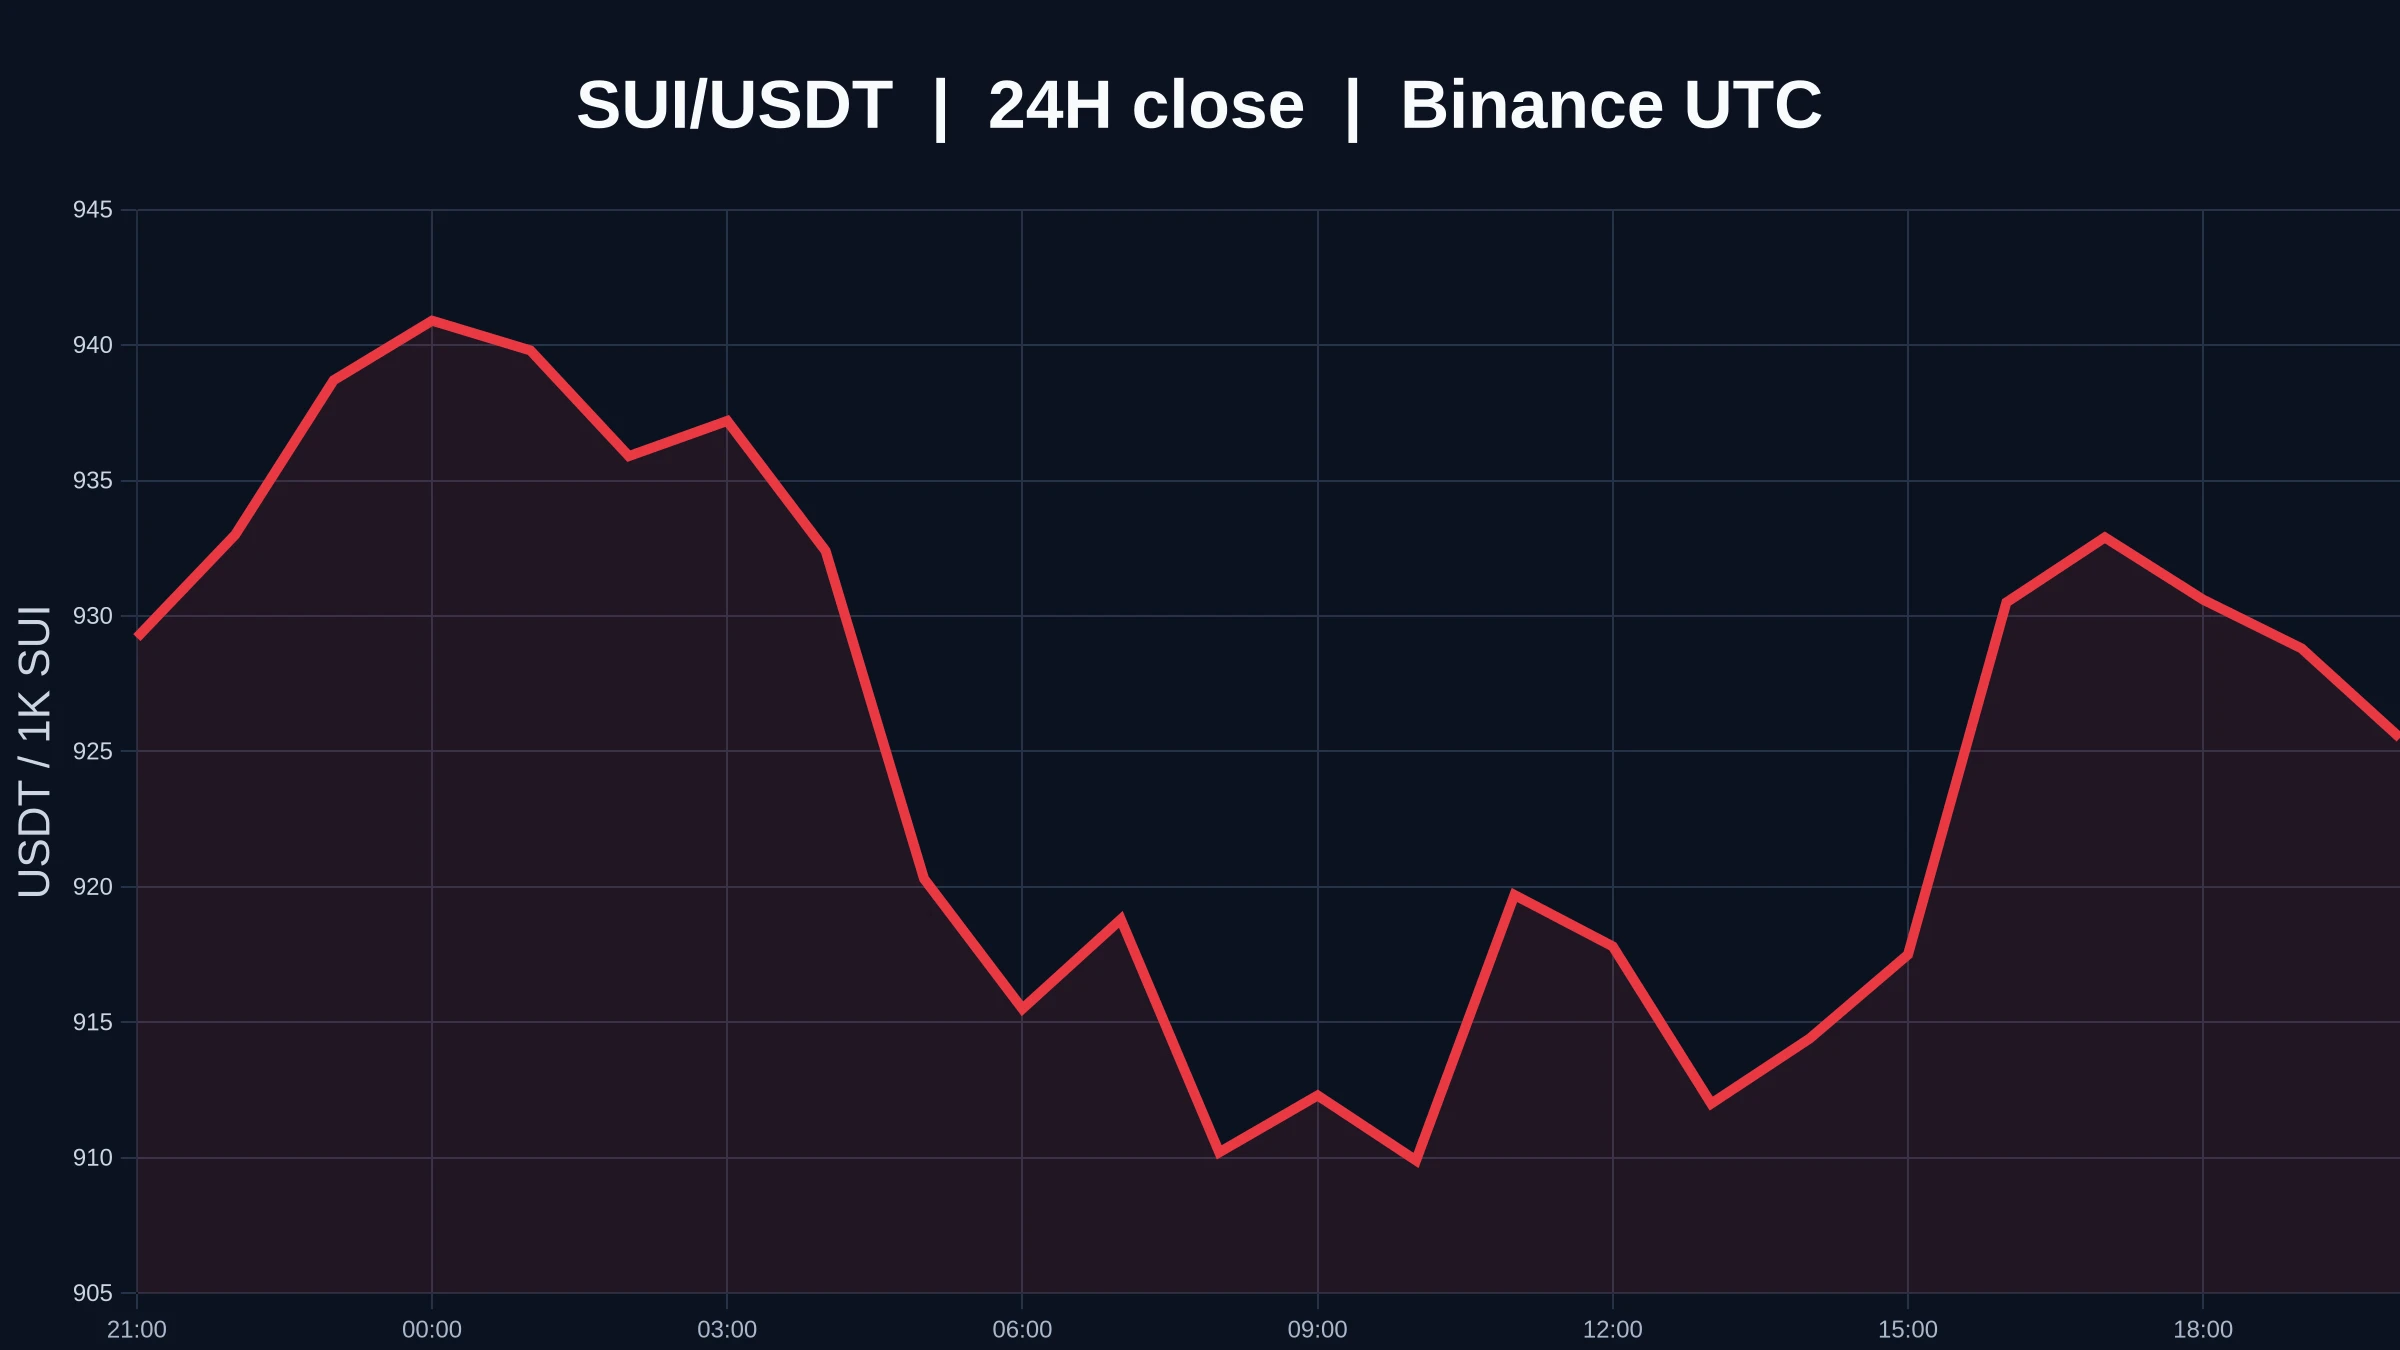
SUI Price Analysis: Navigating Key Levels & Market Momentum
The SUI/USDT perpetual contract is demonstrating a notable bullish recovery on intermediate timeframes, rebounding off recent lows around $0.6342 to test resistance near $0.8440. As layer-1 competition intensifies, market participants are closely monitoring price action for signs of a sustained breakout or consolidation.
Key Technical Observations:
Moving Averages & Trend Continuity: On the 4-hour chart, the short-term Moving Average (MA5) has crossed above the longer-term averages (M
SUI+0.92%
  • 7
  • 2
$SOPH /USDT is about to expose the shorts who are already in profit.

$SOPH /USDT - SHORT

Trade Plan:
Entry: 0.011454 – 0.011862
SL: 0.014204
TP1: 0.009749
TP2: 0.008476
TP3: 0.006566

Why this setup?
Why now? The daily trend is range-bound, which traps momentum traders and sets up a sharp move once the range breaks. The 1h ATR of 0.000816 tells us volatility is compressed enough for a sudden expansion. The 15m RSI at 69.82 shows the asset is nearing overbought territory on the short-term frame, hinting at exhaustion. The entry zone between 0.011454 and 0.011862 aligns with the 1h price of
SOPH+108.28%
By the time I got back from a bathroom break, the candlesticks had already wiped out my losses for me. A few days ago, I was watching $ETHFI in the early morning hours. It repeatedly formed a floor around 0.4789 without breaking down, while buying support grew steadier with each dip. I went long immediately and signaled entry. Now the price has reached 0.5951, with unrealized gains of +1725.84%—this huge move was finally worth the wait.
I’ve taken 80% off the table and moved the stop-loss on the remaining 20% to breakeven for protection. If it keeps surging, I’ll hold; even if it pulls back, I
post-image
ETHFI+0.27%
XRP-0.24%
LAB+0.04%
A billion dollars in stablecoins sitting on Robinhood isn’t just a big number, it tells a story.
Stablecoins are digital assets designed to hold a steady value (usually pegged to the US dollar).
When their supply on a platform climbs toward $1B, it often means users are moving capital onchain and preparing to invest, trade, or provide liquidity.
It doesn’t guarantee prices will immediately go up, but it does signal growing participation and stronger market activity.
Think of stablecoins as “dry powder” money waiting for the right opportunity.
Watching stablecoin inflows can give you valuable
$SKHYNIX USDT Long Setup
🔴 Entry: 1,340 - 1,352
🎯 TP1: 1,380
🎯 TP2: 1,400
🎯 TP3: 1,430
🟢 SL: 1,290
SKHYNIX is breaking out strongly, riding above all three MAs with a sharp push from the 1,238 base toward fresh highs at 1,409. Volume is picking up on the move, confirming buyer strength. As long as price holds above 1,320, momentum favors continuation to the upside.
⚠️ This is not financial advice. Always do your own research (DYOR).
#LearnWithGM
post-image
SKHYNIX+1.69%
What to do if you didn’t sell at Bitcoin’s top! Crude oil has skyrocketed—can we still short it? Come take a look.
1. First, Bitcoin has finally pulled back. On the one hand, with the bill decision approaching, longs have been taking profits continuously; on the other hand, the surge in oil prices has created inflationary headwinds. So this pullback is completely normal and in line with our expectations. The question is, how should we operate next?
2. First, what if you didn’t sell at the top? As shown in the chart, our analysis in the previous episodes suggested that the top would arrive a fe
BTC-1.00%
SOL-1.57%
CL+2.00%
SKL pump pump bigpump ath go
post-image
SKL+1.03%
BIGPUMP+1.75%
Insiders are quietly leaning short on SYMBOL while the 1h price sits at 55.7.

$LTC /USDT - SHORT

Trade Plan:
Entry: 55.5 – 55.9
SL: 57.3
TP1: 54.5
TP2: 53.6
TP3: 52.4

Why this setup?
Why now? The daily trend is range, so directional moves are compressed and a short bias makes sense at the 1h price of 55.7. The 15m RSI at 57.37 shows mild bullish exhaustion, and the 1h ATR of 0.685471 confirms enough volatility to reach the entry zone between 55.5 and 55.9. The target TP1 at 54.5 offers a measured move, while TP2 at 53.6 extends the reward, but the line in the sand invalidating this setup
LTC-0.73%
$BTC is losing momentum after breaking below the small range.
Now all eyes are on the falling wedge retest. If that area holds, buyers could step back in. But a clean break below it could open the door to a deeper move.
The NY session could be the real trigger. Stay sharp.
post-image
BTC-1.00%
Been watching $APEWIF on SOL since last week and in all honesty I missed the $150k mcap entry as I was focussed on RH
Just been catching up on my watchlist and saw it’s pumped to $300k mcap ffs, adding some here incase it just moons to $1m+ and will be adding on dips.
It’s an ape wif a dress good tek, reminds me of how $ZCAT and $FONE started wouldn’t wanna be sidelined.
The dress stays on 🦍👗
post-image
SOL-1.57%
RH+0.98%
WIF-0.18%
DRESS-5.59%
FONE-44.78%
  • 1
XRP is range-bound on the daily, but this 1h setup screams short.

$XRP /USDT - SHORT

Trade Plan:
Entry: 1.3961 – 1.4013
SL: 1.4232
TP1: 1.3803
TP2: 1.3681
TP3: 1.3497

Why this setup?
Why now? The daily trend is range, and the 1h price is sitting at 1.3987, which is also the entry reference. The 15m RSI at 52.64 shows the asset is neither overbought nor oversold, leaving room for a directional move. The 1h ATR of 0.010201 means the average hourly swing is small, so a break below 1.3961 could accelerate fast. The entry zone between 1.3961 and 1.4013 aligns perfectly with the invalidation l
XRP-0.24%
This trend is so obvious I don’t even need to think—the account is dancing on its own. 🎉

Before the market had fully started moving, everyone was watching from the sidelines. I saw the bottom grinding back and forth without breaking down, with buyers stepping in below and volume recovering, so I judged that taking a long position here offered a strong risk-reward ratio. I entered decisively at 216.97. Today’s candlestick suddenly turned upward, and the price has now reached 231. Holding a return of +600.23%, I have to say this profit feels great. Those on board should be waking up smiling—i
post-image
BNB+1.75%
BTC-1.01%
This trend doesn’t even require me to think—my account is dancing on its own. A few days ago, the rebound was weak in the early hours, overhead resistance was obvious, and every push upward fell just short. The intraday upper wick was ridiculously long, so I immediately locked in a short on $TRUMP . Entered at 2.369 and held all the way to 2.277, +275.55%. Feels great, brothers. Took 80% off the table first, set the remaining 20% at breakeven, and let the profits run. Even if a pullback takes me out, it won’t hurt. I’d rather miss a limit-up move than catch a falling knife and end up covered in
post-image
TRUMP-0.61%
SNDK-1.06%
BNB+1.75%
Precision is never just talk!
ZEC easily emerged from the pullback within the entry range I provided
There is already 107 points of room🔥
I perfectly captured the 10% volatility range
Opportunities are coming from all sides—take action now.
ZEC-4.99%
A protocol you’re in just got exploited
What you do in the next hour matters more than anything you read after
Save this before you need it
🧵🧵🧵
post-image
ETF Flows Strengthen Across Crypto! Can Institutional Demand Give BTC & ETH Another Push?
live-cover
LIVE2,285
  • 1
Load More

Join 40 M users in our growing community

⚡️ Join 40 M users in the crypto craze discussion

💬 Engage with your favorite top creators

👍 See what interests you