Square
Following
Hot
News
Profile
Share your thoughts
placeholder
Article
#KOSPIJumps3.3% #ShareWeekly
KOSPI’s Sharp Rebound: Semiconductor Stocks Recover, but Is the Market Ready for a Sustainable Rally?
South Korea’s stock market has delivered a powerful reminder of how quickly investor sentiment can change. After the KOSPI plunged 7.6% on October 15, 2026, falling to approximately 5,554 points and triggering a circuit breaker, the index rebounded by more than 3% on October 16, reaching around 5,745 points during the session.
The recovery has brought fresh optimism, but I believe investors should remain cautious. The central question is whether this rebound repre
SK Hynix-2.67%
NVDA-1.42%
JPN225+1.82%
NAS100+1.15%
  • 4
  • 1
10/19 Gold:
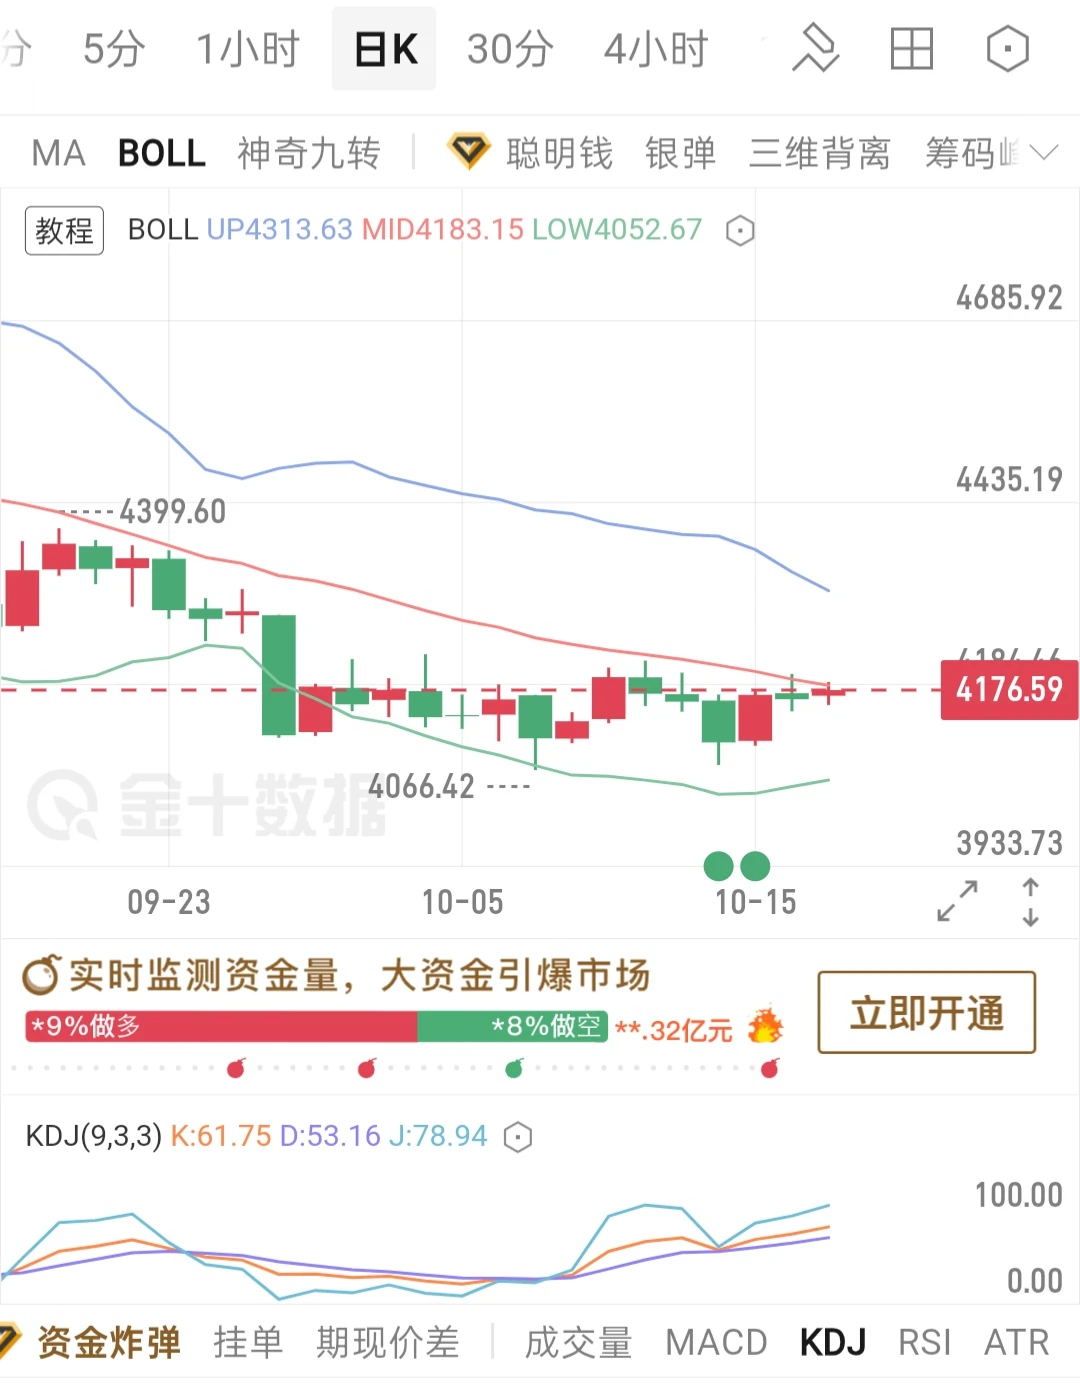
On the daily chart, the current price is trading just below the Bollinger middle band. After the previous decline, a bottom has formed at the lows, and the candlesticks have gradually moved higher, creating a rebound structure from the bottom. However, the price has yet to rise above the Bollinger middle band, which is the first short-term resistance.

KDJ indicator: K=61.75, D=53.16, J=78.94. The three lines are diverging upward and are in bullish territory. The J value is approaching 80, showing slight short-term overbought signs and the possibility of a pullback for consolidati
post-image
GLDX+0.10%
PAXG+0.31%
XAU+0.43%
Trenches
TSI
T
bade
b
TSI
0xa8...1c1e
Market Cap
$.
Change
.
24h Vol
$.
Holders
.
CNPY
C
bade
b
CNPY
0xc6...ddd2
Market Cap
$.
Change
.
24h Vol
$.
Holders
.
AGT
A
bade
b
AGT
0x5d...e274
Market Cap
$.
Change
.
24h Vol
$.
Holders
.
BOOMER
B
bade
b
BOOMER
0x5a...5c00
Market Cap
$.
Change
.
24h Vol
$.
Holders
.
PIERRE
P
bade
b
PIERRE
D3S6...pump
Market Cap
$.
Change
.
24h Vol
$.
Holders
.
Don’t rush to treat the NYSE’s move to Dallas as a joke. Texas is home to publicly traded companies with a combined market cap of $3.7 trillion. Low taxes, lighter regulation, and people are heading there—that’s capital voting with its feet. New York’s old-money playbook is being steadily worn down by the cost ledger. I’m looking at the trend, not the buzz. What are you seeing?
post-image
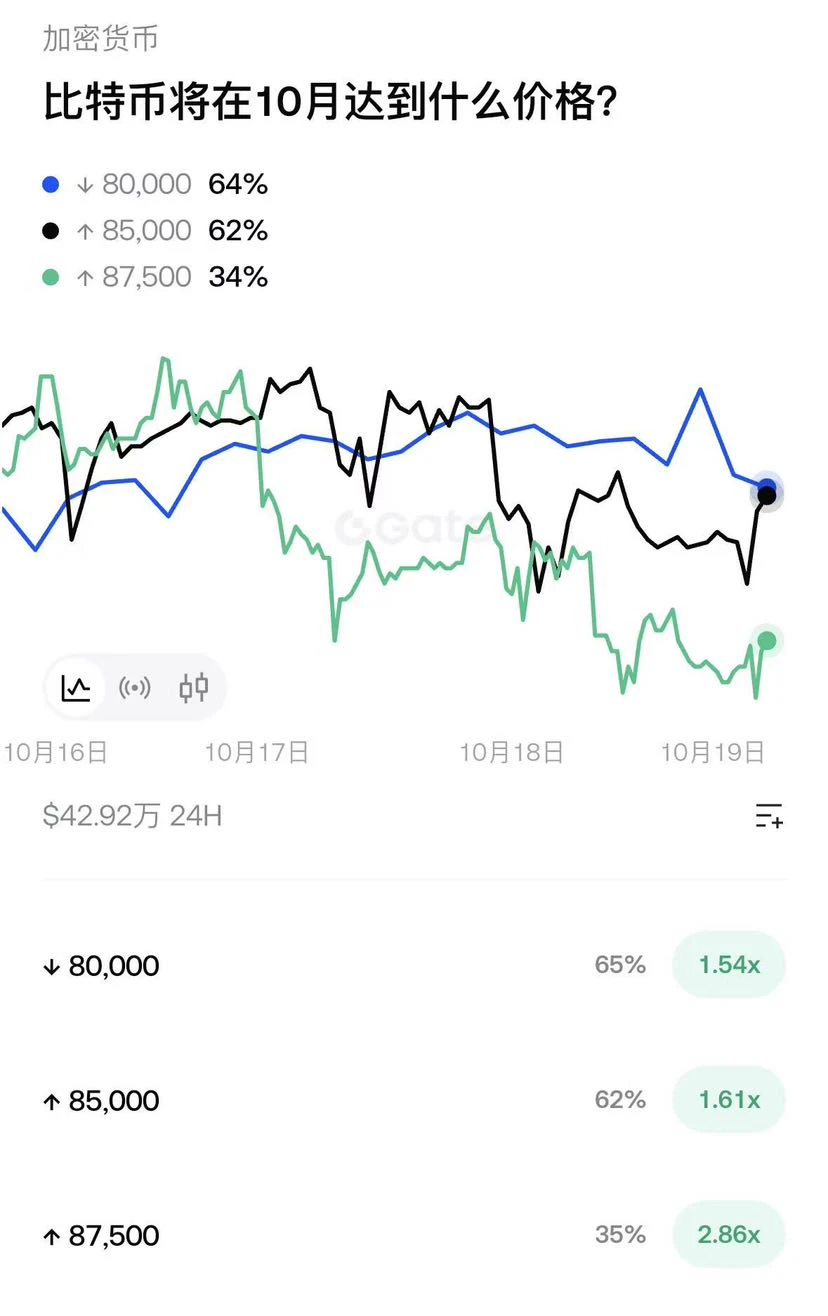
Prediction markets indicate that 80000~85000 is expected to be the main battleground for BTC prices in October, with nearly equal market probabilities of falling below 80000 and rising above 85000, leaving bulls and bears locked in a tense standoff; a push to 87500 is a low-probability event that would require a strong positive catalyst
post-image
BTC+0.87%
BTC broke out early this morning, and a trend rebound is on the way. 80K has stubbornly held, and the rebound is strong, proving there’s buying support below. If not going long now, when? Last night, everyone was calling for a bearish Black Monday, but Trump couldn’t take it anymore and came out with remarks to rescue the market, reversing the downtrend
post-image
BTC+0.87%
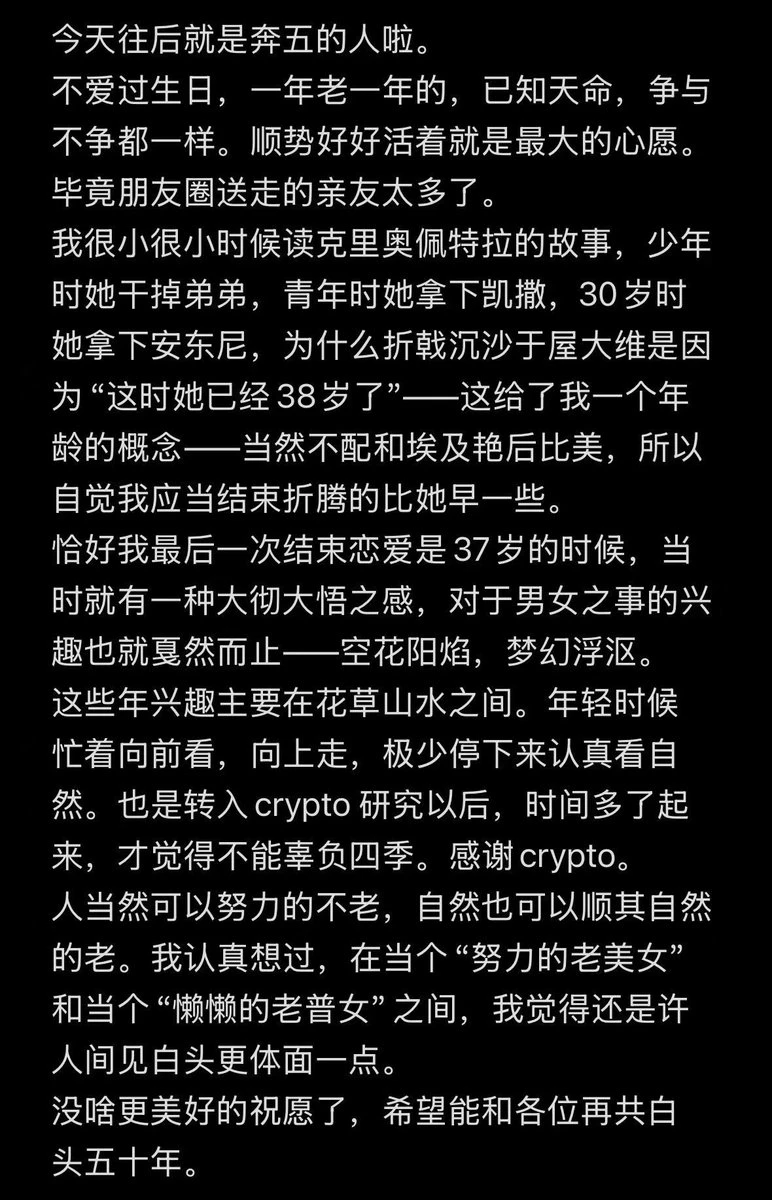
It was supposed to be posted last night—but I went to play mahjong and didn’t get around to it, hahahaha.
We played all night, and I neither won nor lost. I treated everyone to a late-night meal to celebrate—it was that pork-killing dish I can’t eat even one bite of, because they like it—and in the latter half of the night, a sister I’ve known for over 20 years also came over—we’re all family. She really came all this way especially for my birthday, and she won everything. So wonderful.
It was such a lively, fulfilling, warm, and joyful birthday🎂.
post-image
GM,
The pullback from the highs in this round of U.S. stocks is pretty much over.
$MU $SKHY and a bunch of other memory stocks have fallen nearly 40% at their worst.
Back during the AI bull market, everyone said they’d buy the dip once SK broke 1,000. Why is nobody daring to now?
But then again, might as well stick with the U.S. market’s golden child, $MU . Feels like the Korean retail investors are about to get completely wiped out.
post-image
MU-5.66%
SKHY-6.62%
SK-3.17%
10.19 BTC Market Analysis
Short: Around 82600–82900, stop loss at 83200, targets 81500/80800.
BTC is currently at 82452. The rally from 80638 has been very sharp, and price has now reached the previous high of 82488. On the 1-hour chart, price is moving upward along EMA5 (82400), but 82886 above is an earlier high, and considerable overhead supply has accumulated in the 82500–82900 area, making it difficult to break through all at once.
After a sharp rally like this, sideways consolidation makes chasing longs risky, as it can mean buying near a short-term high. If price pushes up into the 8260
post-image
BTC+0.93%
Bitcoin is on the 2-week chart. Hold long-term positions with favorable entry levels; use stop losses for unfavorable entries. Always set a stop loss on short-term trades! BTC resistance levels: 83594/85072/86222. BTC support levels: 80638/79160/78010. ETH resistance levels: 2453/2497/2531. ETH support levels: 2367/2323/2290. Set the stop loss slightly beyond the third price level. Intraday trades should be no more than 5% of your position. Livestreams are held in the afternoon and evening; follow my profile to find me.#Gate两大币种合约成交额跻全球前三
post-image
BTC+0.93%
What's about to happen this year is going to be incredible #BitcoinTops$82K #WarshIMFSpeech #GateBTCAndETHFuturesVolumeRanksTop3
An intriguing visualization of time: life is like a dream, and time flies...
Every experience along the way has its own unique charm.
Beautiful moments are worth savoring. Life is full of endless possibilities.
Take time to truly experience it.
10x Research said the crypto market broadly sold off last week, with altcoins falling significantly more than Bitcoin: 141 tokens declined by an average of about 14%, while BTC fell about 3%. Funding conditions came under pressure, with trading volume down, stablecoin supply contracting, and ETF net outflows; however, options pressure was not high, speculative positions in CME futures were near highs, and derivatives had yet to fully reflect spot market weakness. It recommended watching key technical levels for BTC, ETH positioning, and altcoin fund flows.
post-image
BTC+0.87%
ETH+0.64%
CME+1.49%
Right or wrong doesn't matter
I only do what I can understand
I leave the rest to time and the market
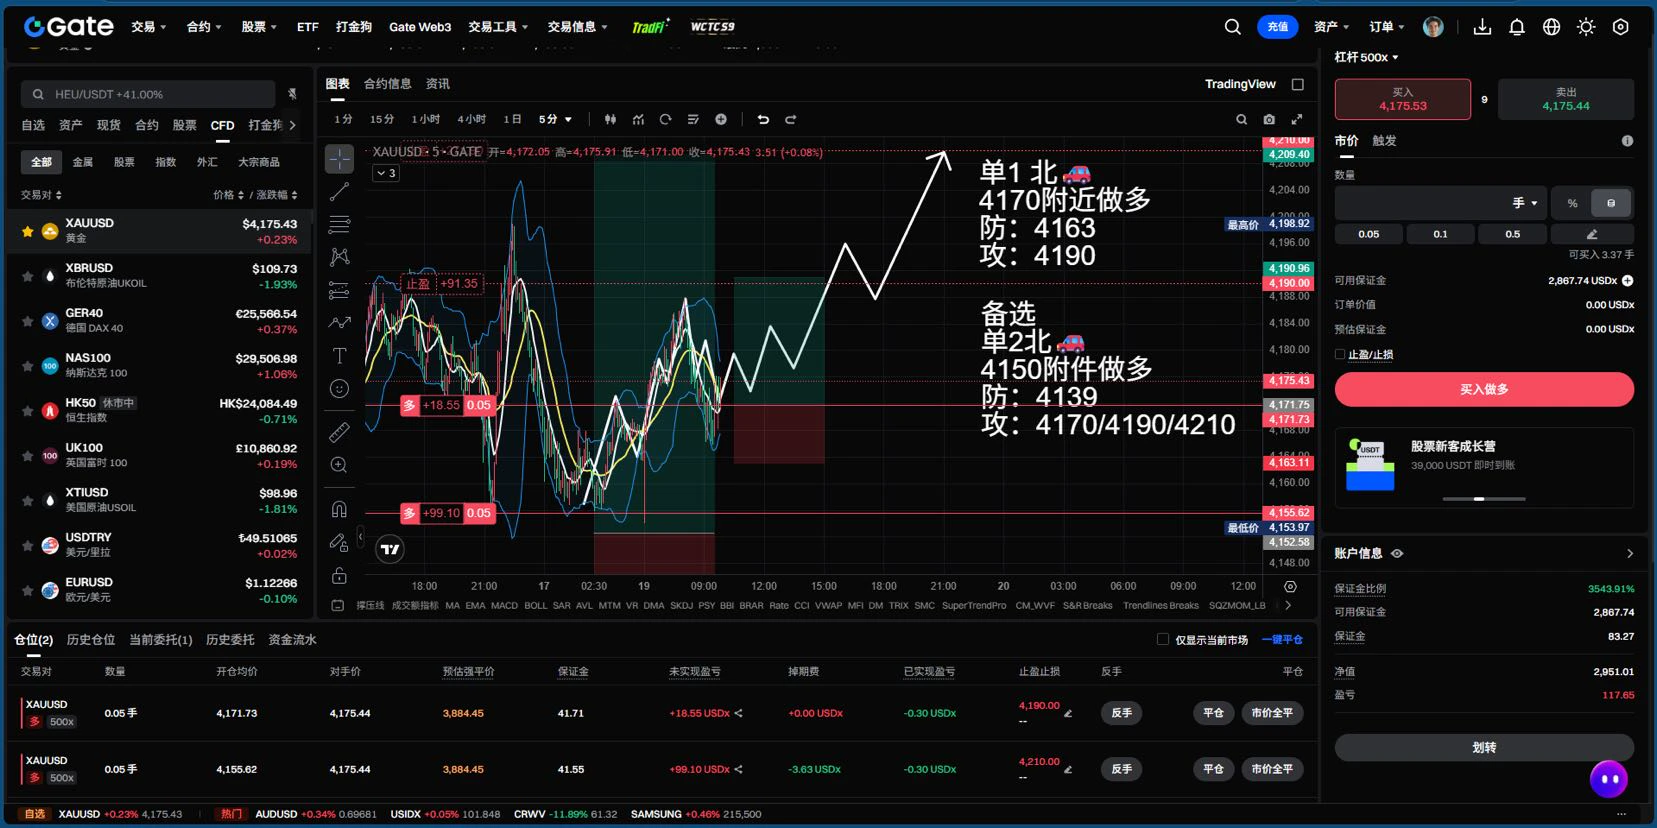
I only document myself; those who understand will find their own connection#TradFiCFD黄金大师赛 $XAUUSD ‌
post-image
XAUUSD+0.38%
$KORU Are Korean chaebols about to start bailing out the market?
$SNDK
KORU+12.20%
SNDK+5.27%
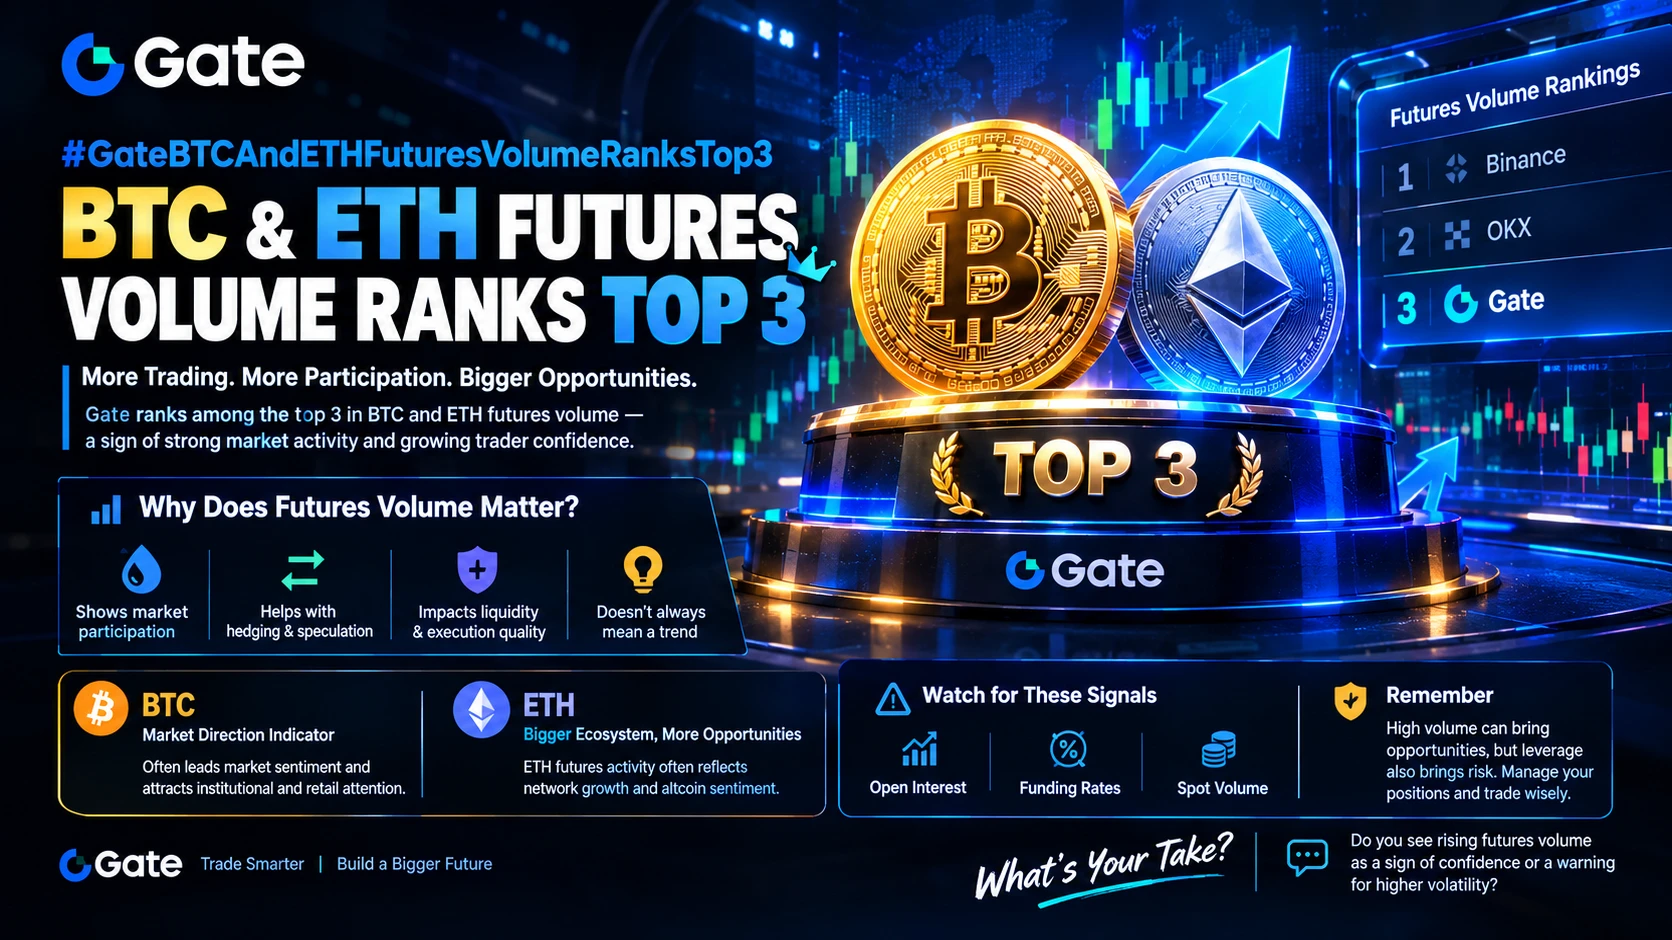
#GateBTCAndETHFuturesVolumeRanksTop3 Gate BTC and ETH Futures Volume Ranks Top 3: What Is Driving the Market?
Big money does not move through the crypto market without leaving clues. One of the most important clues traders watch is futures trading volume.
Bitcoin and Ethereum remain at the center of the cryptocurrency derivatives market, and Gate's reported top-three ranking in BTC and ETH futures volume highlights the importance of its role in this highly competitive trading environment.
But what does a top-three ranking actually tell us? And why should ordinary crypto traders pay attention?
post-image
BTC+0.93%
ETH+0.71%
  • 9
  • 1
live market update
live-cover
LIVE2,038
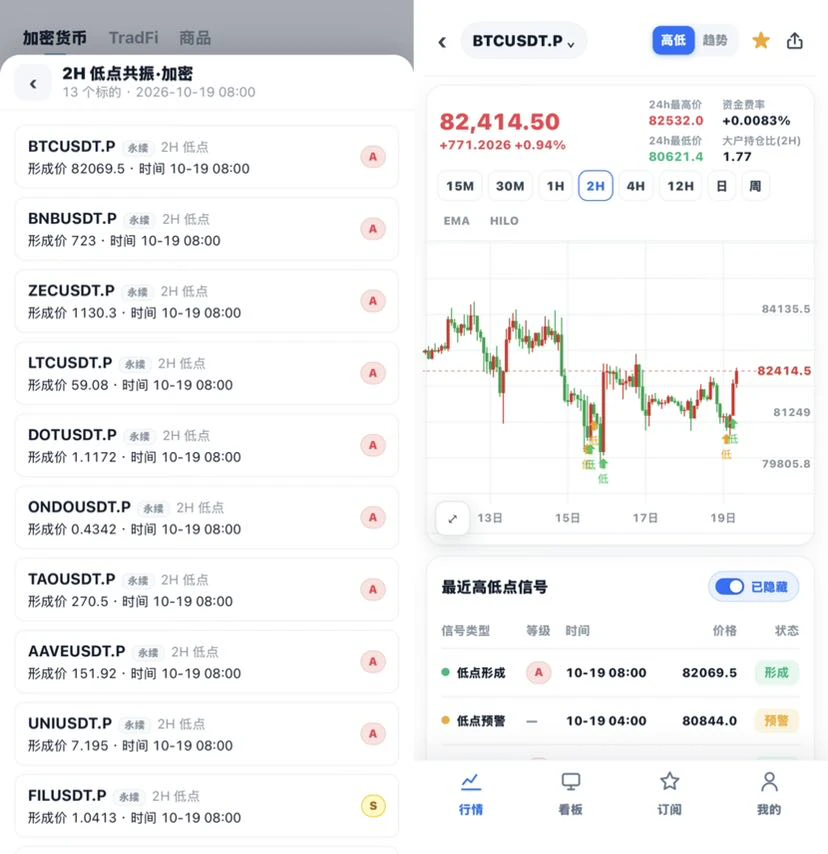
There wasn't much market action over the weekend, but things suddenly picked up on the first weekday. Can this wave of convergence sound the charge for a rebound? #比特币突破8.2万美元
post-image
BTC+0.87%
Honestly, there’s something about $SPX 6900 that just hits different.
It’s not just about the price or the next big pump. It’s about being part of something that most people still don’t understand.
I like the idea of believing in a meme, a community, and a vision.
People laugh. People doubt. That’s part of the game.
But imagine sticking around, watching the community grow, and one day looking back at how it all started.
Maybe we’re crazy. Maybe we’re early. Maybe both. 😂
6900 > 500. 🗿
BELIEVE IN SOMETHING. $SPX6900 🚀
post-image
SPX-1.66%
MEME-0.97%
Load More

Join 40 M users in our growing community

⚡️ Join 40 M users in the crypto craze discussion

💬 Engage with your favorite top creators

👍 See what interests you

Trending Topics

USSeptemberPPIBeatsExpectations

91.35k Views1.94k Discussing

US September PPI came in at 6.3% YoY, well above the 5.3% market expectation, pointing to renewed producer-side inflation pressure. Weekly jobless claims were 199K, broadly in line with forecasts. Could hotter inflation further reduce room for rate cuts, and what does it mean for $BTC, US stocks, and gold?

GateWCTCS9GlobalTradingCompetition

37.87k Views6.86k Discussing

GateBTCAndETHFuturesVolumeRanksTop3

53.8k Views1.97k Discussing

View More