




Share your thoughts
placeholder
Article
Brad cannot say a price. He is a CEO.
So he follows exactly 589 accounts.
The XRPL Foundation cannot say a price either.
So it hid 5, 8 and 9 in a picture.
589 was never a number. A password.
It is the sentence nobody in the room is allowed to say out loud.
1.3M followers is a bonus.
This was purely the market being in a good mood and casually tossing out some coins, which just happened to land on my head. A few days ago in the afternoon, while watching $BNB ’s order book, I noticed something was off: the price kept hovering around 661.30, but every time it was pushed down, buyers quickly absorbed it. Signs of strengthening buying pressure at the bottom can’t be faked. I added to my long position amid the repeated intraday swings and didn’t say much to anyone, posting only one line: “Hold after the pullback, let’s test the waters.” Before long, the trend started fulfilling
post-image
BNB+7.28%
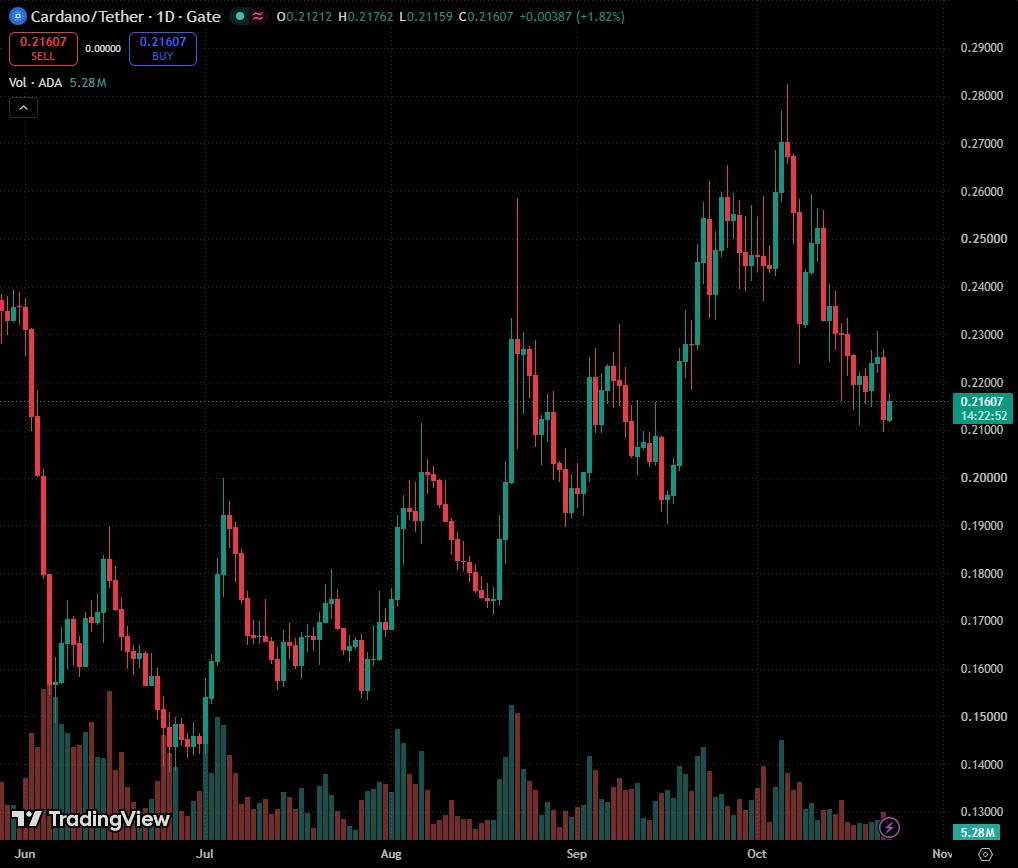
ADA+3.19%
SNDK+1.65%
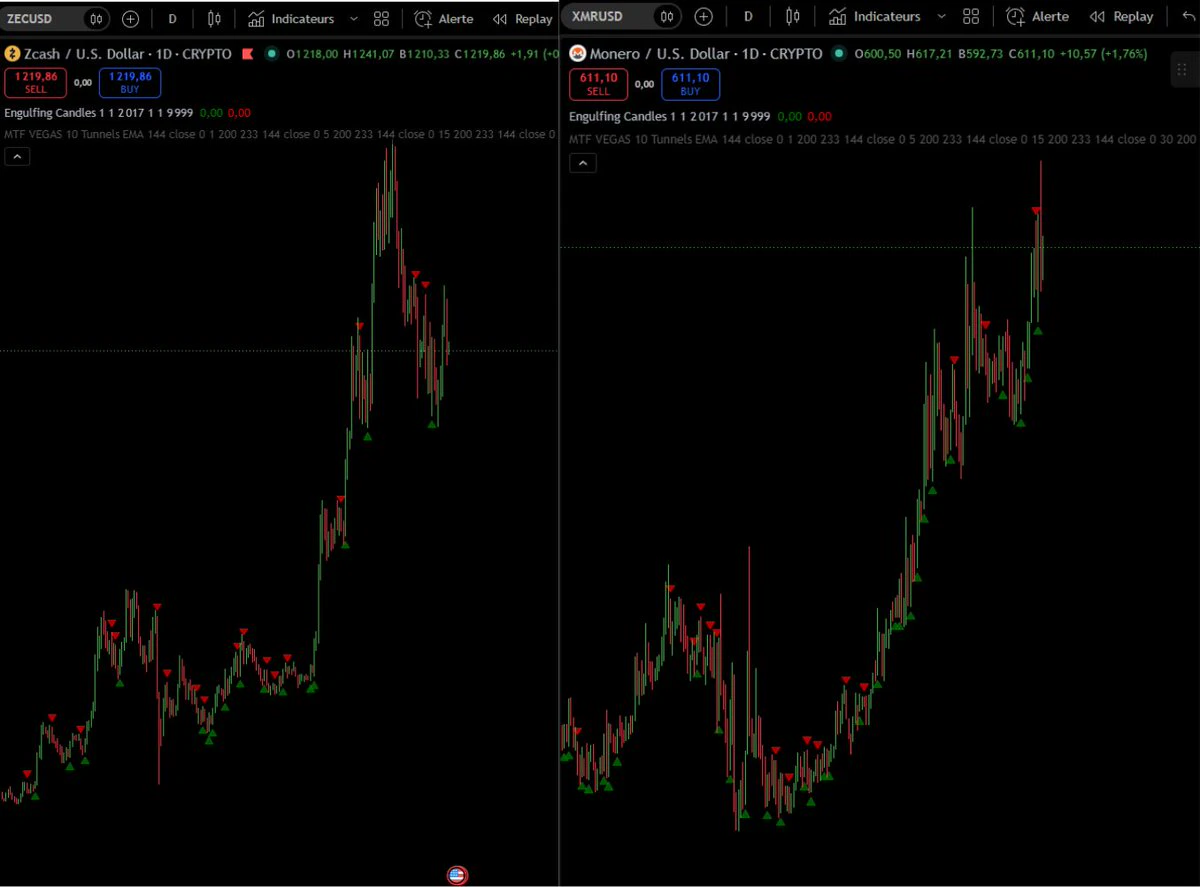
Everyone’s chasing the next 100x, but ZEC just printed a 95% confidence LONG signal while retail is asleep.

$ZEC /USDT - LONG

Trade Plan:
Entry: 1002.66 – 1010.92
SL: 967.12
TP1: 1036.55
TP2: 1056.38
TP3: 1086.14

Why this setup?
- 4h structure aligns with the daily bullish trend, but the 15m RSI (36.18) is oversold—this is the classic "pullback in an uptrend" setup.
- Entry zone is tight (1002–1010), giving us a low-risk trigger right at the 1h pivot (1006.79).
- Why now? The ATR (16.53) suggests volatility is compressing—breakout fuel is building. Target 1 is 3% away, but TP2 (1056)
ZEC-1.17%
Nonfarm payrolls beat expectations—should BTC be cautious? The real pressure comes from here
U.S. nonfarm payrolls increased by 162,000 in August, far exceeding market expectations, while the unemployment rate held at 4.1%. After this data was released, the market's first reaction was very direct: expectations for Fed rate cuts cooled, and interest rates once again became the “sword of Damocles” hanging over risk assets.
For BTC, this logic is particularly important.
Over the past period, one of the core narratives driving the crypto market higher has been improving liquidity. If the U.S. econ
NVDA+0.87%
  • 45
okay hot take guys
if you do not have insider info or (info) and you are trading memes
you are going to lose 99%
also if your fomo account is not an advert board for memecoins you will not make it
do not be fooled
$ETH Signal】1H momentum breakout, go long with the trend
$ETH 1H MACD histogram reaches +3.64, and the price breaks above the 1H Bollinger upper band at 2474.0339.
🎯 Direction: Long
⚡ Entry/pending order: 2469.9479 - 2477.3800
🛑 Stop-loss: 2452.6062
🚀 Target 1: 2514.5407
🚀 Target 2: 2533.1210
🛡️Trade management:
- Execution strategy: After reaching Target 1, reduce the position by 50% and move the stop-loss up to breakeven. If the price falls back to the entry level, exit automatically to protect the principal.
The 1H histogram is expanding, while the 4H histogram is converging, with s
post-image
ETH+1.09%
BTC-2.35%
SOL+1.85%
Why did Arbitrum get so arbitrary? Because it decided to surge without warning.
$ARB ‌ARB/USDT – Up 24%, facing resistance near 0.17045
Short (rejection from resistance)
Entry Zone: 0.1660 – 0.1680
TP1: 0.1620 / TP2: 0.1580 / TP3: 0.1540
SL: 0.1720
Long (pullback to support)
Entry Zone: 0.1580 – 0.1590
TP1: 0.1620 / TP2: 0.1660 / TP3: 0.1700
SL: 0.1550
Key Levels
Resistance: 0.16665 / 0.17045 (recent peak)
Support: 0.1620 / 0.15904 / 0.14764 / 0.13623
⚠️ Not financial advice. DYOR and manage your risk.
ARB+27.92%
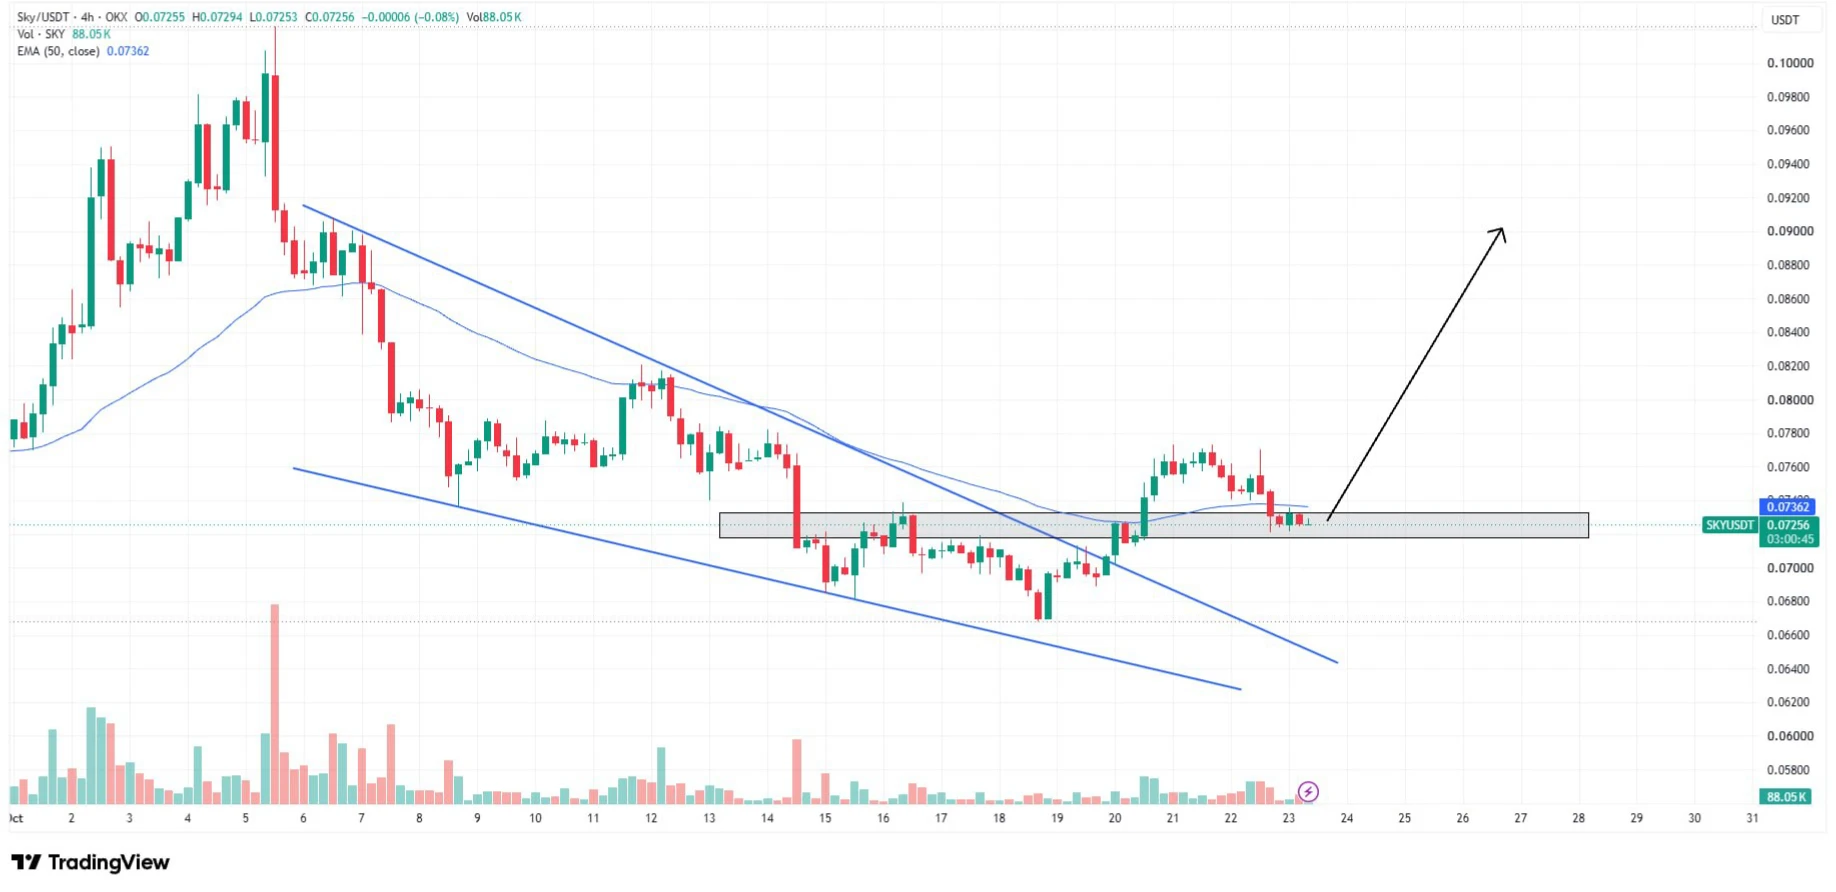
Everyone’s staring at H/USDT’s bounce—but the 4H tape just whispered a secret that 95% of traders will ignore.

H/USDT - SHORT

Trade Plan:
Entry: 0.07631 – 0.07705
SL: 0.08024
TP1: 0.07401
TP2: 0.07222
TP3: 0.06955

Why this setup?
- RSI (15m) is pinned at 33.52—weak momentum, not oversold enough to reverse a bearish 1D trend.
- ATR (1h) at 0.001485 means volatility is contracting—perfect setup for a liquidity sweep below 0.07631.
- With TP1 at 0.07401 and TP2 at 0.07222, the path of least resistance is down, not up.
- Why now? The 0.07960 invalidation is miles away, giving shorts ro
There was clearly a key level above, but the price simply refused to pull back and retest it, grinding sideways near the highs. This kind of rhythm is the most painful for those without a position. I entered my long after the breakout on the pullback, with an entry reference around 0.3520. After several repeated wicks failed to break the level, I confirmed that the market was temporarily strong.
After the price reached near the target zone today, I took profit on 80% of the position directly, first reducing the risk on this trade. I did not close the remaining 20% either, tightening the stop-l
post-image
ZEC-1.17%
LAB+2.80%
Everyone’s watching the 1D trend—but 95% confidence shorts on $LAB /USDT are the quiet exit liquidity.

$LAB /USDT - SHORT

Trade Plan:
Entry: 0.07491 – 0.07539
SL: 0.07742
TP1: 0.07345
TP2: 0.07232
TP3: 0.07062

Why this setup?
Why now? The 4h structure is breaking, and the 1D trend is already bearish—this isn’t a guess.
- RSI 15m at 58.79 shows a weak bounce, not a reversal.
- Entry zone 0.07515–0.07539 aligns with the last defense before TP1 at 0.07345.
- ATR 1h (0.000944) says volatility is compressing—breakouts punish late longs.

Debate:
If the 1D trend is bearish and confidenc
LAB+2.80%
Everyone’s staring at Bitcoin—but ZEC just flashed a 95% long signal that nobody sees yet.

$ZEC /USDT - LONG

Trade Plan:
Entry: 1009.13 – 1017.39
SL: 973.59
TP1: 1043.02
TP2: 1062.85
TP3: 1092.61

Why this setup?
Why now? The 4H timeframe is primed while the 1D trend stays bullish. RSI on the 15m sits at 40.87—cooling off without breaking down. That’s the sweet spot: entry ref at 1013.26, with TP1 at 1043 and TP2 at 1062.85. ATR shows controlled volatility (16.53), so the move isn’t overheated. This is a textbook pullback-buy setup, not a chase.

Debate:
Are you loading ZEC before TP2, o
ZEC-1.17%
15 years ago today, Bitcoin was $8
Me 15 years ago :
post-image
BTC+0.07%
Awaiting the next shot.

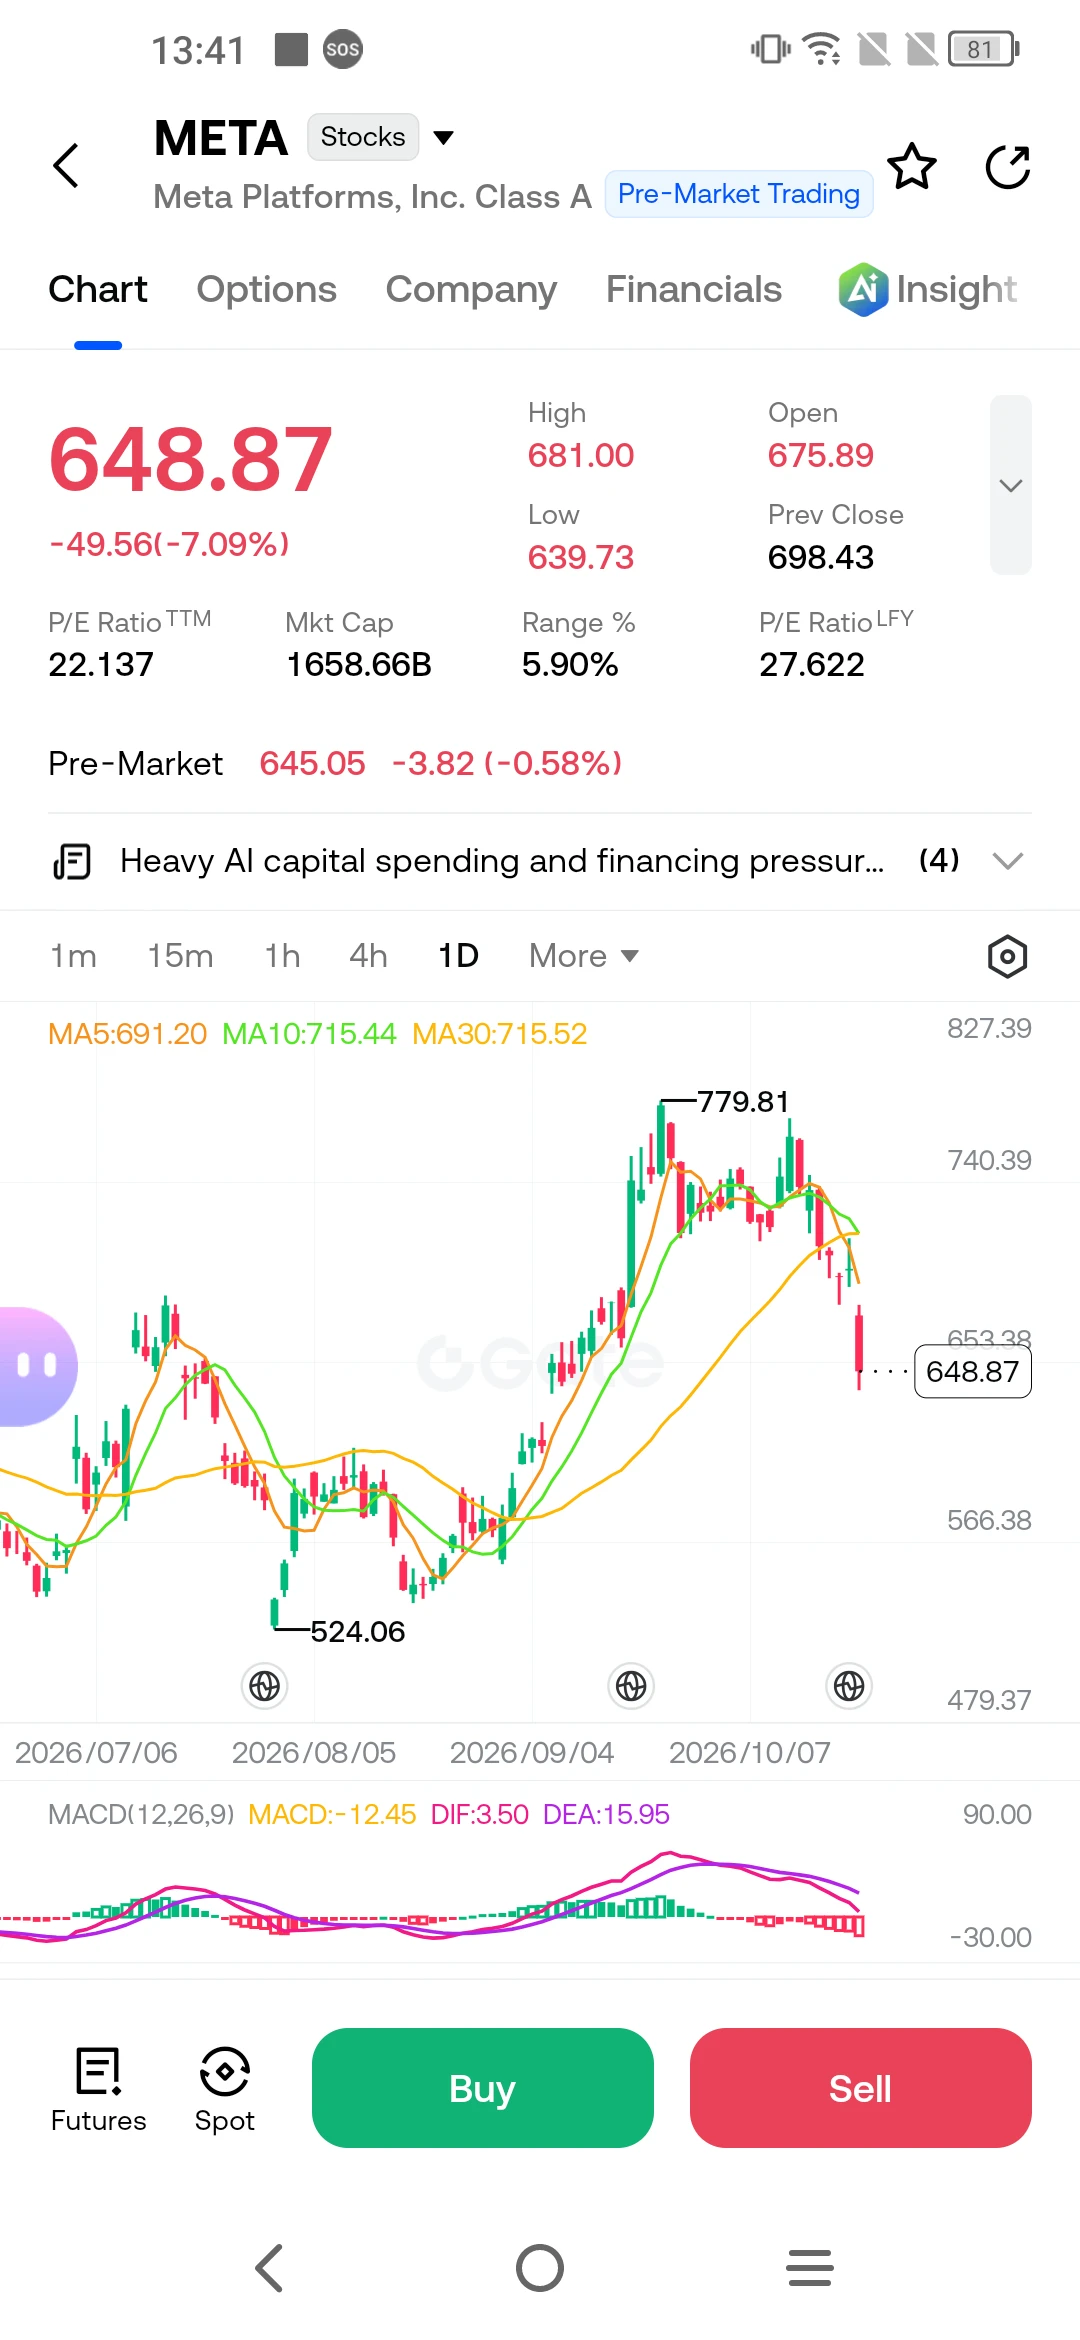
$BNB $SNDK
post-image
BNB+7.28%
SNDK+1.65%
BTC MARKET UPDATES
live-cover
LIVE20
crypto market prediction
live-cover
LIVE23
$PI Pi doesn't have what it takes. TRB is the real deal.
post-image
PI+1.43%
Everyone’s long XRP, but this 4h setup says the rug is already being pulled.

$XRP /USDT - SHORT

Trade Plan:
Entry: 1.4119 – 1.4165
SL: 1.4361
TP1: 1.3978
TP2: 1.3868
TP3: 1.3704

Why this setup?
- Price is pinned at 1.4142 with a hard ceiling of 1.4165—rejection zone is razor thin.
- 1D trend is range, not breakout, so 55% SHORT confidence is the edge here.
- RSI 15m at 56.86 shows weak momentum—no fuel to break the range high.
- TP1 at 1.3978 is only 1.2% away; TP3 at 1.3704 is a 3% drop in a dead market.
- Invalidation at 1.4049 means the floor is already cracking under your fee
XRP+1.28%
This $ENA long position has really tested my patience. After entering around 0.15082, it kept grinding sideways. Several pullbacks in between swept the stop-losses of quite a few people, but I knew that as long as the bull-bear dividing level held, the consolidation was within the normal range. The price just surged to 0.16741, with unrealized profit reaching around +529.79%. I reduced the position by 70% as planned, and moved the protection level directly higher on the remaining 30%, so even a pullback from here won't affect my principal.

The most important thing in holding this position wa
post-image
ENA+2.87%
LAB+2.80%
DOGE+7.32%
Nobody’s watching $ESPORTS /USDT while it silently sets up a 95%-confidence trap.

$ESPORTS /USDT - SHORT

Trade Plan:
Entry: 0.01482 – 0.01490
SL: 0.01525
TP1: 0.01457
TP2: 0.01437
TP3: 0.01408

Why this setup?
Why now?
- 4H bias is SHORT with 95% confidence—that’s not a guess, that’s a loaded gun.
- Daily trend is bearish, and the 15m RSI at 60.2 is giving a dead-cat bounce, not a reversal.
- Entry zone 0.01482–0.01490 sits right under the 1h pivot—price is kissing resistance that’s held all week.
- Targets are mapped: TP1 0.01457, TP2 0.01437, TP3 0.01408. That’s a 5% drop from h
ESPORTS+1.70%
Everyone’s long $CL /USDT at 91.78—except the 4h tape just whispered a secret.

$CL /USDT - SHORT

Trade Plan:
Entry: 91.69 – 91.87
SL: 92.60
TP1: 91.17
TP2: 90.76
TP3: 90.14

Why this setup?
Why now?
- 1D is range-bound, so no breakout fuel—only mean reversion.
- 15m RSI at 60.4 is fading; momentum is stalling right at resistance.
- ATR (1h) at 0.34 means tight stops—but TP1 at 91.17 is a 0.6% drop that respects the range floor.
- Confidence is weak (55), so this is a scalp, not a saga.

Debate:
Are you fading the 91.78 pop for TP1, or does the range fake you out into 92.39 first?
CL+0.58%
Load More

Join 40 M users in our growing community

⚡️ Join 40 M users in the crypto craze discussion

💬 Engage with your favorite top creators

👍 See what interests you

View More