Square
Following
Hot
News
Profile
Share your thoughts
placeholder
Article
Bitcoin’s bottom range has held support since the breakout on September 21, then failed again near 87k. Now let’s see if there’s some relief… If this can hold, we’ll see some nice developments again. Is this a good rebound/recovery area…? Accumulation range?? Best buying opportunity?? $BT
post-image
BTC-1.80%
Those who added to their BTC2415 position made big profits; those who added at BTC80500 made big profits; those who shorted ETH2542 last night made big profits—140 points.
post-image
I need the next #10000x runner 💪
Ticker is?
post-image
I just opened a quick short trade on $GTC
. The entry price is now 0.21071 or 0.21500. The first target is 0.2000, the second is 0.19500, the third is 0.19000, and the final one is 0.18500++. Set the stop-loss above 0.23500.
post-image
Profit taking stays light against past cycles. Weekly Net Realized Profit/Loss, the net dollar gain locked in when coins change hands, runs well below the average week at the 2024 and 2025 tops. Its pace in this rally, the right-hand band on the chart, is close to the start of the last uptrend in late 2023, the left-hand band.
The sellers have changed, though. Long-term holders, who have held their coins for more than 155 days, nearly doubled their realized profit in the week to September 29 against the week of the breakout, and their share of all realized profit rose from 34% to 55%. Should w
post-image
  • 3
  • 2
The entire sector is broadly up, so why is AMP more worth watching?
The answer lies in the mismatch between relative strength and volatility elasticity. $AM is up 17.65% over 24h, outperforming $PYTH at +14.11% and $AERO at +3.99%, yet its RSI is only 55.4, the lowest among the three—AERO has reached 60.9, while PYTH is as high as 66.5 and nearing the Bollinger upper band at 0.08389. AMP, meanwhile, is currently at 0.00068, still above the Bollinger middle band, with approximately 11% room remaining to the upper band at 0.00075698. This means AMP combines “leading gains with non-overheated
post-image
AERO+5.37%
  • 1
🟢Uptober!
Which community will build up?
#crypto #gems
post-image
GEMS-3.87%
$BTC belongs to a crazy bull market for small altcoins, unrelated to Bitcoin and mainstream coins—small altcoins are so exhilarating.
BTC-1.80%
$ROBO
Ah, my donkey friend.
So you’re going to become a dragon, are you?
Without giving any investment advice, I’m just waiting for you for my own sake, buying little by little.
😎😉
ROBO-8.22%
Many people chase after seeing a large bullish candle, and assume there is still room to rise when RSI has not crossed 70—this is a typical misreading of “strength” as “safety.” $RLC is in exactly this situation now.
Technically, $RLC is currently priced at 0.8609. MA5=0.90236 has crossed above MA20=0.778535, confirming a bullish moving-average alignment and a moderately bullish medium-term structure. However, the price has fallen back below MA5, and short-term momentum has weakened somewhat. The MACD histogram remains at +0.01407, with bullish momentum not yet reversed, but caution is warra
post-image
RLC+29.20%
SOL-5.09%
MINA-17.31%
10.9 Morning
Sharing the latest view on BTC’s future price trend
The price fell to around 80.4K at its lowest last night
The 80,000 round-number level held, and the market has already reacted
The worst-case scenario in the short term is a break below and recovery of 80,000
At the extreme, it will not break below 79.3K; otherwise, much of the bull market foundation would be destroyed
So we are not the only ones defending this level; some major players are as well
If the rise from 75K to 87K is regarded as the fifth wave of the advance from the bottom, then 87.4K–82.5K is the A wave of the decli
post-image
BTC-1.80%
$RLC is moving, but trading volume has yet to confirm it, which is more worth watching than the 24-hour gain of +28.83%.
I’m watching just one divergence: whether there will still be support after a breakout above 1.0845. The current price is 0.8619, with volume at 0.11x. The 1-hour and 4-hour trends are both strong, with RSI readings of 59 and 53, respectively.
If volume continues to expand after breaking above 1.0845, control will favor the bulls; if it falls below 0.6515 and fails to reclaim it, the short-term view is invalidated, and the next level to watch shifts to 0.3637.
Don’t rush to
post-image
RLC+28.99%
No complaints about this $AIOT trade.
Take it while the money is still there. Close here. ROI: 358% Funds: 2290 USDT Market watch: $BT : Current price 81,773.4 - 24-hour change: -1.73%
$Q : Current price 0.026155 - 24-hour change: +21.99%.
post-image
AIOT-11.49%
Bottom accumulation is complete, and room for a rebound in gold prices is gradually opening up
Recently, the market has continued to digest U.S. employment data. The slight cooling in employment data has raised market expectations for subsequent policy adjustments, providing support for gold prices.
From the four-hour chart, the price has gradually recovered from its previous low. Support from the lower Bollinger Band has held, and the market is moving upward toward the middle Bollinger Band. The RSI indicator is steadily rising, moving out of the low range, while bullish momentum continues to
post-image
XAU+0.79%
if you need someone to blame today, please direct your ire to @DejaBrewTrades and his devil magic pivots.
post-image
The Greed Index is still at 64, so why has $NEAR fallen much harder than the broader market?
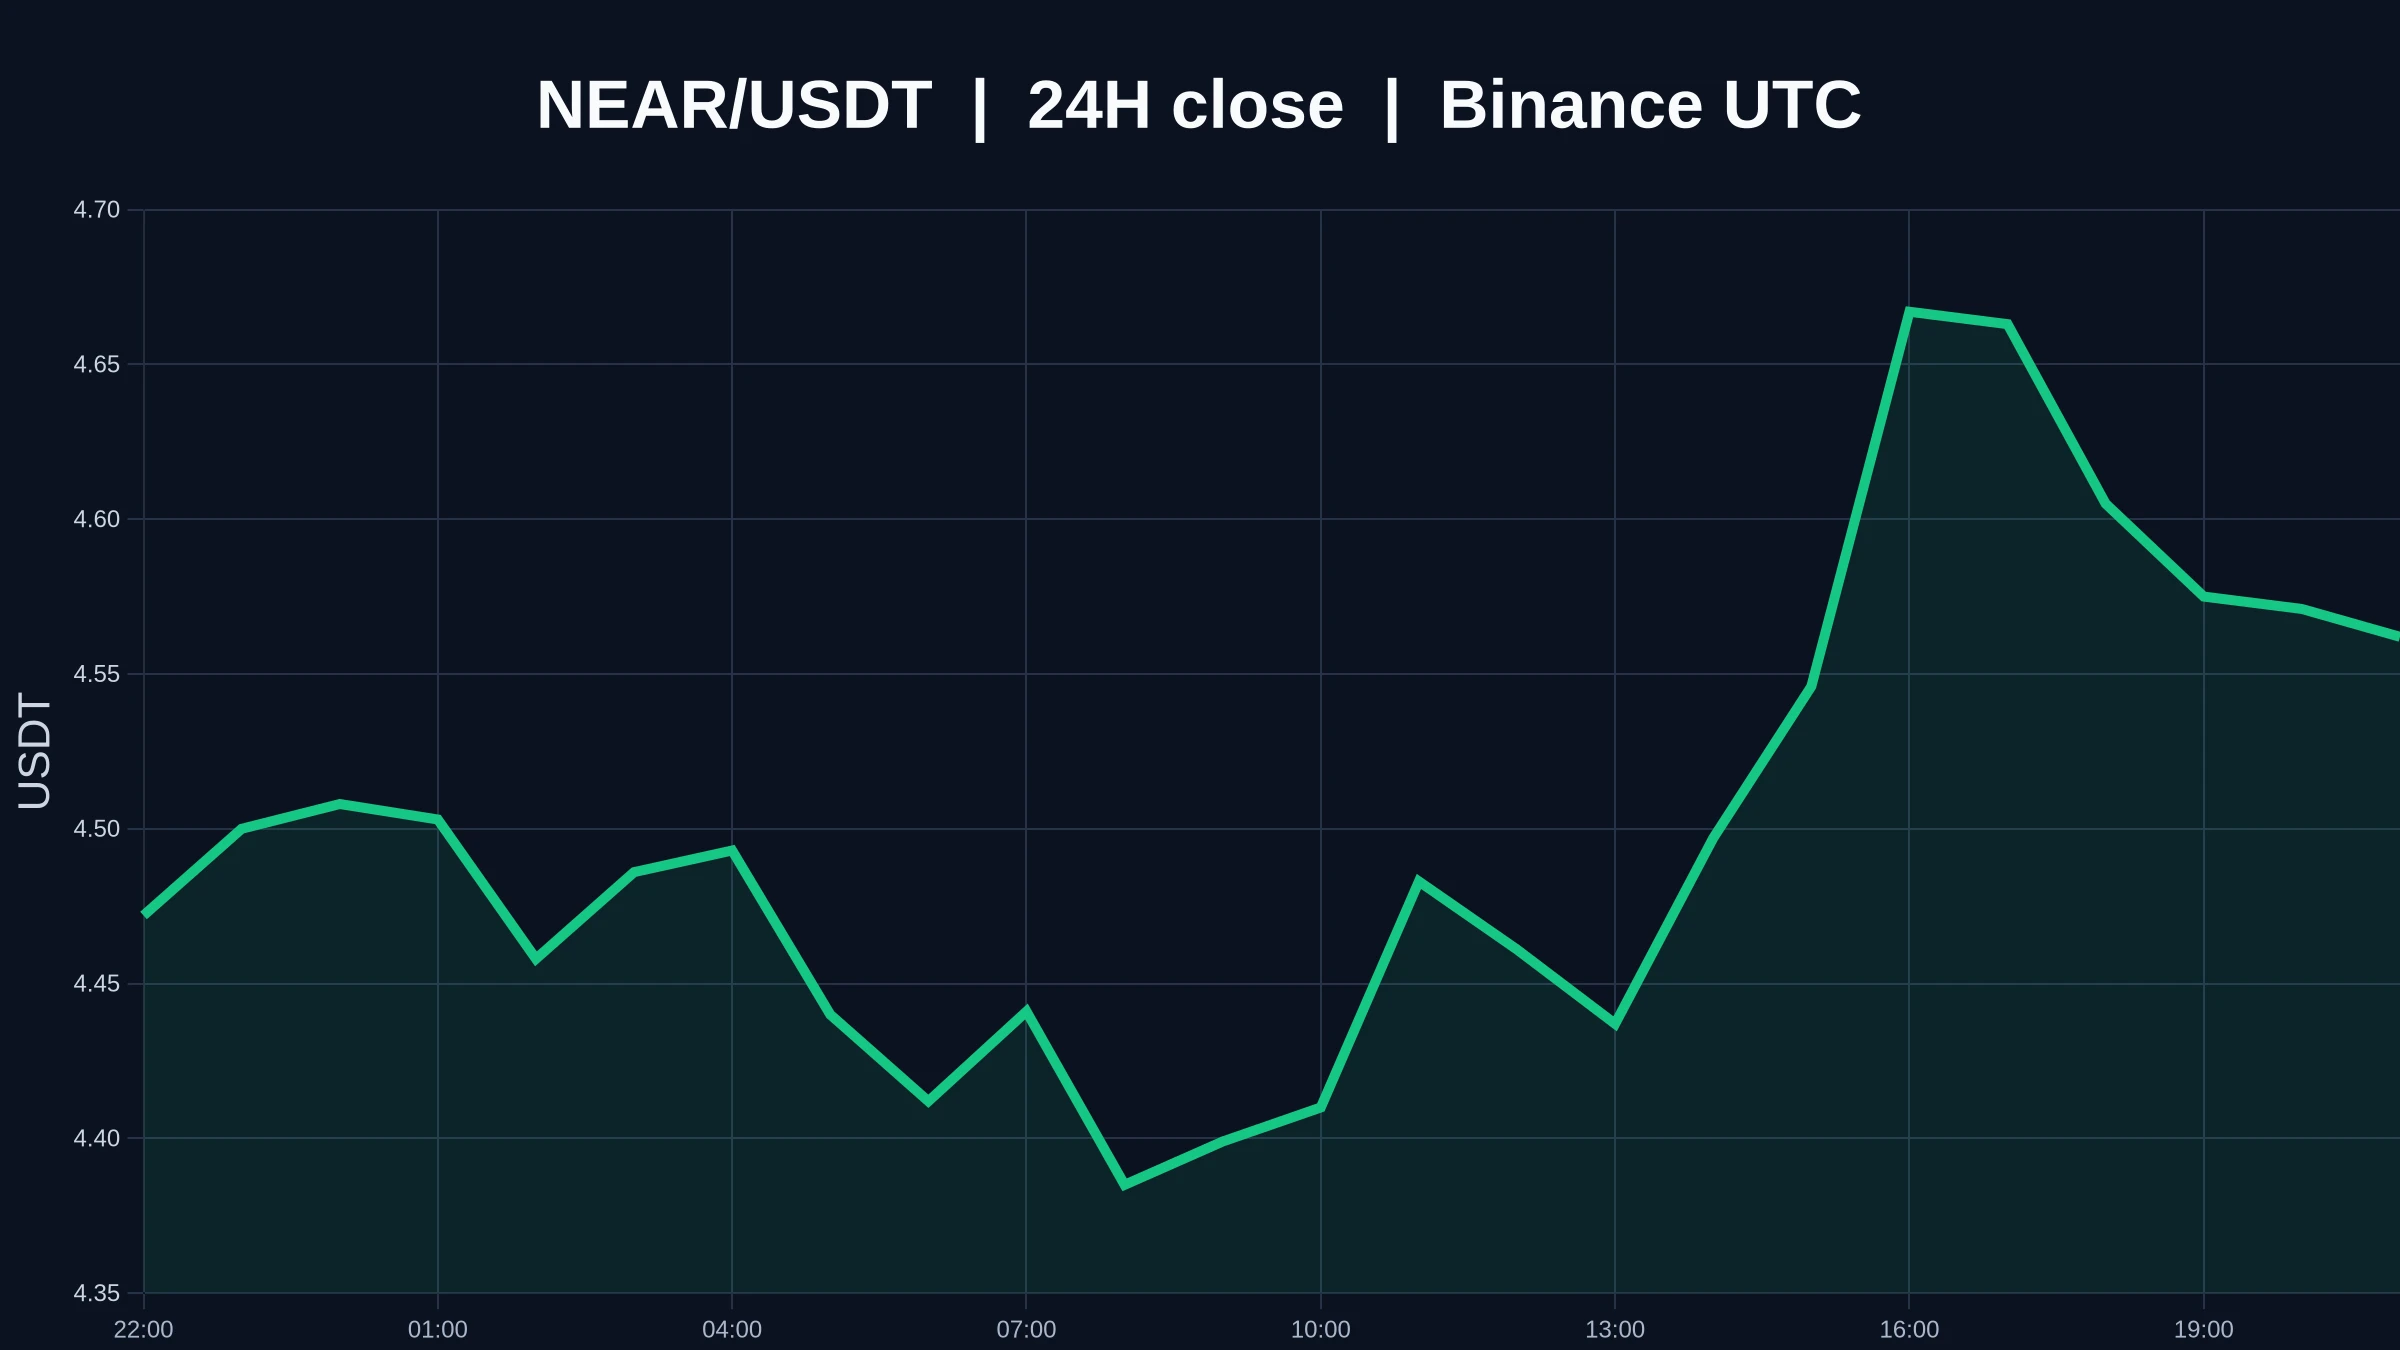
The answer lies in a structural mismatch: broader market sentiment is relatively warm, but $NEAR's 24h decline has reached -14.71%, with its current price of 4.533 falling below MA5 (4.5512) and MA20 (4.9626), forming a bearish moving-average alignment; RSI is only 31.1, nearing oversold territory, while the MACD histogram at -0.05263 continues to show bearish momentum. The lower Bollinger Band at 4.2513 is the nearest psychological support. The funding rate is -0.0044%, meaning shorts are paying longs
post-image
AMP+22.38%
PUMP hit by reverse-engineering access revocation -7.9%, rebounds +2.41%; I’m bullish
$PUMP Access was revoked through reverse engineering last night; current price 0.00568, 24h -7.9%, yet the chart didn’t collapse: after the incident, it moved from 0.005557 to 0.005691, rebounding +2.41%. I’m directly bullish at this level.

The daily structure remains intact—RSI 65.2 is strong, MACD has remained above the zero line for 11 days since the bullish crossover, MA7 has stayed above MA30 for 14 days, and the short-term moving averages remain in a bullish alignment.

Funds haven’t fled either—OI v
post-image
PUMP-9.62%
crypto market update
live-cover
LIVE23
[new streamer] btc market update
live-cover
LIVE88
Load More

Join 40 M users in our growing community

⚡️ Join 40 M users in the crypto craze discussion

💬 Engage with your favorite top creators

👍 See what interests you

Trending Topics

Gate Money Officially Launches

3.45k Views12.87k Discussing

Gate officially launches Gate Money, a global integrated financial services app that brings digital assets, fiat, stocks, ETFs, gold, bank accounts, and payments into one Gate App. Users can manage assets, invest, send and receive funds, convert currencies, and make payments — all from a single account. Which use case are you most excited about? [👉 Learn more](https://www.gate.com/announcements/article/102094)

Fed September Minutes Lean Hawkish

64.14k Views2.72k Discussing

Samsung Q3 Operating Profit Surges 782.5%

36.88k Views1.93k Discussing

View More