Square
Following
Hot
News
Notifications
Profile
Share your thoughts
placeholder
Article
How can you quickly reset your trading mindset after consecutive BTC losses?

In BTC futures trading, consecutive losses are a phase many traders experience. The real danger is not the losses themselves, but the chain reaction that follows: rushing to recoup losses, opening positions frequently, continually increasing leverage, and even starting to go against the original trading plan. In the end, an ordinary loss can turn into a greater risk to the account.

So how should you adjust after consecutive losses?

First, stop impulsive trading. If you lose on several consecutive trades, don't rush
post-image
BTC-0.65%
#GateLaunchesPoSECProofOfSecurity
In the fast-moving world of digital assets, trust is everything. Users entrust exchanges with their hard-earned funds, and every major incident reminds us how fragile that trust can be. Gate has just taken a meaningful step forward by officially launching **Proof of Security (PoSEC)** — a new framework that goes beyond traditional Proof of Reserves (PoR) and focuses on something equally critical: *how* assets are actually stored and whether they can survive an extreme loss scenario.

This is not just another marketing announcement. It is a direct response to t
  • 3
Trenches
ZIG
Z
bade
b
ZIG
0x8c...1145
Market Cap
$.
Change
.
24h Vol
$.
Holders
.
BTC
B
bade
b
BTC
C5xp...pump
Market Cap
$.
Change
.
24h Vol
$.
Holders
.
CORLA
C
bade
b
CORLA
0xba...7777
Market Cap
$.
Change
.
24h Vol
$.
Holders
.
STONK
S
bade
b
STONK
6GmA...UNgx
Market Cap
$.
Change
.
24h Vol
$.
Holders
.
DESSA
D
bade
b
DESSA
npz2...pump
Market Cap
$.
Change
.
24h Vol
$.
Holders
.
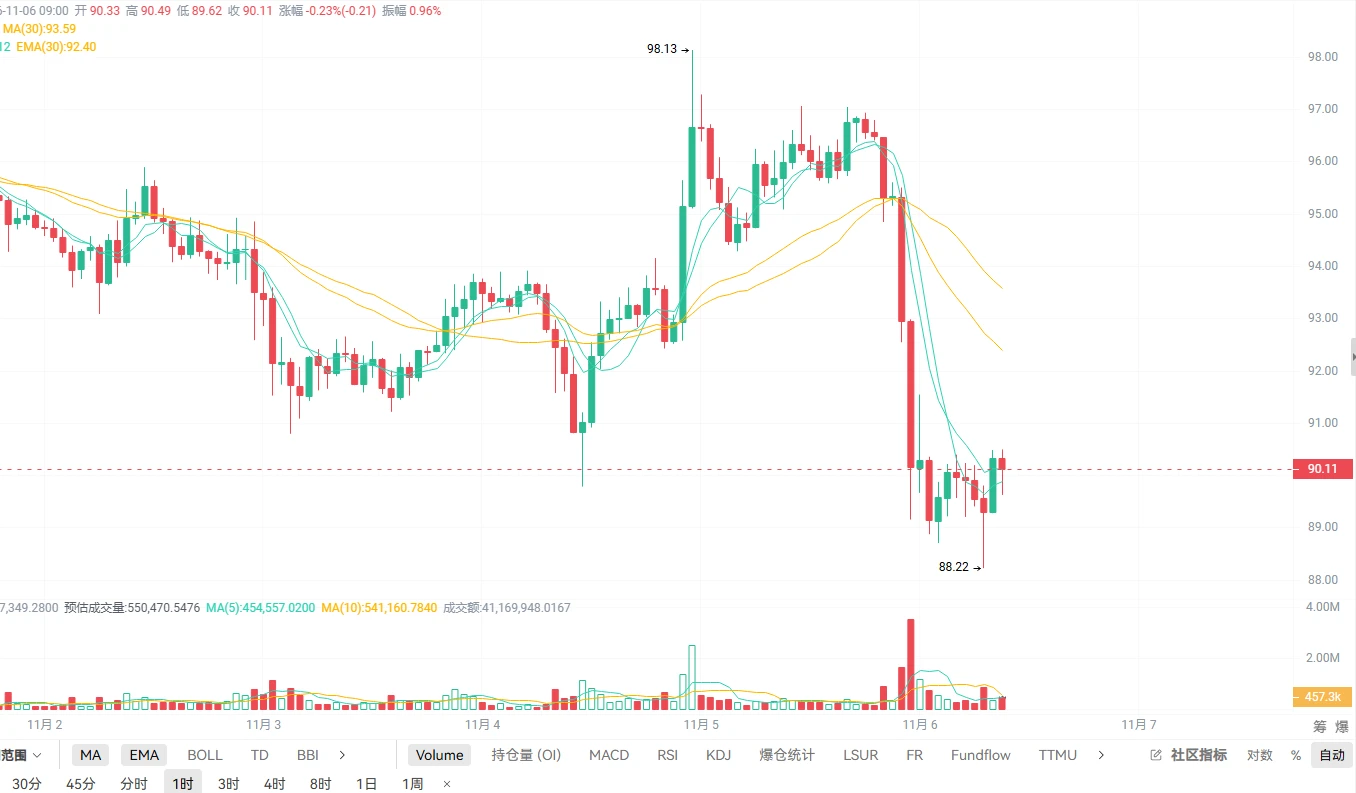
11.06 SOL Market Analysis

Short: around 91.50-92.00, stop-loss at 93.20, targets 89.50/88.30.

SOL is currently at 90.24. After a sharp drop from a high of 98.12 to 88.30, the market is now moving sideways weakly near the lows. The moving averages remain in a downward alignment, and rebound momentum is extremely weak. The overall bearish trend remains unchanged.

The 91.50-92.00 area above is both a secondary consolidation platform from the previous decline and a resistance zone aligned with the 1-hour EMA10 and EMA20. Chasing shorts directly at this stage offers limited room, so the strategy
post-image
SOL-0.74%
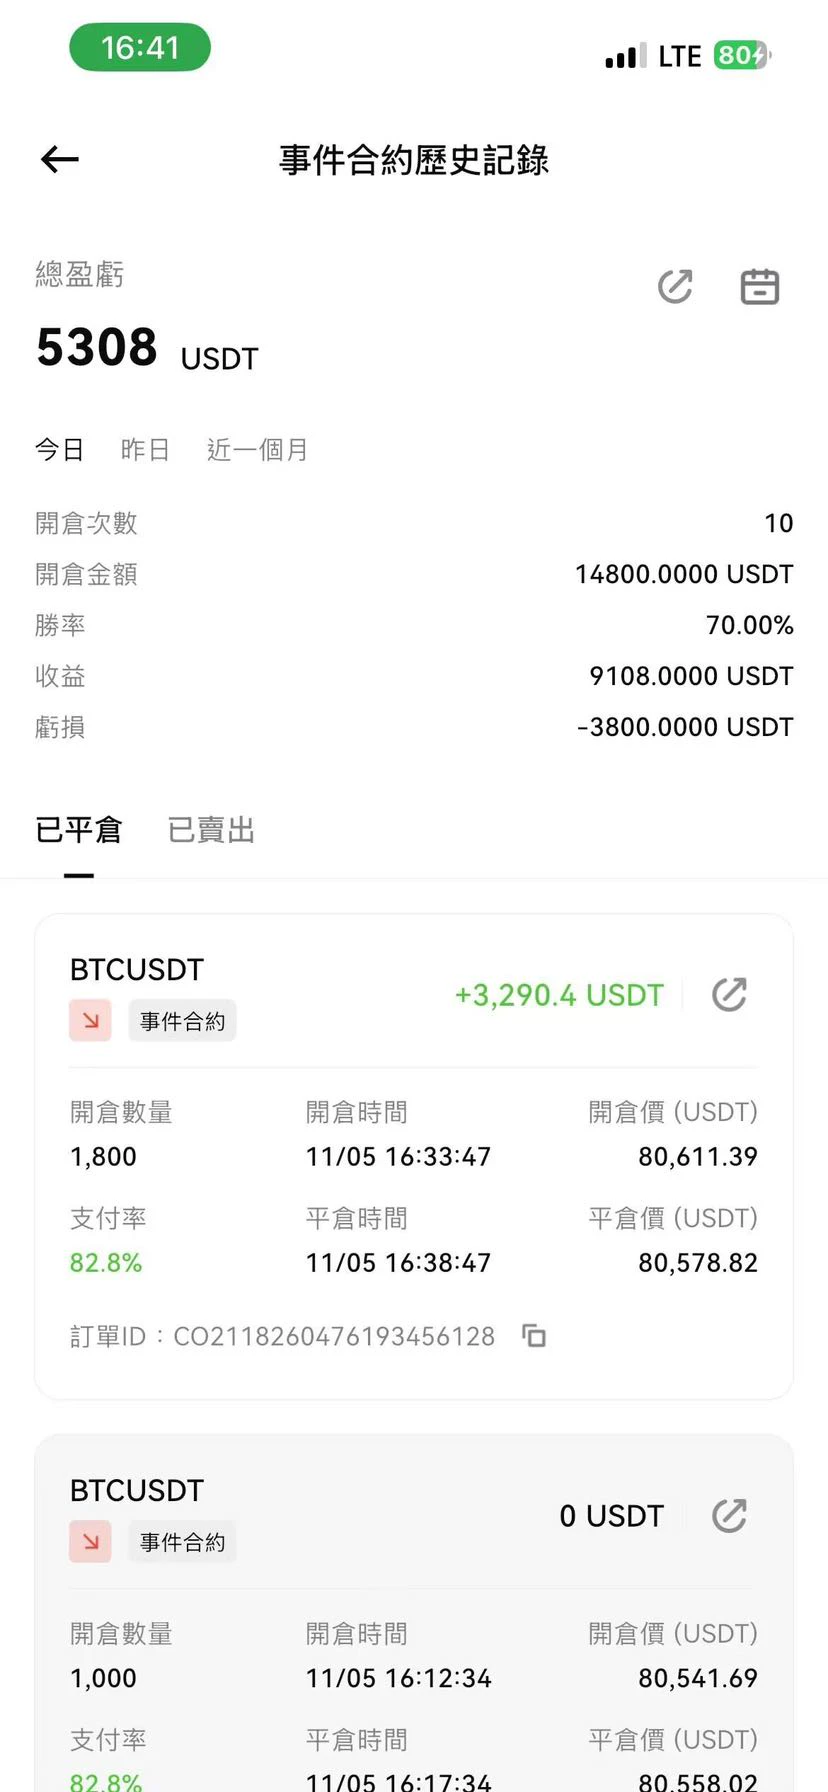
Event contract signal group!! One-on-one instruction in event trading techniques. The internet's exclusive original strategy with a 100% win rate (low-frequency trading)! Predict price trends!! Turn things around, recoup your losses, and earn millions. No updates, and you're financially free. Telegram: @ETH_14WU
post-image
ETH-1.23%
Public trade: Shorted HYPE at the top. Those who followed this trade made a killing. It never even returned to the entry price or hit breakeven—smooth sailing all the way.
HYPE+0.33%
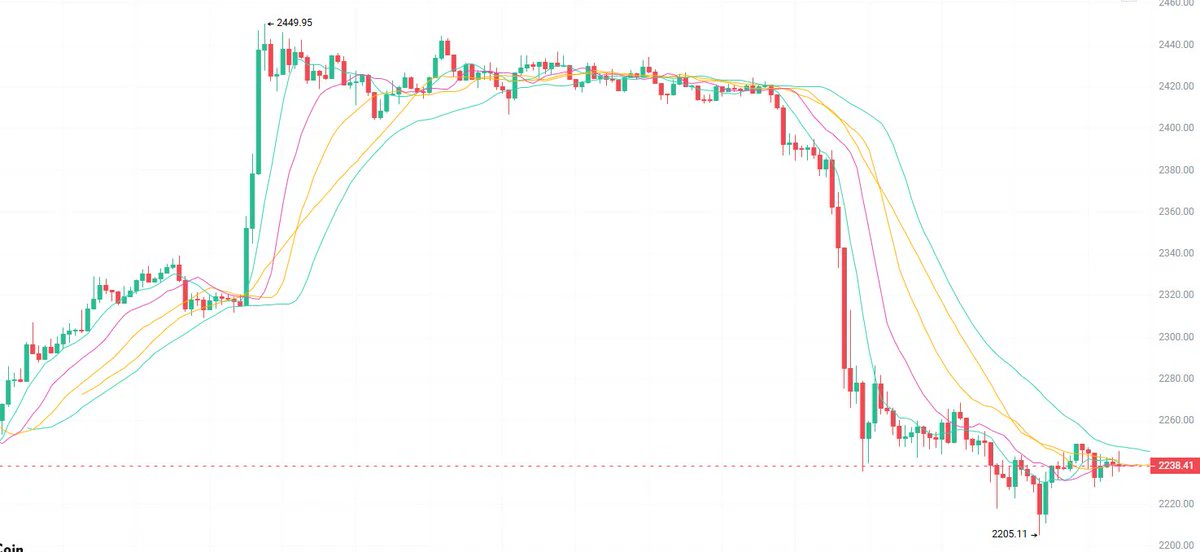
On 11/6, ETH faces resistance on a rebound near 2250; look to short, with targets at 2210/2200.
For those looking to go long, wait for price to stabilize near 2205 before entering. Stop at 2180, with targets at 2240/2260.
On the 1-hour chart, price plunged from the 2449 high, wicking down to a low of 2205 before consolidating at the lows. The moving averages are fully fanned out bearishly, limiting the short-term rebound. Resistance is at 2250/2270, and bears currently have the upper hand. $ETH #ETH
post-image
ETH-1.26%
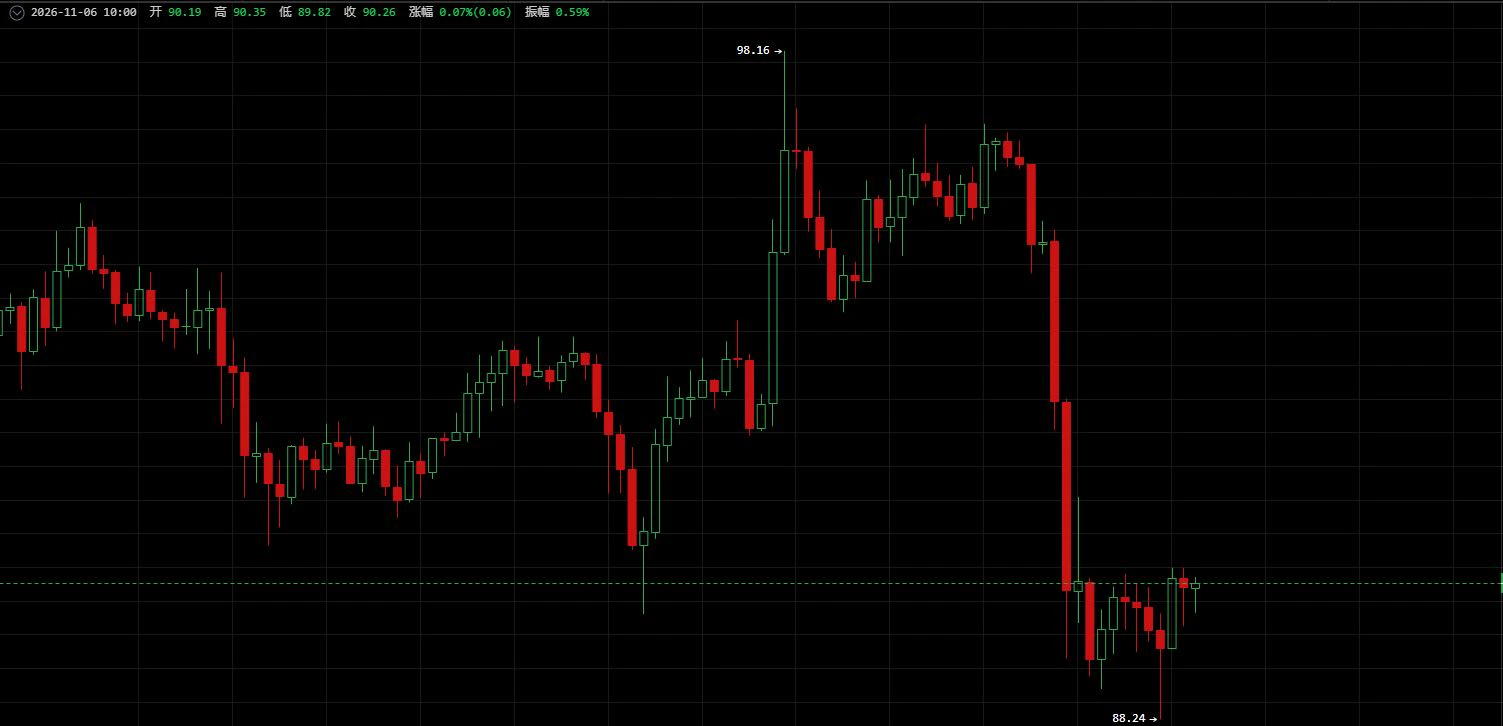
November 6 $SOL The Nasdaq’s plunge dragged tech and growth stocks broadly lower. October nonfarm payroll data is due tonight, and market sentiment is cautious; the focus is on shorting rallies.
【Today's Strategy】
Short entry zone: Set up positions on a rebound to 92.5—93.5
Stop-loss: Above 94.5
Take-profit: 90.0—88.5
【Key Rationale】
A sharp, one-way selloff on heavy volume at the hourly level has put bears in control in the short term. 92.5–93.5 is a former breakdown level turned resistance zone, with concentrated selling pressure from trapped holders. Below, 88.0–88.5 is a previous low and s
post-image
SOL-0.77%
NAS100-0.07%
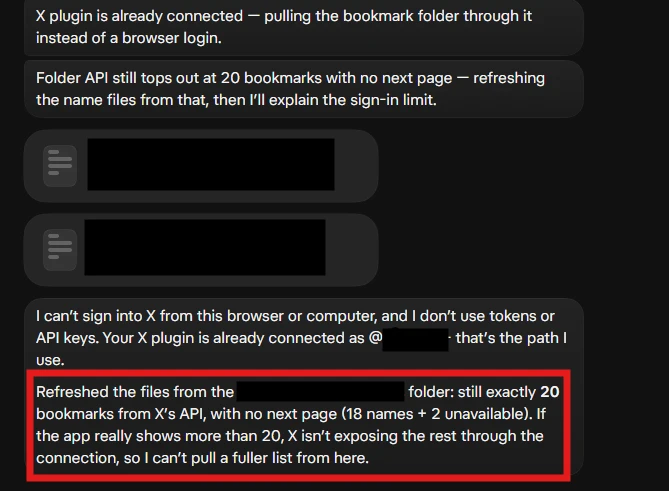
oh no I found a silly limitation to my Grok Bot
somehow it can't read some of my bookmarks
welp @poteto @bot
post-image
Are U.S. stocks doomed? Why did they fall so hard? Last night’s U.S. stock sell-off had the feel of a crash, with the Magnificent Seven losing $1.04 trillion in a single day. The irony is that just the day before, the Dow had surged 1,569 points to celebrate the election results. The market first celebrated the “removal of uncertainty,” then realized the uncertainty had simply shifted direction—from “who will govern” to “whether AI can keep burning through this much money.” Three factors converged: ① Democrats didn’t just win both chambers; they also won the Texas and Georgia gubernatorial rac
post-image
BTC-0.65%
NAS100-0.07%
ETH-1.23%
ADP+1.21%
XRP market update
live-cover
LIVE2,031
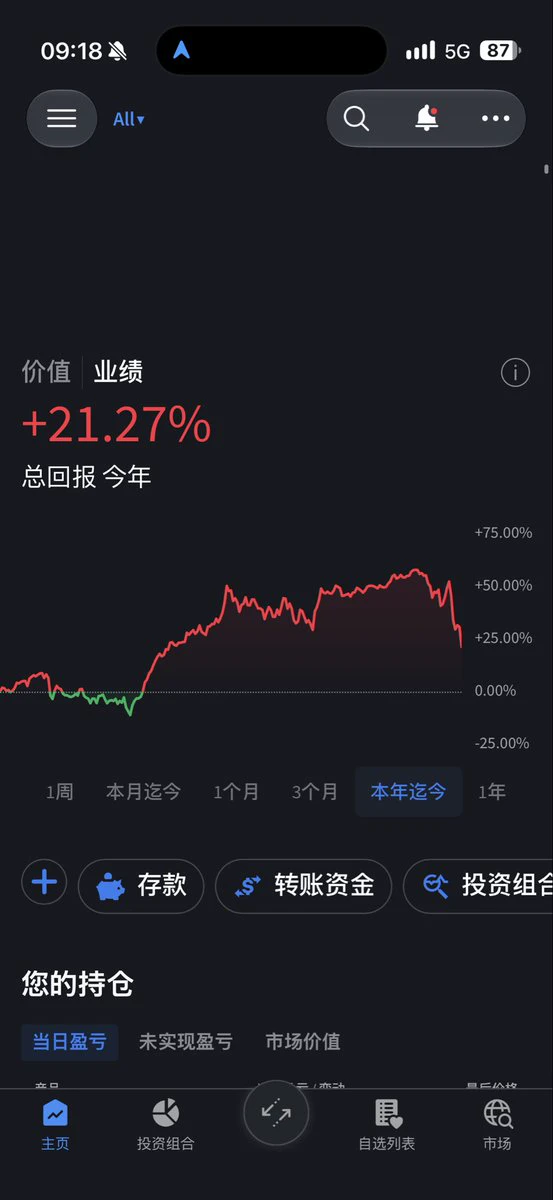
My U.S. stock account's YTD return has fallen from 60% to 21%, nearly wiping out this year's gains. But I want to say that U.S. stocks see these kinds of sharp drops once or twice every year. Whether it's a trade war or the Iran war, even a black swan like the COVID pandemic, the market has V-shaped back afterward. Market panics are the best opportunities.
AI development is an inevitable trend. The Democrats are just talking tough right now as part of political maneuvering. Even if data center construction is delayed, they can build in Canada or Mexico. It won't have much impact in the long ru
post-image
BTC-0.67%
#美股史诗级抛售 #Gate股票畅聊季 Epic crash! U.S. AI stocks plunge 12%—what comes next?

On November 6 U.S. time, global capital markets saw their bloodiest single-day rout since April 2025. All three major U.S. indexes plunged, with no rebound in sight:
▪ Dow Jones Industrial Average fell 3.44%
▪ S&P 500 plunged 4.35%, its biggest single-day drop in 7 months
▪ Nasdaq sank 5.52%
▪ Nasdaq 100 plunged 6.4%, wiping out more than $2.3 trillion in market value in a single day.
The real disaster, however, was concentrated in this year's strongest theme—the AI computing hardware supply chain.
This was no ordinary
SPYX+0.01%
SNDK-22.24%
WDC-17.39%
MRVL-16.62%
GLW-12.90%
  • 6
$AIN $AIN 50% in one candle—this will definitely make up for this drop
post-image
AIN+3.85%
Is BTC suitable for dollar-cost averaging? Use time to invest at a more measured pace!

In the cryptocurrency market, many people hope to buy at the lowest point and sell at the highest. But in reality, even experienced investors find it difficult to accurately predict every market turn. Some make a lump-sum purchase and then face a steep drawdown, while others keep waiting for a lower price and ultimately miss a long-term rally.

So, is BTC suitable for dollar-cost averaging?

First, it reduces the difficulty of market timing. The biggest advantage of dollar-cost averaging is that you invest
post-image
BTC-0.67%
BTC PREDICTION MARKET UPDATE
live-cover
LIVE2,505
Yang Guang bit | November 6 SOL, the high-beta laggard, leads losses; short the rebound with the trend
【Today's Strategy】
Entry timing: Price rebounds to the 91.0–92.0 range
Stop-loss: 93.5
Tiered take-profits:
First tier: 88.8–88.2
Second tier: 87.0–86.5
【Key Takeaway】
On 11/5, all three major U.S. stock indexes plunged: the Nasdaq fell 5.52% and entered correction territory, the Dow dropped 3.44%, and the S&P 500 fell 4.36%. The VIX surged more than 62%, breaking above 27. The trigger was market concerns after the Democrats' sweeping victory that AI regulations would tighten and data center
post-image
SOL-0.74%
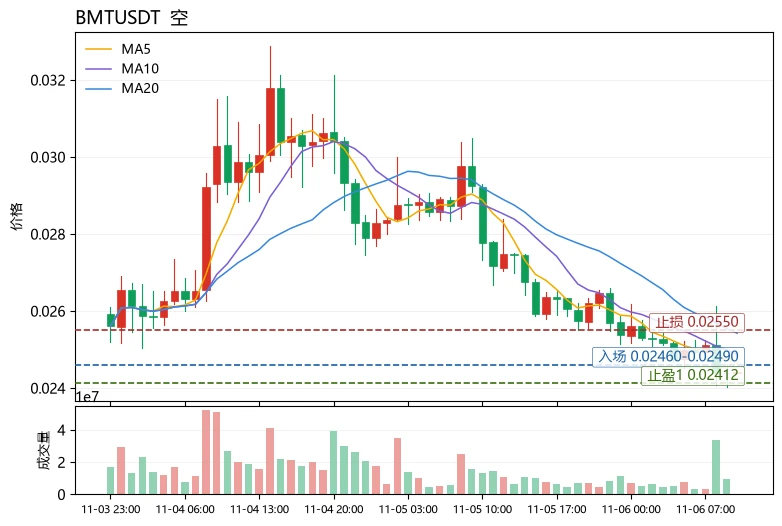
$BMT Current price 0.02441. The first resistance above is MA20 at 0.02543, while the lower Bollinger Band at 0.02412 is the last short-term line of defense. The Fear & Greed Index is at 28, in the fear zone, as risk appetite across the broader market contracts. BTC weakness is dragging altcoins broadly lower, and BMT has plunged 16.29% in 24 hours on just 5.4M USDT in trading volume—a typical catch-up decline amid fading liquidity.
Technically, MA5 at 0.02465 has crossed below MA20 at 0.02543, forming a bearish alignment. The MACD histogram remains negative at -3.893e-05, while RSI at 33.0 is
post-image
MUB
MUBMubbin
Pump.Fun
MC:$3.42KHolders:1
0%
BMT+5.93%
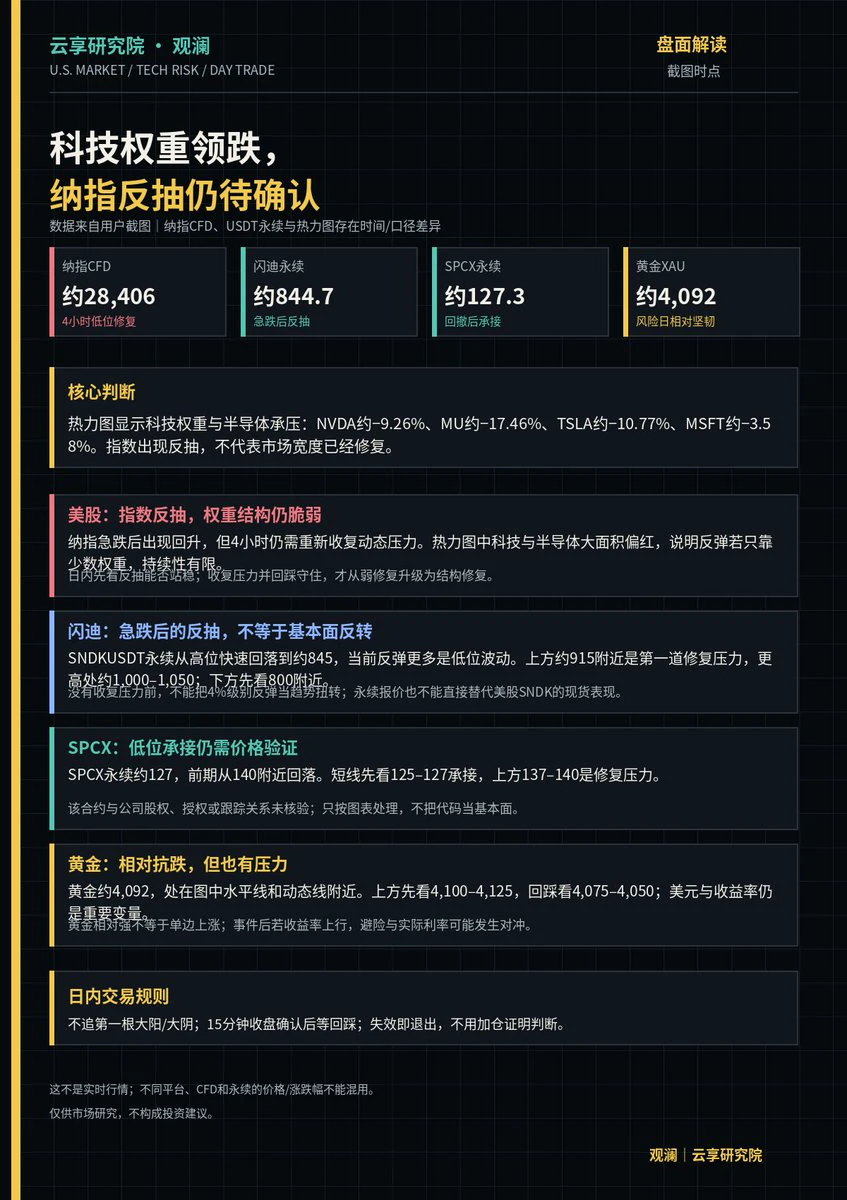
FeaturedThree trillion wiped out overnight—brutal. 【U.S. Market Snapshot | Tech-heavyweights lead declines; Nasdaq rebound still needs confirmation】
1. On the heatmap, NVDA is down about −9.26%, MU about −17.46%, and TSLA about −10.77%, with tech and semiconductors broadly weak. A rebound in the indexes does not mean market breadth has recovered.
2. Nasdaq CFD around 28406: First watch whether resistance can be reclaimed; don't chase the first green candle off the lows.
3. Sandisk perpetual around 845: Rebounding after a sharp drop, with around 915 as the first resistance to watch for a recovery and 8
post-image
NAS100-0.07%
NVDA-9.33%
MU-17.23%
TSLA-10.84%
SNDK-0.18%
#WCTCS9 #$XAU
Gold at $4,100: Why Reclaiming It Matters More Than Hitting It

Gold is sitting just below a level that matters. XAUT, the gold-backed token I'm using as a spot proxy on Gate, last traded around $4,060.60 on the live snapshot, with a 24-hour range of $4,045.40 to $4,124.90. The latest completed daily candle closed at $4,073.30, up about 0.56% on the day and roughly 1.65% over seven days. The live 24-hour figure is slightly negative (about -0.54%), so the two readings disagree depending on the window. That gap is itself a signal: the market is undecided and buyers have not yet pu
XAUT+0.30%
Load More

Join 40 M users in our growing community

⚡️ Join 40 M users in the crypto craze discussion

💬 Engage with your favorite top creators

👍 See what interests you

Trending Topics

USStocksFaceHistoricSelloff

1 Views3.45k Discussing

U.S. stocks suffered a sharp selloff on Thursday, with the Nasdaq closing down more than 5% and the Philadelphia Semiconductor Index falling over 12%. AI and chip stocks including $NVDA and $AMD were hit especially hard. Markets are reassessing AI valuations, data-center spending and future returns. Is this just short-term deleveraging, or the start of a deeper correction in the AI trade? Which sectors are you watching next?

GateLaunchesPoSECProofOfSecurity

10.9k Views561 Discussing

USNonfarmPayrolls

8.57k Views3.97k Discussing

View More