Share your thoughts
placeholder
Article
This was purely the market being in a good mood and casually tossing out some coins, which happened to land right on my head. While everyone else was rushing in, I was instead watching for a fake move. At the time, $LIGHT surged sharply and aggressively, but the volume didn’t match at all—however I looked at it, it seemed like a bull trap. I didn’t follow the rush; instead, I placed a short around 0.2321.

Being out of the market isn’t a sin; opening positions recklessly is the mistake.

Once the sentiment cooled and the price gradually returned to 0.188, +187.16% was secured. It felt reall
post-image
LIGHT+0.75%
LAB+2.03%
ZEC-0.66%
Gate hits 60 million users! Veteran users, don’t scroll away just yet—let’s see who entered earlier than you?
Gate’s global registered users have surpassed 60 million. Since the platform was founded in 2013, it has gone through multiple bull and bear cycles in the crypto market, and its business now spans digital assets, stocks, ETFs, payments, wallets, and Web3.
But anyone who has truly experienced these cycles knows that the numbers in your account are merely the result—the process is the story.
Some watched BTC charge ahead all the way, while others experienced altcoins doubling in a day an
BTC+0.17%
  • 44
#RedBullTradingTourSeason6
Red Bull Trading Tour Season 6 is currently gaining attention among crypto traders as Gate’s latest trading campaign combines cryptocurrency competition with the speed and excitement of Formula 1. The Season 6 competition is scheduled to run from August 31 to September 28, 2026, giving participants several weeks to compete for rewards.
The campaign features a dynamic prize pool that can reach 60,000 GT, depending on overall trading volume. Traders can participate through several products, including futures, spot trading, options, leveraged ETF tokens and Convert. Mu
GT+10.96%
ORCL+3.07%
Gold’s 4h chart is screaming short at 4438—but the daily range says don’t trust it yet.

$XAU /USDT - SHORT

Trade Plan:
Entry: 4436.95 – 4439.87
SL: 4452.40
TP1: 4427.92
TP2: 4420.92
TP3: 4410.43

Why this setup?
- RSI 15m at 52.4 = no momentum fuel, just a lazy drift into resistance.
- ATR 1h at 5.83 means a 10 move is nothing—our TP1 at 4427 is a 0.24% scalp, not a trend.
- Daily range kills the conviction: 55% confidence is a coin flip, so we’re selling the 4h rejection, not the macro.
- Why now? Entry zone 4436.95–4439.87 is a tight 0.07% box—wait for a 15m close below 4438 to tr
XAU+0.09%
Everyone’s watching 54.17 on $LTC /USDT—but the real trap is what happens below 52.79.

$LTC /USDT - SHORT

Trade Plan:
Entry: 54.02 – 54.32
SL: 56.01
TP1: 52.79
TP2: 51.87
TP3: 50.49

Why this setup?
- 1D trend is *range*, yet 4h momentum is screaming SHORT with 77% confidence.
- RSI on 15m sits at 50.5—no bounce fuel left; price is stalling right under resistance.
- ATR (0.59) shows low volatility—perfect setup for a slow bleed to TP1 (52.79) before a quick flush to TP2 (51.87).
- Why now? Entry zone 54.02–54.32 is a magnet for late longs, but invalidation at 51.03 is far—room to ru
LTC+7.69%
【$B Signal】Long | 1H pullback to Bollinger midline + bid support
$B 1H pullback to the Bollinger midline, bid-side depth imbalance at 12.02%, current price 0.1733 holding just above the midline.
🎯Direction: Long
⚡Entry/Limit order: 0.172780 - 0.173300
🛑Stop-loss: 0.171567
🚀Target 1: 0.175900
🚀Target 2: 0.177199
🛡️Trading management:
- Execution strategy: After reaching Target 1, reduce the position by 50% and move the stop-loss up to breakeven. If the price falls back to the entry level, exit automatically to protect the principal.
Depth logic: The 4H MACD is above the zero line; the hist
post-image
BTC+0.17%
ETH+1.23%
SOL+1.68%
Layout for Bitcoin, Ethereum, and Dogecoin
live-cover
LIVE2,582
  • 1
The probability of a Fed rate hike in September fell from 66% to 50% in just a few days. Fed Chair Christopher Waller sent a clear dovish signal, saying that if inflation slows further, he would support keeping rates unchanged in September. Bitcoin broke above $82,000, gold rose above $4,500, and U.S. stocks posted their biggest gain in nearly a month. What does such a sharp drop in expectations mean? How is the logic of crypto market pricing being reshaped?
$BULLA Signal】1H momentum weakening + funding rate too high, quick short-term long
$BULLA 4H momentum bars are shortening, RSI 71.5 is flattening at elevated levels, and 1H buying inertia remains. The 0.1175% funding rate is relatively high, the order book bid-ask ratio is 0.99, and depth imbalance is -0.51%. Volume has plunged from the previous hour, with the price trapped in a narrow consolidation range.
🎯Direction: Long
⚡Entry/Limit order: 0.08422-0.08448
🛑Stop-loss: 0.08363
🚀Target 1: 0.08575
🚀Target 2: 0.08638
🛡️Trade management:
- Execution strategy: After reaching Target 1, reduce
post-image
BULLA+212.88%
BTC+0.17%
ETH+1.23%
SOL+1.68%
Everyone’s watching the 1D trend—but 95% confidence shorts on $LAB /USDT are the quiet exit liquidity.

$LAB /USDT - SHORT

Trade Plan:
Entry: 0.07491 – 0.07539
SL: 0.07742
TP1: 0.07345
TP2: 0.07232
TP3: 0.07062

Why this setup?
Why now? The 4h structure is breaking, and the 1D trend is already bearish—this isn’t a guess.
- RSI 15m at 58.79 shows a weak bounce, not a reversal.
- Entry zone 0.07515–0.07539 aligns with the last defense before TP1 at 0.07345.
- ATR 1h (0.000944) says volatility is compressing—breakouts punish late longs.

Debate:
If the 1D trend is bearish and confidenc
LAB+2.03%
My long position made a round trip, and today I finally saw the protective level do its job. The drop a few days ago came sharply; to be honest, I was somewhat panicked because a lot of the unrealized profit had already been given back. But since I had placed a stop-loss order in advance, I didn’t have to watch the market all night trying to guess the key level. Once the price climbed back above 0.0116, I first took profit on 30% of the position, while moving the protective level higher with the trend for the remaining 70%. This wasn’t about predicting how much further the price could rise; I
post-image
LAB+2.03%
SNDK+1.73%
$meme wow 😮
0x385f4f8ae47651ce5f58f5265395a669f8281e18
post-image
MEME+3.87%
This is the comfort of being short. I’m sticking to the plan: first close 70% and lock in the profit. Set the protection level for the remaining 20% at breakeven; if it keeps falling, let it run, and if it rebounds, don’t give the profits back. Don’t be greedy, and you can hold on.

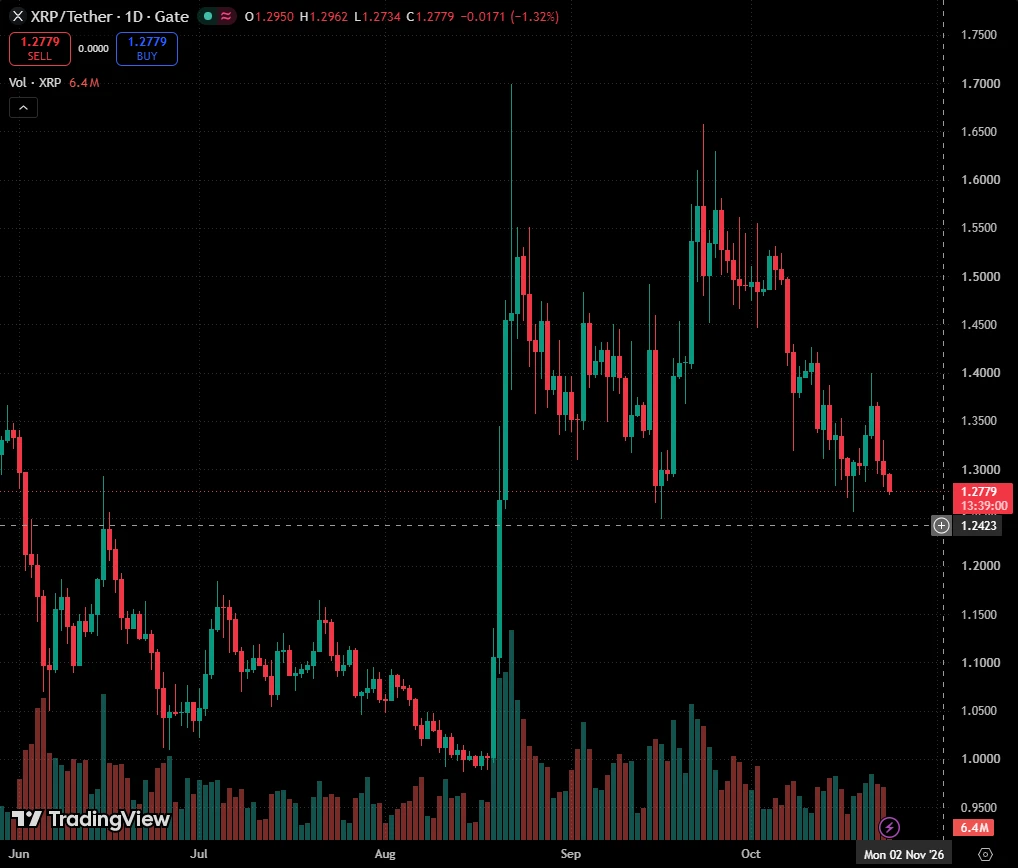
$XRP $LAB
post-image
XRP+1.27%
LAB+2.03%
Rewards are being distributed! Open your mystery box now and win up to 100 USDT worth of tokens! https://www.gate.com/referral/earn-together/invite/UFRFAQ0M?ref=UFRFAQ0M&ref_type=103&utm_cmp=rXJBDjtJ&activity_id=1788357807948
post-image
Everyone’s long XLM, but the 4H clock just ticked against the crowd.

$XLM /USDT - SHORT

Trade Plan:
Entry: 0.18373 – 0.18449
SL: 0.18771
TP1: 0.18141
TP2: 0.17960
TP3: 0.17690

Why this setup?
Why now? The range-bound 1D trend is your tell—no momentum to break higher.
- RSI (15m) at 48.2: neutral, giving sellers room to push without overbought friction.
- ATR (1h) at 0.0015: tight volatility—perfect for a clean slide to TP1 (0.18141) and TP2 (0.17960).
- Entry at 0.18411 is armed; invalidation sits at 0.18203, so the risk is defined and tight.

Debate:
Is XLM faking the dip below 0
XLM+3.05%
Leverage magic unfolds, with $AKE long-position returns exceeding 11x.
The logic stems from an oversold rebound in early September; accumulation at 0.013 was followed by trend continuation as risk appetite recovered.
Technically, the price broke above its previous high, while the RSI is overbought. The 0.0189 support level is crucial in the short term, so chasing the rally is advised against. $ETH
AKE+42.64%
ETH+1.23%
Nobody’s watching LTC’s 4h chart—but the range is about to snap like a dry twig.

$LTC /USDT - SHORT

Trade Plan:
Entry: 53.73 – 54.03
SL: 55.28
TP1: 52.83
TP2: 52.13
TP3: 51.09

Why this setup?
Why now?
- Price is glued to 53.88, but 1D trend = **range**, not momentum. Ranges don’t last forever.
- RSI 15m at 42.08—already rolling over *before* a retest of range lows. That’s early weakness.
- ATR 1h = 0.58—volatility is compressed. When it expands, the move is violent.
- Short plan: entry 53.88, TP1 52.83, TP2 52.13. That’s a 1.7R to first target with SL 55.28.
- If 53.73 breaks,
LTC+7.69%
Everyone’s watching $BTC /USDT’s range—but the 4h clock just started ticking against the bulls.

$BTC /USDT - SHORT

Trade Plan:
Entry: 79603.5 – 79727.1
SL: 80259.1
TP1: 79220.0
TP2: 78923.1
TP3: 78477.8

Why this setup?
Why now?
- Price is pinned at 79,665 with RSI (15m) at 39.7—weak momentum, not oversold yet.
- ATR (1h) at 247 shows low volatility, but that’s a coil before a snap.
- Range-bound 1D trend means breakouts fake out—but our SHORT targets TP1 at 79,220 and TP2 at 78,923 are only 0.5% away.
- The invalidation at 79,079 is close—so if we lose this, the thesis flips fast
BTC+0.17%
Everyone’s staring at NEAR’s 2.17 level—but the 95% confidence score says they’re looking at the wrong chart.

$NEAR /USDT - LONG

Trade Plan:
Entry: 2.1593 – 2.1835
SL: 2.0551
TP1: 2.2586
TP2: 2.3168
TP3: 2.4041

Why this setup?
- 1D trend is bullish, and 4h momentum is aligning for a breakout, not a breakdown.
- RSI on 15m is cooling at 40.42—this is the reset before the push, not exhaustion.
- Entry zone 2.1593–2.1835 is tight; TP1 at 2.2586 is only a 4% move away, but TP3 at 2.4041 is the real prize.
- Why now? The pullback is shallow (ATR 0.048), meaning sellers are weak—buyers a
NEAR+1.93%
BTC MARKET UPDATES
live-cover
LIVE82
Load More

Join 40 M users in our growing community

⚡️ Join 40 M users in the crypto craze discussion

💬 Engage with your favorite top creators

👍 See what interests you

View More