
Square
Following
Hot
News
Notifications
Profile
Share your thoughts
placeholder
Article
$MMT — LONGEntry: 0.2142TP1: 0.2164TP2: 0.2185Stop: 0.2056The chart is hinting at an early shift higher as demand slowly returns. The market still needs follow-through to turn an early bounce into a real move.
post-image
MMT-2.35%
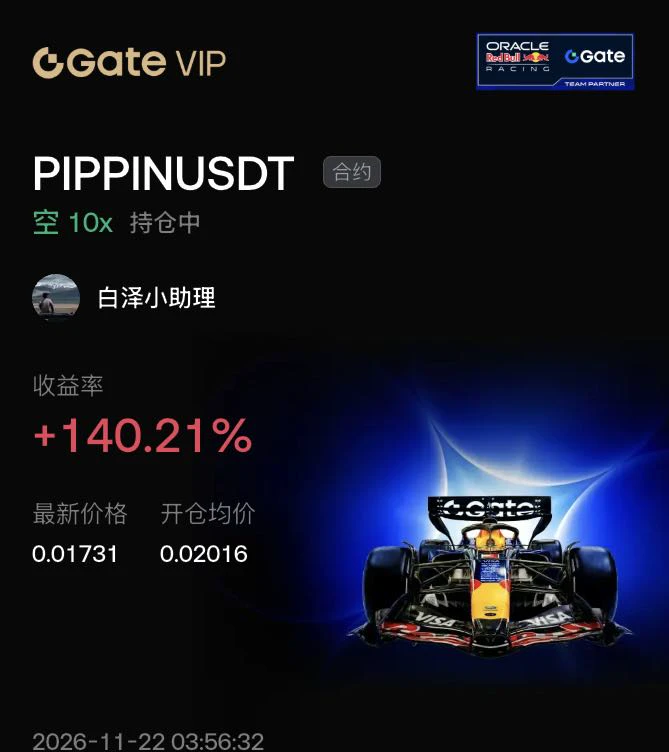
$PIPPIN 's moving averages are clearly defined: the 100-day MA is at 0.01872, and the 200-day MA is at 0.03959. The close on the 21st was around 0.017, failing to get above even the 100-day MA.

The resistance levels above are 0.0187 at the 100-day MA, around 0.0202 near the previous high, then 0.0234 further up, with 0.0543 much farther away. Below, 0.0148 is where the move kicked off on the 18th, and below that is the all-time low of 0.011.

One analysis put it plainly: to break above 0.0202, spot buying needs to come in first; derivatives alone won't get it there.

The project itself can't
post-image
PIPPIN-2.21%
ETH-1.23%
  • 1
Trenches
IDOL
I
bade
b
IDOL
0x3b...ab07
Market Cap
$.
Change
.
24h Vol
$.
Holders
.
FIONA
F
bade
b
FIONA
B34n...pump
Market Cap
$.
Change
.
24h Vol
$.
Holders
.
PIEVERSE
P
bade
b
PIEVERSE
0x0e...25a9
Market Cap
$
Change
.
24h Vol
$.
Holders
.
Singularity
S
bade
b
Singularity
7R4M...pump
Market Cap
$.
Change
.
24h Vol
$.
Holders
.
CLAUDIA
C
bade
b
CLAUDIA
2j5S...W2ZM
Market Cap
$.
Change
.
24h Vol
$.
Holders
.
I use these indicators
- RSI.
- 12/26 or 25 EMA
- OBV
post-image
$DOS This 16% bearish candle sent the rebound from 0.1837 straight back to 0.1423. The chart looks like a freshly paved road cracked under the weight of a heavy truck.
Compared with that asset that slowly drifted down last week, let’s compare them point by point. Decline: one was a sharp single-day plunge, with sentiment released all at once; the other leaked lower a little each day, like a slow, dull blade. Volume: $DOS today’s 16.4M was a high-volume decline, showing that some people really sold at this level while others bought; volume in the drifting-down asset contracted, with no one step
DOS+14.98%
  • 1
  • 2
Goizzzzzz $IDOL All take-profit targets have been successfully hit, securing a huge victory 🥳🥳🥳🥳🥳🥳🥳 Making history! Every target has been successfully hit. • TP1: 0.028 ✅• TP2: 0.030 ✅• TP3: 0.032 ✅• TP4: 0.034 ✅Congratulations to everyone who caught this move! 🥂 From the initial entry to TP4, the entire move unfolded perfectly according to plan. You believed in the plan, and it paid off. Missed the whole move? Don’t worry. The next move is here: Final push: 0.045 🧲• Entry: 0.0330 – 0.0345 (current range / slight pullback)• Target: 0.045• Stop-loss: 0.0290 (protect profits)Execution
post-image
IDOL-6.71%
#ThreeLaunchpoolProjectsNowLive
Gate Launchpool Is Running Again: Three Fresh Earning Opportunities, and How I Would Approach Them

Launchpool is one of the most practical ways I know to earn new token exposure without buying at the launch price, and right now Gate has several events open at the same time. The one I want to break down in detail is the KOR Protocol event, Launchpool #385, which began on November 4, 2026 and runs for a full month until December 4, 2026. Gate's bi-weekly report for November 1 to 15 also confirms that Gate launched two Launchpool projects in that window, so the o
GT-2.41%
BTC-0.67%
ETH-1.26%
[NEW streamer BTC]
live-cover
LIVE52
BTC-0.67%
ETH-1.26%
SOL-0.77%
GN if you GN💤
post-image
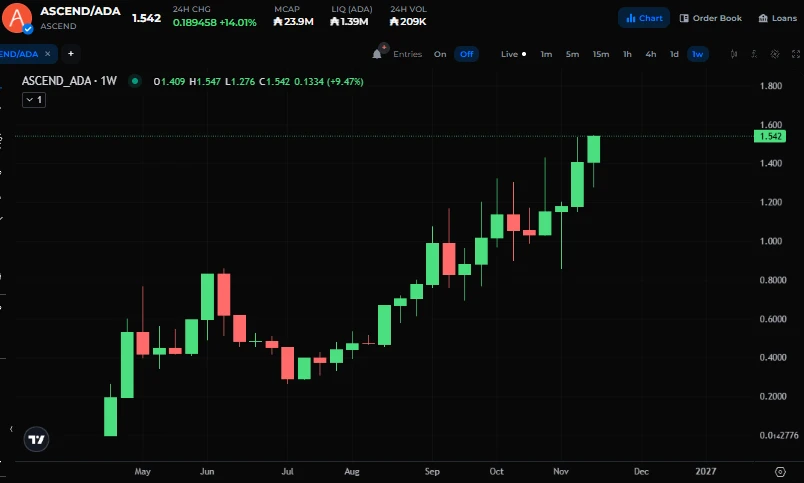
Midnight's perpetuals platform $ASCEND hits a new ATH🚀
post-image
NIGHT-3.07%
Go long at 4-hour support $QNT . Hold 141, next target 150. If it breaks below 136, I’ll abandon this idea. Rationale: - On the 4-hour timeframe, price is at 142; buyers need to defend this level to push the price higher. - The daily chart is above EMA200 (124), strengthening confidence in this trade setup. Long 141.3–142.0 Take profit 144.8 / 147.0 / 150.2 Stop loss 136.3 This is not investment advice; manage your position size yourself.
post-image
QNT+4.79%
$XMR thinks the view from the intraday high is already pretty nice. Looks like after that surge, it wants to pause and catch its breath for a while. TP: 472.63SL: 512.97Quick market check: $YB : Current price 0.05518 - 24-hour change: +16.76%$ZEC : Current price 793.17 - 24-hour change: +6.44%
post-image
XMR+0.00%
YB+2.91%
ZEC+1.16%
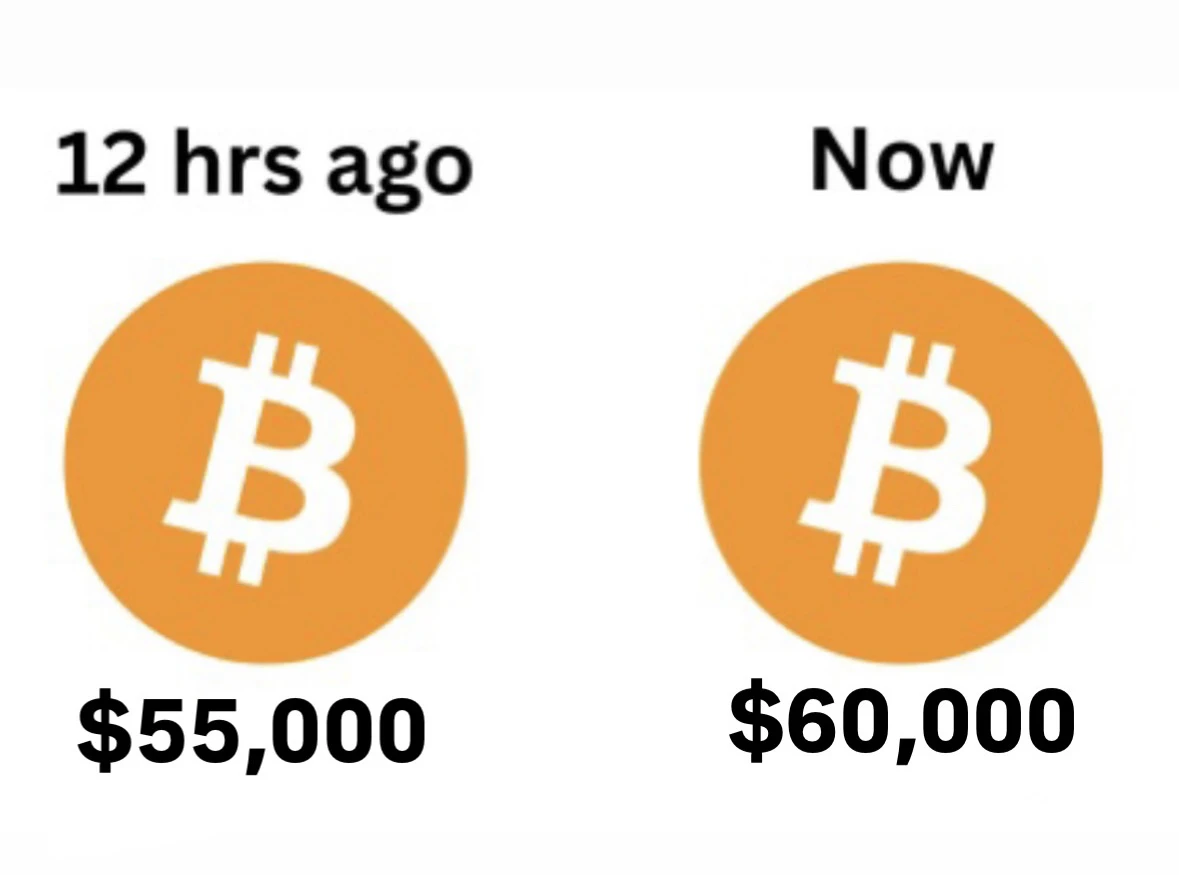
From $55,000 to $60,000
Was that the bottom?
post-image
$ICP One market detail is worth watching: the price hasn’t recovered, but contract positions have already climbed back.
At 9 p.m. on the 20th, Internet Computer was still at 2.061, with about 261.8 million contracts. When it plunged to a low of 1.865 at 2 p.m. on the 21st, contracts first fell to about 253.9 million. By 2 a.m. on the 22nd, it had closed at 1.919. The price hadn’t recovered at all, yet contracts had piled back up to about 263.1 million—well above the low and even slightly above the level from the evening of the 20th.
Contracts falling and then rising around the low only shows
post-image
ICP-1.14%
MARKET UPDATE
live-cover
LIVE23
BTC-0.67%
For a coin that’s up 34%, most people’s first reaction is, “Don’t chase it.” That consensus isn’t wrong—$SKYAI climbed from 0.0264 to 0.0398 in a day, with 24-hour trading volume of 54.8M. Going by past experience, this kind of steep move is usually an emotional spike, and a pullback after the surge is the norm. I’ve been trading spot for nine years and have seen plenty of charts like this: a sharp rally, two days of sideways trading, then a slow drift back down.
But there’s one detail worth a closer look this time. The gain is large, and so is the trading volume: 54.8M is no small amount, wh
SKYAI-7.58%
Laying out the November candlesticks, the entry price for this move, $CYBER , was exactly the high on November 12.

Here’s how that stretch played out: On November 5, the exchange resumed withdrawals, and it rose 51% in a single day. On the 6th, it surged again, reaching around 0.40 intraday, then headed steadily downward. It fell 18.4% on the 7th, 9% on the 8th, and 11.6% on the 11th. On the 12th, it surged to 0.2637 but couldn’t hold. From the 13th to the 19th, it closed lower every day, grinding down from 0.24 to 0.20.

On the 20th, it hit an intraday low of 0.2001, a new all-time low. On t
post-image
CYBER-5.14%
BTC-0.65%
AKE+6.39%
  • 1
When the market is good, everyone is a genius.

Only when the market turns bad do you realize how important having a clear strategy and acting on it is.

The market has been extremely volatile over the past two days, and I reckon plenty of people have been left holding the bag again.

Tell me your price levels. Some problems are better dealt with early than left until the very end, when you're scrambling for a solution. If you're not thinking about solving them, do you want to short housing prices in your neighborhood or elbow the concrete floor?
$BTC $ETH $ZEC
#BTC跌破6万美元关口
#Gate直通IPO第三期ANT配
BTC-0.65%
ETH-1.23%
ZEC+1.29%
Best way to sleep fr
Goodnight
post-image
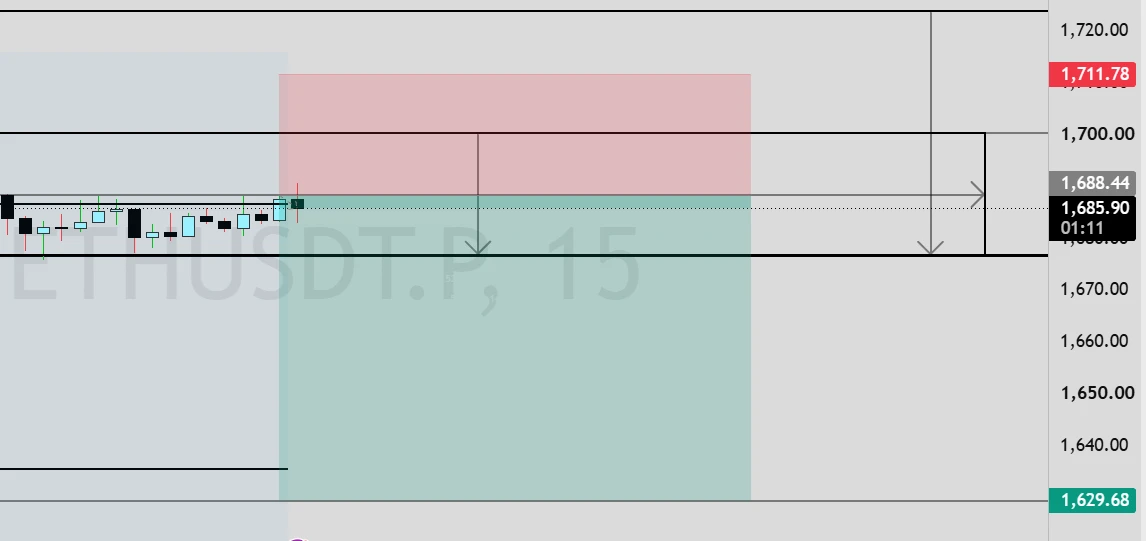
Fading the pump on $ETH 🩸 15m

Bears are stepping in right at the top. Target locked down at 1629.

Entry: 1,688.44 | SL: 1,711.78 | TP: 1,629.68

Who else is in on this short?
‍#eth
post-image
ETH-1.23%
Good evening fam! 😎
On that bring again.
Half way done.
post-image
Load More

Join 40 M users in our growing community

⚡️ Join 40 M users in the crypto craze discussion

💬 Engage with your favorite top creators

👍 See what interests you

Trending Topics

BTCBreaksBelow60K

2.1M Views30K Discussing

BTC fell below $60,000 on November 20 for the first time since July, alongside a tech stock selloff and broader pressure on risk assets. Will $60K become resistance, or can BTC quickly reclaim it? What price or volume signals would convince you that selling pressure is easing?

GateDirectIPOPhase3ANTAllocates92100Shares

789K Views4.9K Discussing

NvidiaDropsNearly14Percent

330.4K Views7.6K Discussing

View More