Square
Following
Hot
News
Profile
Share your thoughts
placeholder
Article
Waiting..waiting..waiting
Playin the game
🥷📈
post-image
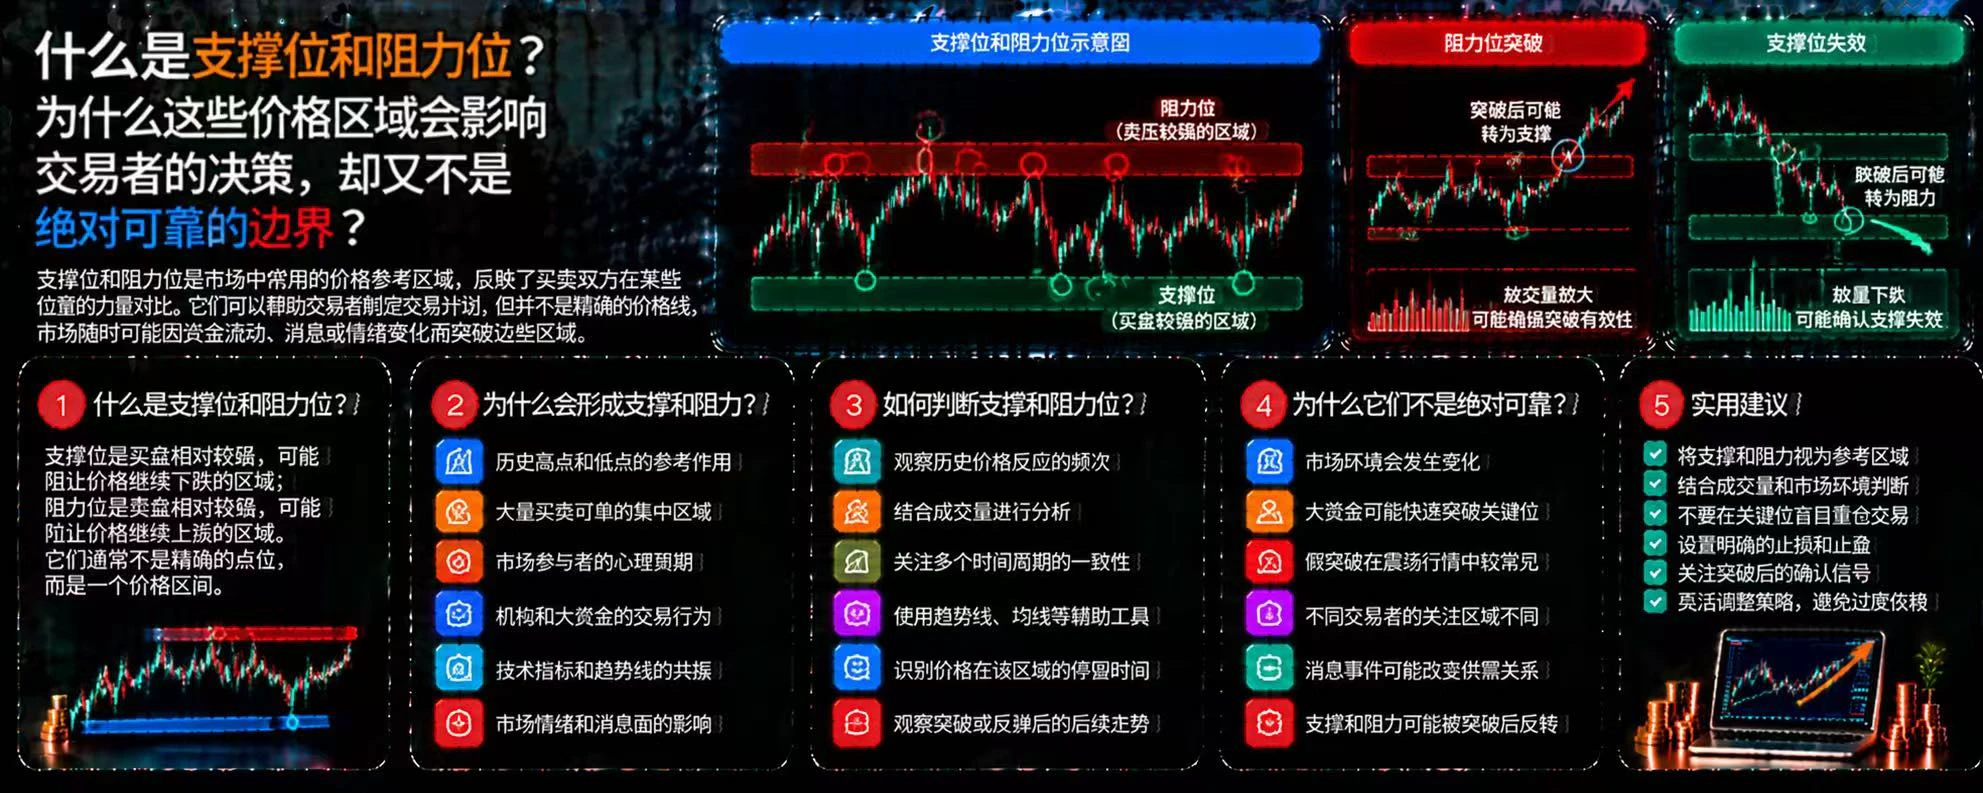
What are support and resistance levels? Why do these price zones influence traders’ decisions, yet are not absolutely reliable boundaries?
In crypto trading, prices often bounce or pull back repeatedly in certain areas. Traders usually call these areas support and resistance levels. They can help analyze market structure, but they do not guarantee that prices will bounce or reverse.
First, what are support and resistance levels?
A support level is an area where buying pressure may increase and a price decline may temporarily slow; a resistance level is an area where selling pressure may increa
post-image
Trenches
ZIG
Z
bade
b
ZIG
0x8c...1145
Market Cap
$.
Change
.
24h Vol
$.
Holders
.
BTC
B
bade
b
BTC
C5xp...pump
Market Cap
$.
Change
.
24h Vol
$.
Holders
.
HIGH
H
bade
b
HIGH
7ymF...high
Market Cap
$.
Change
.
24h Vol
$.
Holders
.
STONK
S
bade
b
STONK
6GmA...UNgx
Market Cap
$.
Change
.
24h Vol
$.
Holders
.
CORLA
C
bade
b
CORLA
0xba...7777
Market Cap
$.
Change
.
24h Vol
$.
Holders
.
No transfer fees — get a +20% boost on incoming transfers. https://www.gate.com/campaigns/6677?ref=VLARBF1YAG&ref_type=132
post-image
$ETH
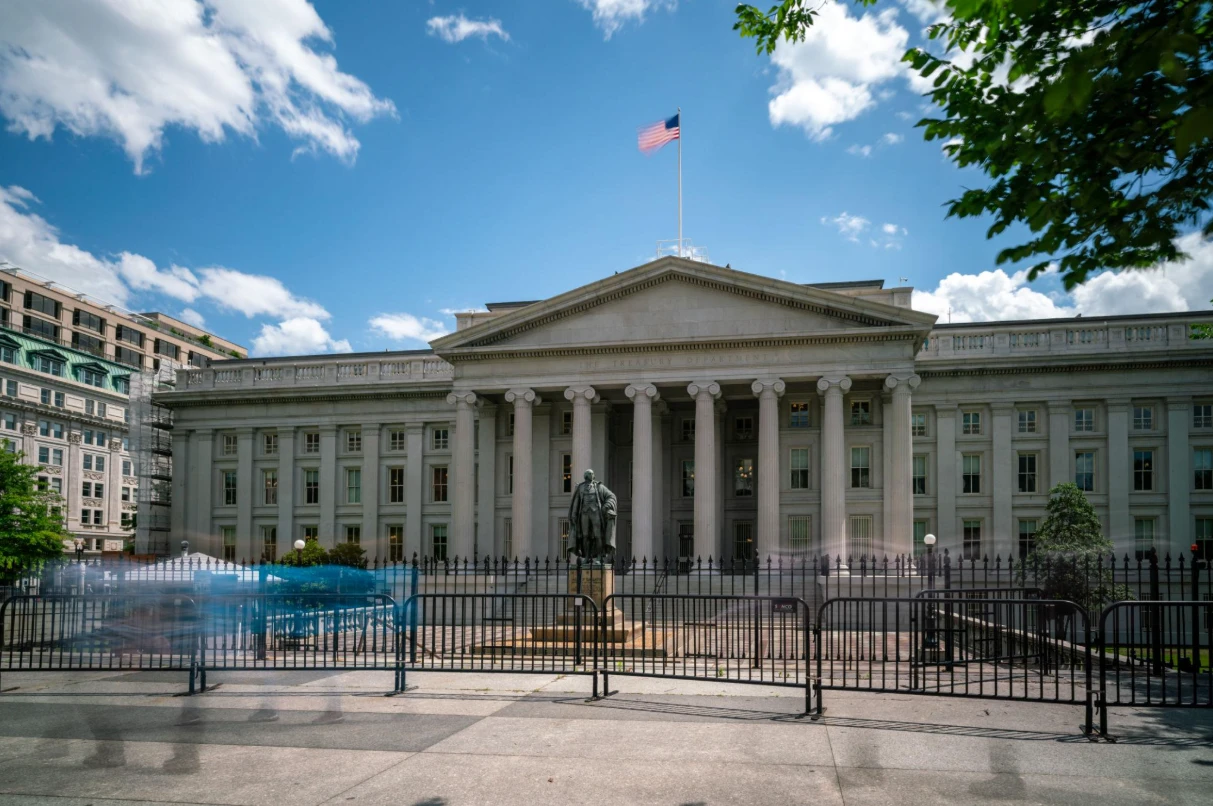
U.S. Treasury yields fall to 4.845%
Is the flow of U.S. capital changing?
Holy shit, is this hugely bullish?
Can BTC benefit from the liquidity tailwind this time?
Holy shit
Guys
Another signal worth watching has emerged in U.S. financial markets
The U.S. 10-year Treasury yield has fallen to around 4.845%
Markets are starting to reassess their expectations for the U.S. economy, inflation, and Fed policy
First, let's explain
Why is the 10-year Treasury yield so important?
It can be thought of as a pricing yardstick for global financial markets
U.S. Treasuries are considered an important b
post-image
ETH-1.23%
Everyone thought this was just an ordinary cold snap, but only I was secretly buying supplies to build a safe house!
What Is the Sharpe Ratio? How Can You Measure Whether the Returns from a Trading Strategy Are Worth the Risk?
In cryptocurrency trading, a high return does not necessarily mean a strategy is good. If a strategy earns high returns but comes with sharp fluctuations and significant drawdowns, we need to ask: Are those returns worth the corresponding risk? The Sharpe ratio is one tool that can help answer this question.
First, what is the Sharpe ratio?
The Sharpe ratio measures the excess return earned by a portfolio or trading strategy per unit of volatility risk. Generally, the higher the value,
post-image
What Is Out-of-Sample Testing? Why Can Data Not Used to Optimize a Strategy Better Test Its True Capabilities?
In cryptocurrency trading, a strategy may perform well in historical backtests yet quickly fail in new market conditions. The problem may not necessarily lie in the trading logic itself; the strategy may also be overfitted to the historical data used for optimization. Out-of-sample testing is an important way to identify this issue.
First, what is out-of-sample testing?
Out-of-sample testing means using data that was not involved in strategy development or parameter optimization to in
post-image
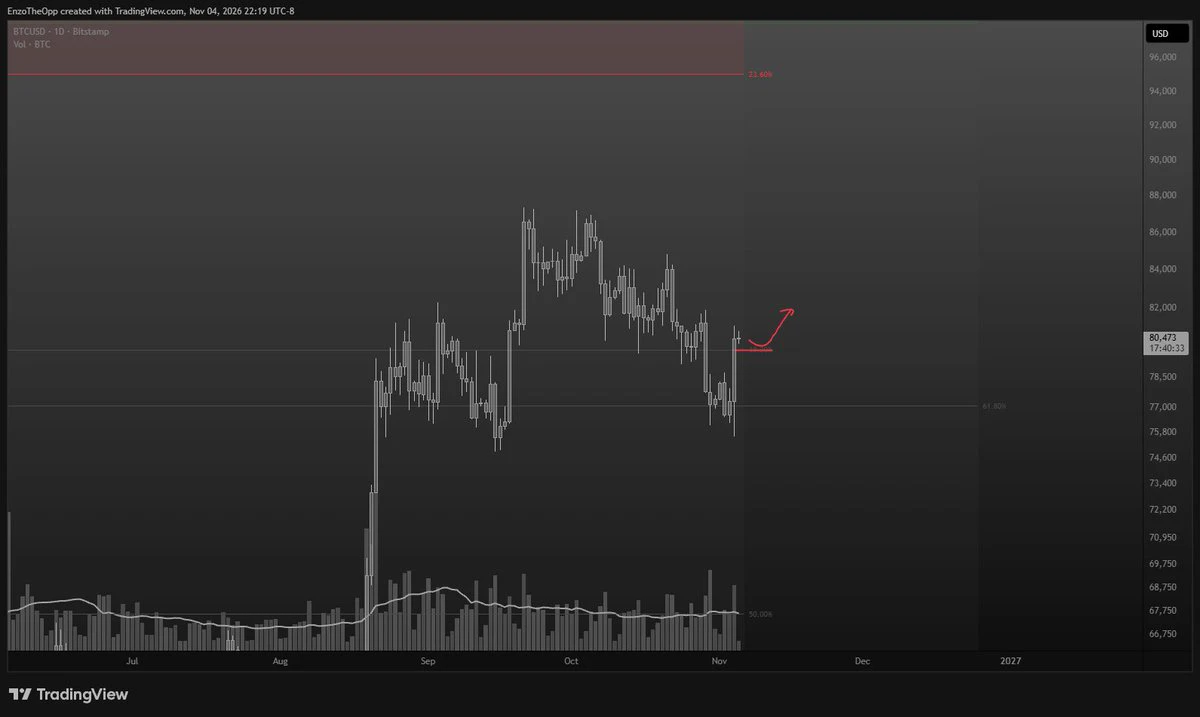
What Happens If BTC Breaks Above $82,000?
live-cover
LIVE2,870
How's that? Those who missed the move can kick themselves
November 5, 2026
I. Positions / Intraday Plan
The hammer has landed, the other shoe has dropped—we've enjoyed the gains and captured the whole move
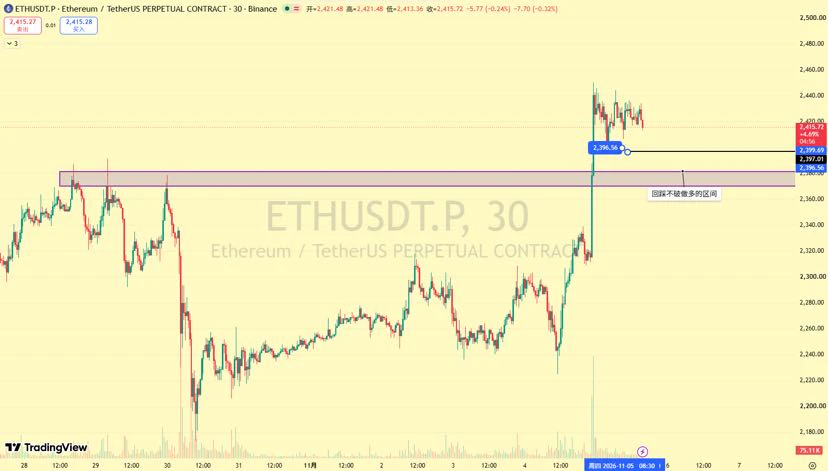
$ETH Today’s intraday plan: Continue to favor buying dips, with shorting rallies as a secondary strategy
1. The major target of 2434-50 mentioned last night was touched, and price paused for sideways consolidation
Long|2396 and the 2379-70 range; go long after a bullish candle appears
Short|Consider shorting at 2493 if an hourly bearish engulfing pattern forms
Buy dips, buy dips, buy dips—i
post-image
ETH-1.26%
Yesterday’s 11.5 ETH Long/Short Strategy Review (posted late)
[translate-ref-0]: $ETH
Yesterday morning, the price failed to break below the previous low and the 2200 support, so I chose to enter a long at the current price. The morning long entry was at 2240, with a take-profit target at 2440 for 200 points of upside.
The short setup was invalidated; the direction was wrong.
[Strategy Review]:
The long entry in the 2180–2200 range did not materialize; the fourth target at 2300 was reached.
The short strategy was invalidated by a strong one-way rally.
[Current Market]:
Last night, the price b
ETH-1.23%
BTC-0.65%
ZEC+1.29%
Every short marks a top. I went long on gold at 3910; it broke above 3990 and moved higher exactly as expected. The market remains in the same structure. I went long on Bitcoin from 76K-plus to 80K, then shorted from 87K to 76K. Excluding swing trades, I captured nearly 20,000 points. Then, let’s meet at a new low.#BTC重返8万 $BTC $XAUUSD $CL
BTC-0.65%
XAUUSD+1.71%
CL-1.83%
Use a small investment to pursue big gains, and join my livestream at 21:00 tonight
post-image
  • 3
Does BTC Still Have a Chance Tonight? How Can Beginners Catch This Move in Futures Trading!
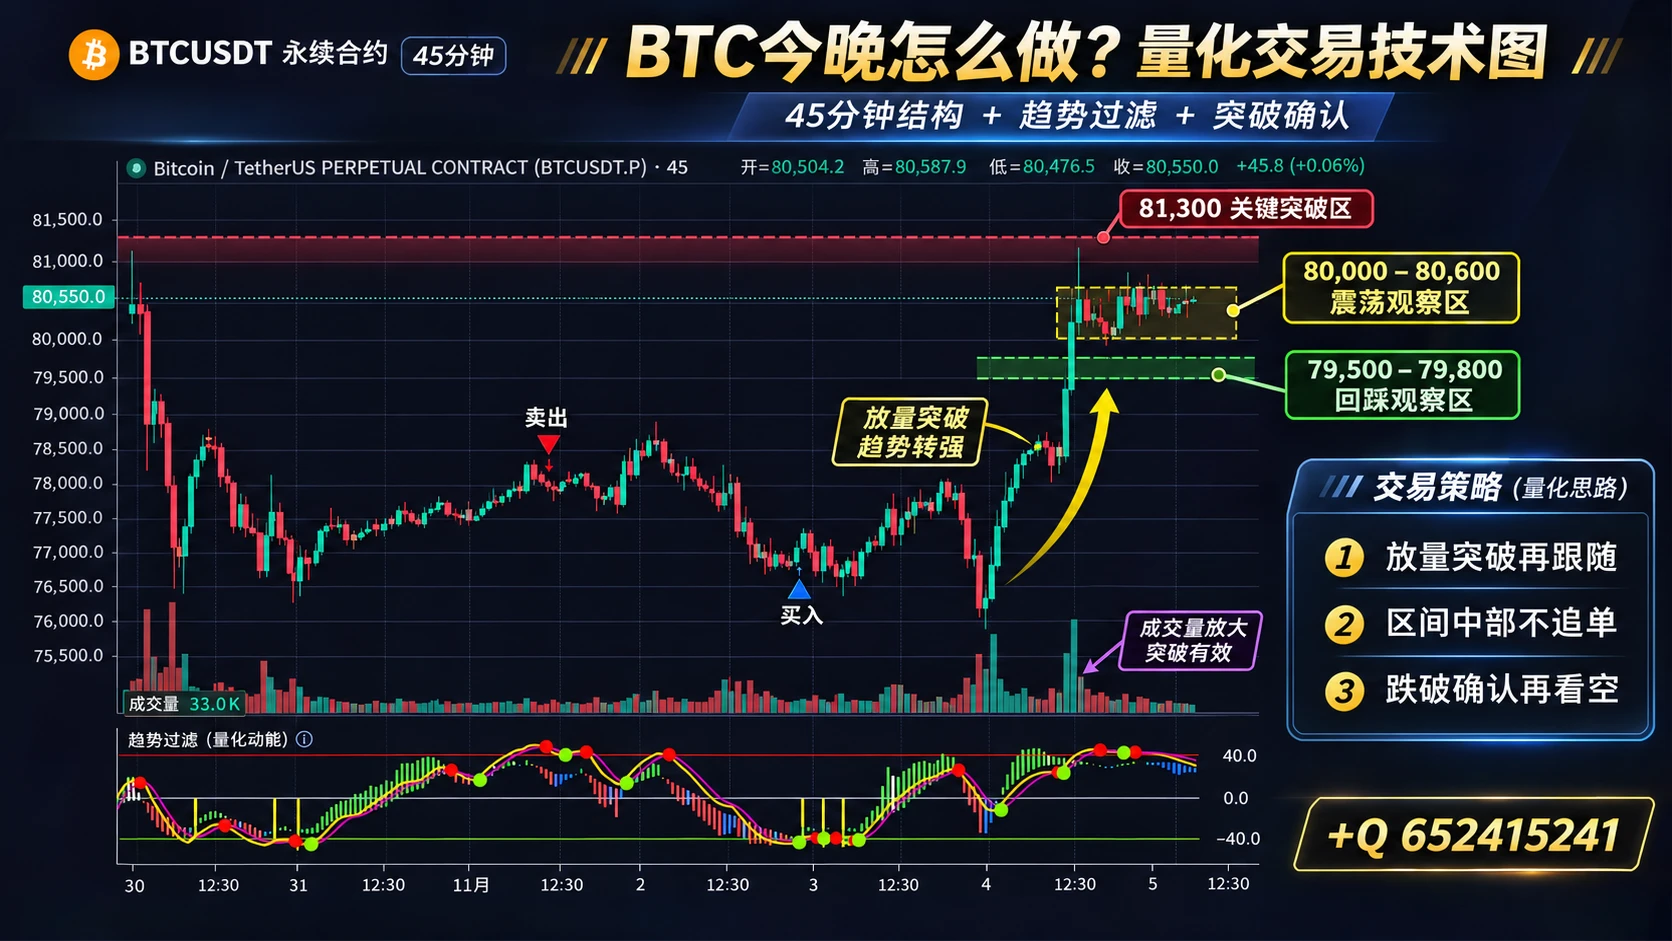
BTC quickly rallied from around 78,300 to above 81,000, and has now returned to around 80,500 to trade sideways. Can we still trade tonight? Let me start with one point: the most dangerous thing right now isn’t getting the direction wrong, but seeing the move start and then rushing to enter.
I’ll break down tonight’s market using a multi-timeframe quantitative approach:
1. Trend filter: Use EMA20 and EMA50 to determine direction, the 4-hour chart to assess the trend, and the 45-minute chart to find trad
post-image
BTC-0.65%
#BTCBackAbove $80K: Can This Bullish Rebound Hold? 🚀
​Bitcoin has staged an aggressive comeback, breaking decisively back above key psychological resistance as macro liquidity shifts back into risk assets. Following the latest ADP National Employment Report and a cooling in yields, institutional dip-buyers stepped in to absorb recent sell-side pressure.
​Simultaneously, Gold ($XAUUSD ) is reclaiming the critical $4,000 zone. When digital gold ($BTC ) and physical gold rally in tandem, it signals strong market-wide demand for hard monetary hedges against broader economic uncertainty and curren
post-image
BTC-0.67%
XAUUSD+1.71%
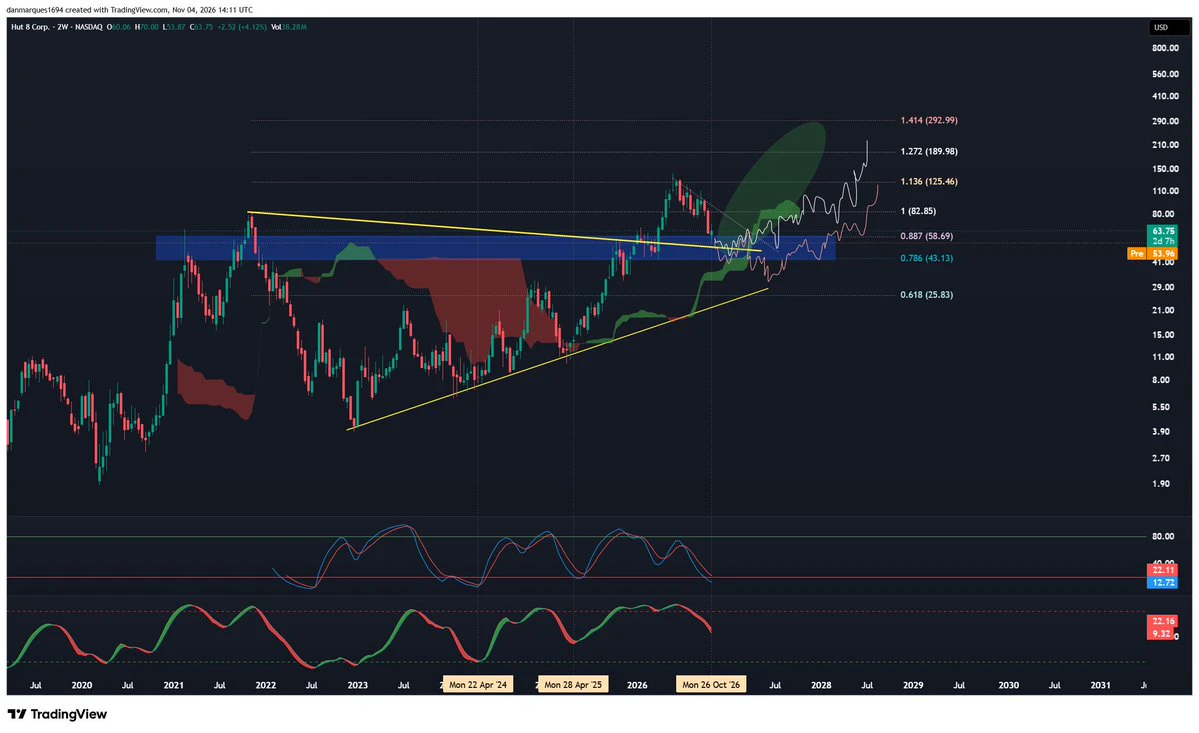
$HUT with a pretty nasty pre-market down -15% as a result of exposure to Texas. Though Beacon Point is fully leased for 704 MW of critical IT they've got a pretty substantial pipeline in the state that could come under scrutiny
Technically, a backtest to the 0.887 / 0.786 fib is very healthy after a massive move. A bottom should form within the current price zone but if the market has other plans and lets say the indexes drop a bit further, then I'd expect a drop near the trendline
If we zoom out it doesn't change the path very much anyway though. We'll be back to triple digits before end of d
post-image
HUT-23.00%
【11.4 BTC Strategy Review】
Yesterday's early-session outlook called for a pullback and adjustment, with a clear plan to go long near 76500 after support held, targeting 77500, 78200, and 79000 in sequence.
The intraday low reached around 75690, briefly dipping below the defense level before quickly recovering. After support was confirmed, a one-way rally began, reaching a high of 81188. All three preset targets were surpassed, fully capturing a rebound of nearly 5500 points.
From identifying support at the lower Bollinger Band to anticipating a breakout above the previous high resistance, the
BTC-0.65%
What Is a False Breakout? How Can You Distinguish a Brief Price Break from a Valid Breakout That Could Signal a New Trend?
In cryptocurrency trading, many people immediately chase prices when they break through key resistance, and rush to short when they fall below support. But sometimes prices only briefly cross a key level before quickly returning to their previous range. This phenomenon is called a false breakout and is one of the risks traders often overlook.
First, what is a false breakout?
A false breakout occurs when the price briefly breaks through support or resistance but fails to co
post-image
CRYPTO BEST TRADING
live-cover
LIVE1,929
What Is Out-of-Sample Testing? Why Can Data Not Used to Optimize a Strategy Better Reveal Its True Capabilities?
In cryptocurrency trading, a strategy may perform well in historical backtests but quickly fail under new market conditions. The problem may not lie in the trading logic itself; the strategy may instead be overfitted to the historical data used for optimization. Out-of-sample testing is an important way to identify this issue.
First, what is out-of-sample testing?
Out-of-sample testing means using data that was not involved in strategy development or parameter optimization to indepe
post-image
Woke up feeling oddly bullish on the @base eco
post-image
Load More

Join 40 M users in our growing community

⚡️ Join 40 M users in the crypto craze discussion

💬 Engage with your favorite top creators

👍 See what interests you

Trending Topics

GateLaunchesPoSECProofOfSecurity

239 Views455 Discussing

Gate has officially launched Proof of Security, or PoSEC, extending beyond Proof of Reserves by disclosing the distribution of cold-storage and hot-wallet assets and introducing a cold storage coverage ratio to measure protection under extreme-risk scenarios. Gate’s latest cold storage coverage ratio stands at 104.58%, with 88.26% of assets in cold storage and 11.74% in hot wallets. A coverage ratio of at least 100% means cold-storage assets alone would still be sufficient to cover all user assets even if hot-wallet assets were fully lost. Exchange security is not only about whether reserves are sufficient, but also how assets are stored and protected under extreme conditions. Could cold storage coverage become a new industry standard?[👉 Learn more](https://gate.com/proof-of-security)

BTCBackAbove80K

45.78k Views41.27k Discussing

DemocratsWinBothChambers

19.88k Views459 Discussing

View More