


Square
Following
Hot
News
Notifications
Profile
Share your thoughts
placeholder
Article
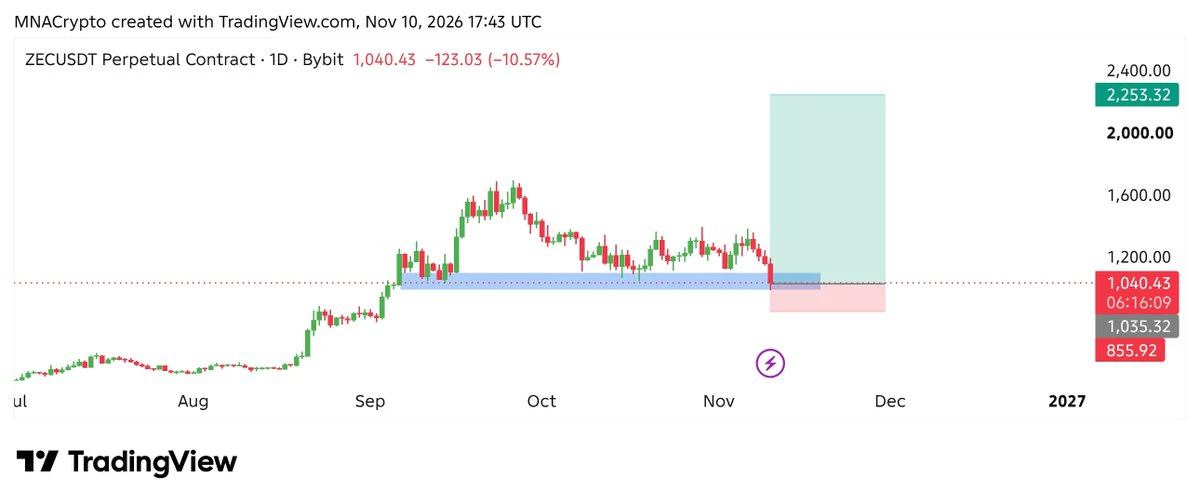
$ZEC Retesting the Breakout Support Zone on the 1D timeframe Chart..!!
Expecting +115% Bullish Rally.. 📈
Free Signals Group:
#Crypto #ZEC #ZECUSDT
post-image
ZEC+1.16%
BTC AND SOL
live-cover
LIVE2,573
Trenches
PIEVERSE
P
bade
b
PIEVERSE
0x0e...25a9
Market Cap
$.
Change
.
24h Vol
$.
Holders
.
X
X
bade
b
X
9VZe...pump
Market Cap
$.
Change
.
24h Vol
$.
Holders
.
牛逼
牛
bade
b
牛逼
0x96...7777
Market Cap
$.
Change
.
24h Vol
$.
Holders
.
FLOAT
F
bade
b
FLOAT
Bv1a...BMmr
Market Cap
$.
Change
.
24h Vol
$.
Holders
.
DacityCoin
D
bade
b
DacityCoin
DKYc...pump
Market Cap
$.
Change
.
24h Vol
$.
Holders
.
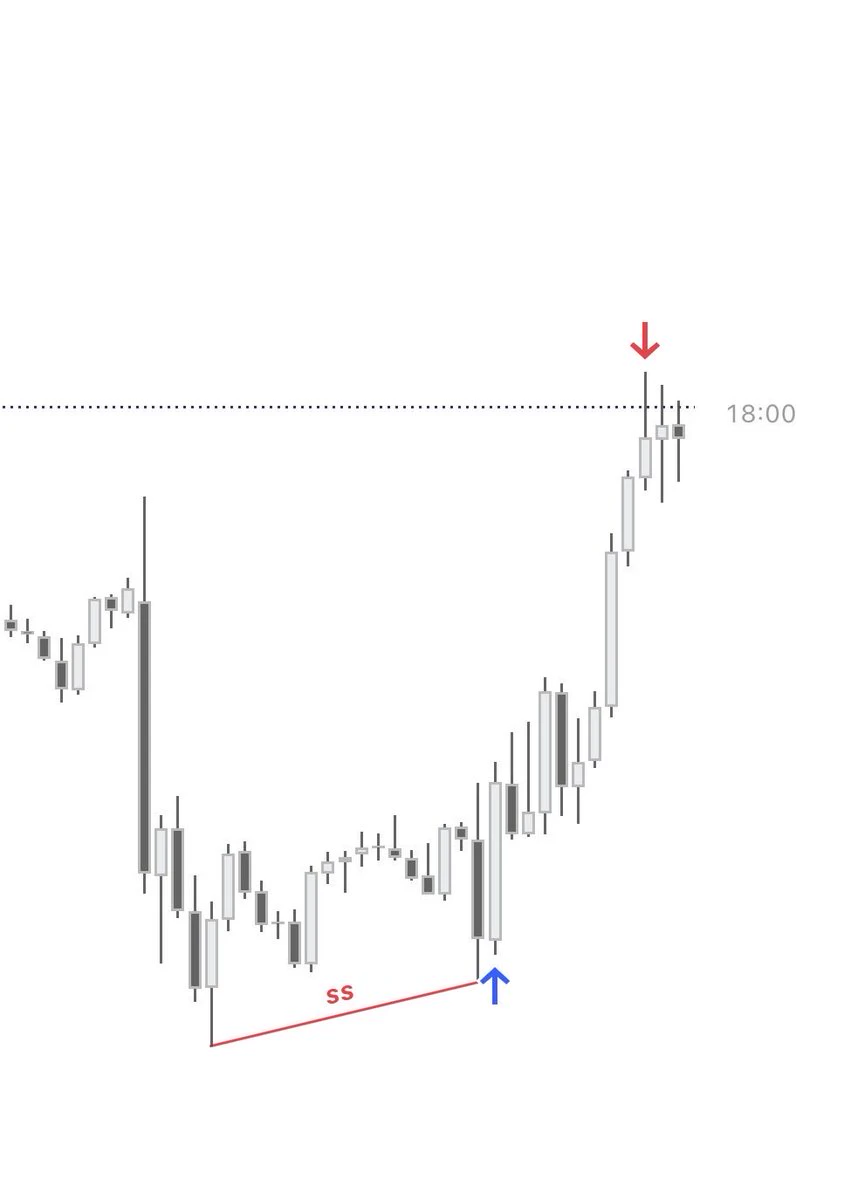
Delayed Protraction;
18:00 is your time based exit.
Irrespective of liquidity resting above the daily open.
post-image
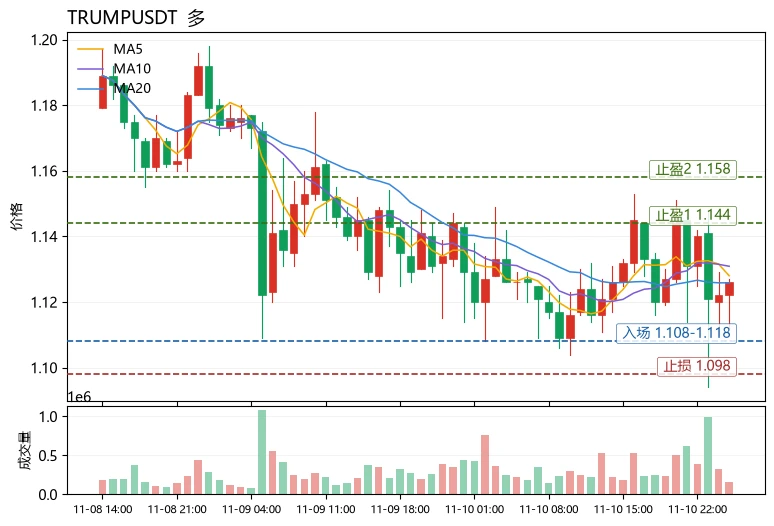
$TRUMP The current price is 1.126. The upper Bollinger Band at 1.14425 is the short-term line between bulls and bears, while MA20 at 1.12585 and the middle Bollinger Band at 1.10745 form two support levels. The funding rate remains positive at +0.0024%, indicating longs are paying to hold positions, but the price has risen just 0.45% in 24 hours. The mismatch between the funding rate and the gain suggests longs are crowded. MA5=1.128 is slightly above MA20, and the MACD histogram at +0.0006647 remains bullish but has extremely weak momentum. RSI is neutral at 48, with little strength behind t
post-image
NVDAB
NVDABNVDAB
Pump.Fun
MC:$3.5KHolders:1
4.36%
TRUMP-0.95%
#RedBullDoublePodiumInBrazil RedBullDoublePodiumInBrazil: Verstappen and Hadjar Deliver a Stunning Result at Interlagos

From 21st on the starting grid to second place at the finish line, Max Verstappen delivered a remarkable comeback in Brazil. Alongside an impressive third-place performance from Isack Hadjar, Red Bull Racing celebrated a spectacular double podium at the 2026 São Paulo Grand Prix. It was a weekend that demonstrated the importance of determination, teamwork, strategic decisions, and performance under pressure.

The Brazilian Grand Prix, held on November 8, 2026, at the legenda
$SNDK 🤣🤣You're giving it too much credit. I still had a short order sitting at 950; didn't expect it couldn't even get up to 920. I saw the trend reverse and immediately went short—made a killing.😋💰
post-image
SNDK-4.46%
📣 Gate Square Daily Standouts: November 10
Can BTC hold support, and can the stock rally last? Four creators explore the signals worth watching 👇

🔹 @TheBuzzingBee
BTC support, momentum and rebound scenarios.
🔹 @discovery
S&P 500 market breadth: does the rally have staying power?
🔹 @HighAmbition
KOSPI’s chip leaders, investor flows and participation beyond semiconductors.
🔹 @asiftahsin
BTC’s EMA and Fibonacci resistance: what needs to improve for a s
Gate_Square
📣 Gate Square Daily Standouts: November 10
Can BTC hold support, and can the stock rally last? Four creators explore the signals worth watching 👇

🔹 @TheBuzzingBee
BTC support, momentum and rebound scenarios.
🔹 @discovery
S&P 500 market breadth: does the rally have staying power?
🔹 @HighAmbition
KOSPI’s chip leaders, investor flows and participation beyond semiconductors.
🔹 @asiftahsin
BTC’s EMA and Fibonacci resistance: what needs to improve for a stronger recovery?

💬 Which take would you challenge—and why?
Read the posts and join the discussion on Gate Square👇
https://www.gate.com/post
🎁 Selected creators get a 3-day traffic boost + featured placement.
Share your own insights. Your next post could be featured.
Authors’ views. Not investment advice.

repost-content-media
BTC-0.67%
SPX500+0.19%
At 72688, $BTC —the number looks pretty appealing, so I picked up a little, quietly hoping I won’t be left holding the bag at the top 😂
Both headline and core US CPI for October came in above expectations, adding more uncertainty to the macro outlook.
Risk warning: The above is only a personal trading record and does not constitute investment advice. Contract trading carries extremely high risks, so please make decisions cautiously.
post-image
BTC-0.67%
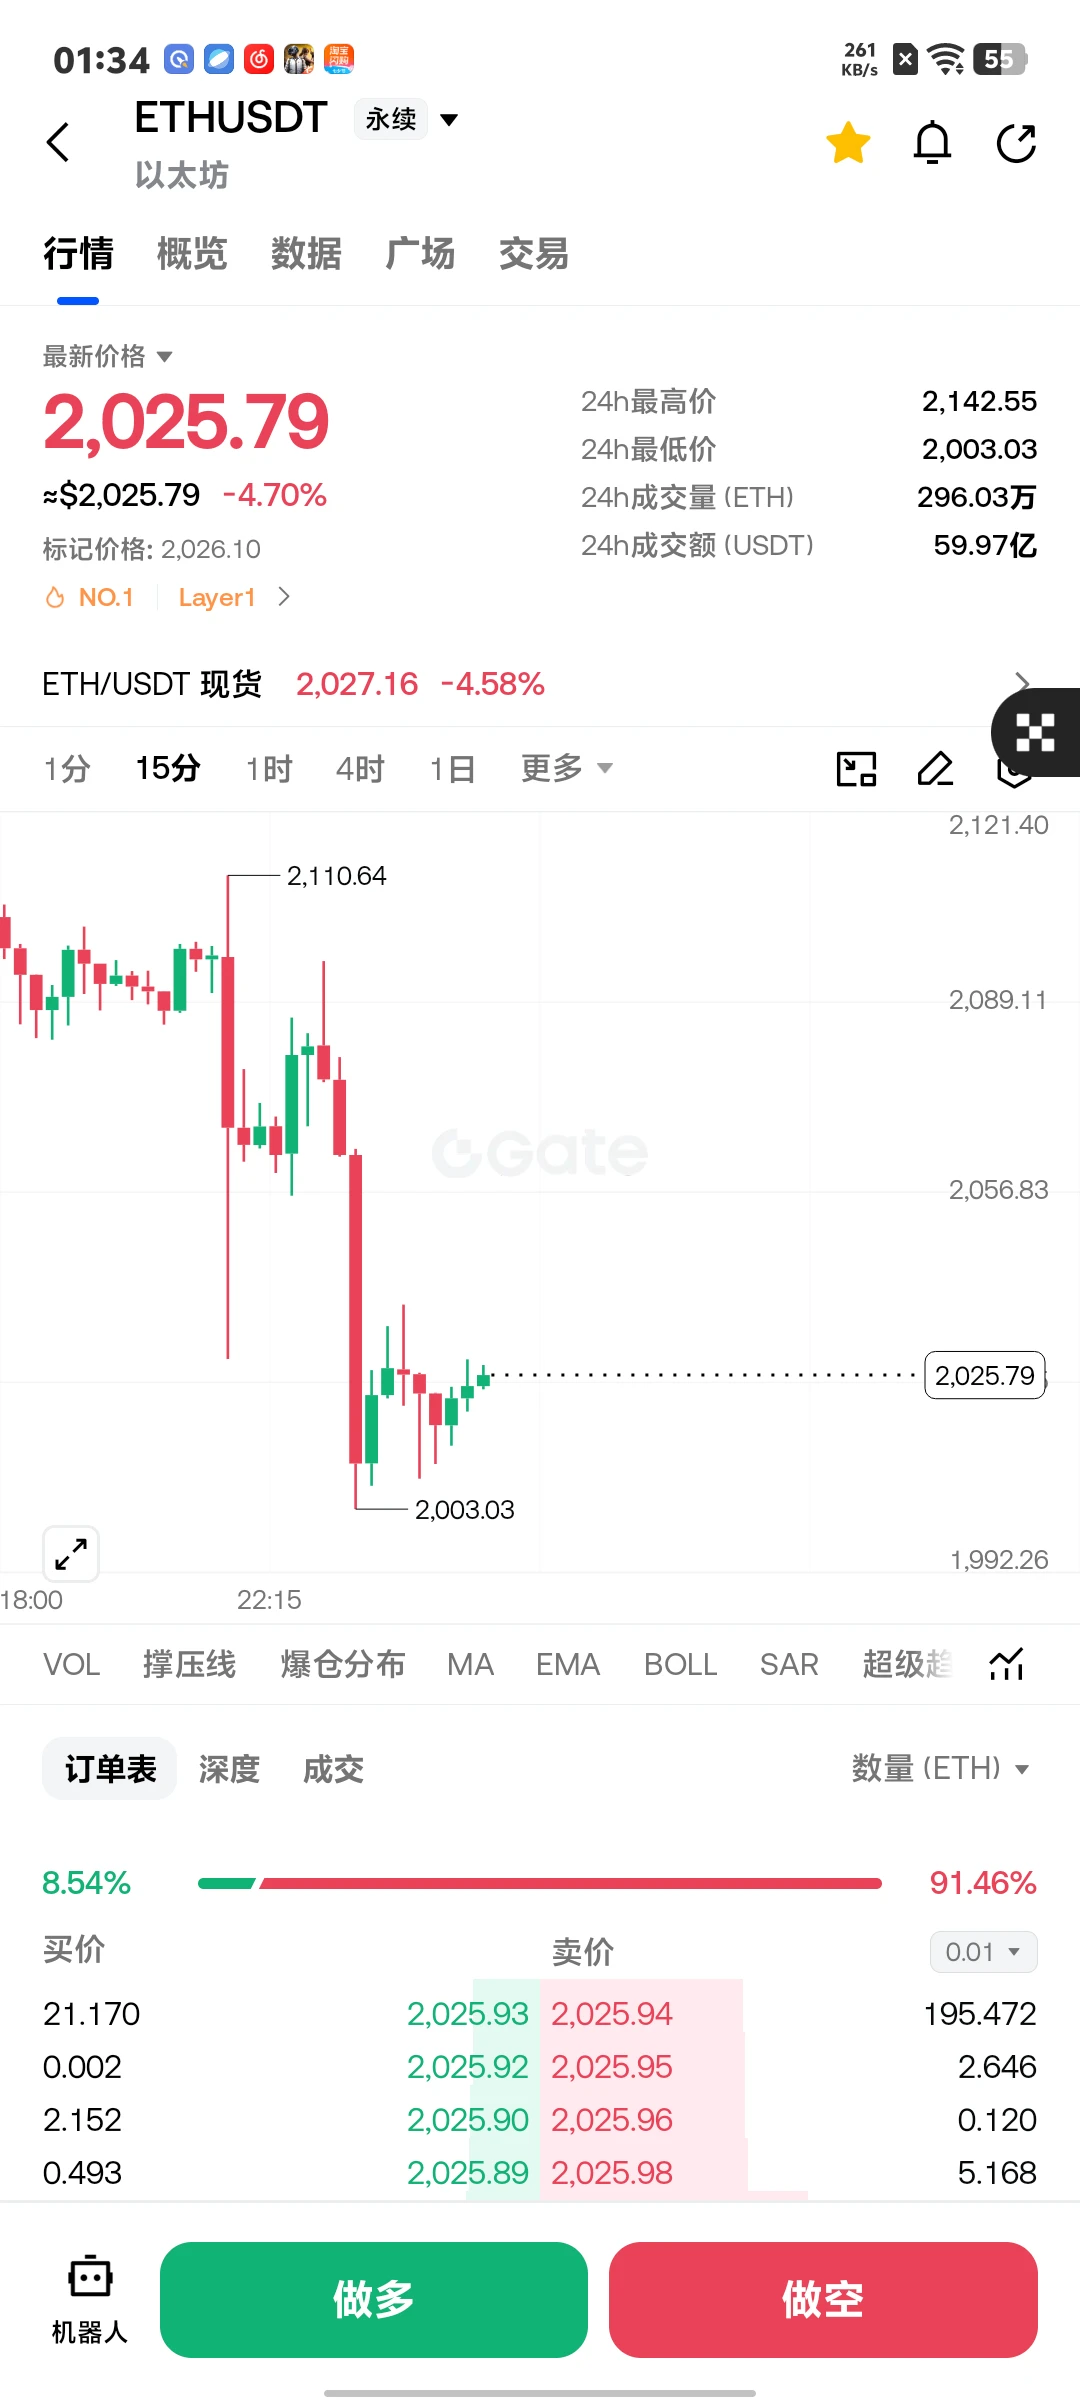
These two wicks are brutal—they’re trying to beat us to death. Drop below 2,000 for me $ETH
post-image
ETH-1.23%
Google has launched the Gemini 4 Carbon model, focused on cybersecurity and complex scientific research tasks, and made it available for testing to developers and other groups.
High-end models continue to target specialized use cases, while ordinary users may find their core capabilities difficult to access.
$BTC
post-image
BTC-0.67%
2026.11.11
Daily entry point: 2022
Support levels below: 2020-2010-2000-1979-1958
Resistance levels above: 2030-2058-2079-2095-2105
2115-2120-2132
If any support or resistance level breaks, stop out; if it holds, catch the rebound. If it breaks again, follow the trend.
If price holds above 2081-2095-2100, go long on dips; otherwise, go short on rallies. The 2031-2058 range in the middle is the bull-bear dividing line. Below, go long on dips if 2004-2000-1979 hold; if they break, follow the move down. Personal opinion for reference only!#Gate全球合规版图扩展 $ETH
ETH-1.23%
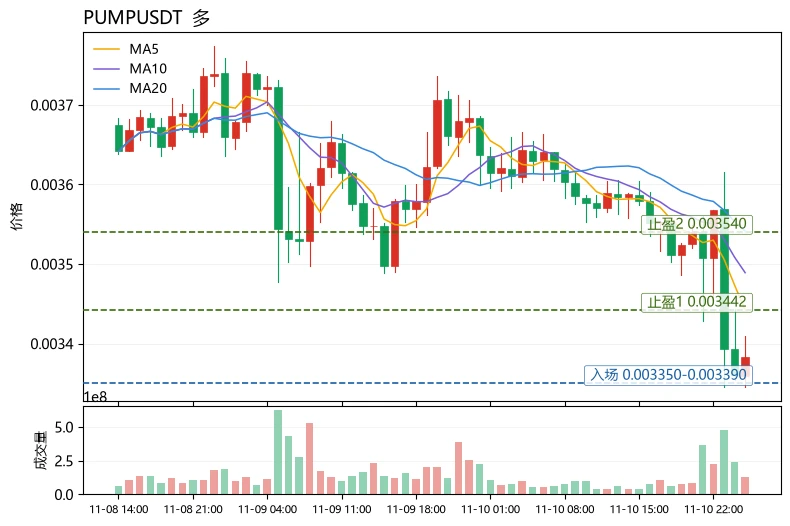
The most unusual detail in today's market is that $PUMP the funding rate is -0.0012%, yet the price remains pinned near the lower Bollinger Band at 0.0033898—shorts are crowded, but spot markets have not seen corresponding panic selling, suggesting the decline is driven more by leverage than active selling.

Technically, PUMP is currently at 0.003386, with MA5 at 0.0034422 below MA20 at 0.00354135. The short-term moving averages are in a bearish alignment, while the medium-term averages have yet to flatten out; the MACD histogram at -1.919e-05 remains negative, with no sign of bearish momentu
post-image
PUMP-0.99%
PARTI-1.06%
ZEC+1.16%
Bitcoin ETFs saw a net outflow of $412 million, with BlackRock’s IBIT posting a net outflow of $403
live-cover
LIVE325
XRP Technical Outlook: XRP Breaks Below $1.05 as Selling Pressure Intensifies

XRP is showing renewed weakness on the daily chart, with price falling toward $1.049 after breaking below several important support levels. The latest move puts sellers firmly in control, while RSI has dropped deep into oversold territory.

XRP is also trading below all four major EMAs, highlighting significant weakness in its broader daily structure. The key question now is whether buyers can defend the $1.00 psychological area or whether another leg down will follow.

1. EMA Structure: Bearish Momentum Dominates

XRP-1.15%
$BEAMX Go long. 0.00426 is the line on the 4-hour chart. The price is currently just above it. I want to see buyers defend this area and push the price higher. A break below 0.00412 invalidates this trade idea. The price at 0.00427 is above the 4-hour EMA50 (0.00417), so buyers remain in control of the trend. The stop-loss distance is 3.4%, and the distance to TP3 is 5.5%, giving a risk-reward ratio of about 1.6R to the final target. The daily price is above the EMA200 (0.00233), so the broader trend is on our side. 🟢 Long · Entry 0.004257–0.004281 · Take profit 0.004357 / 0.004415 / 0.00450
post-image
BEAMX+5.82%
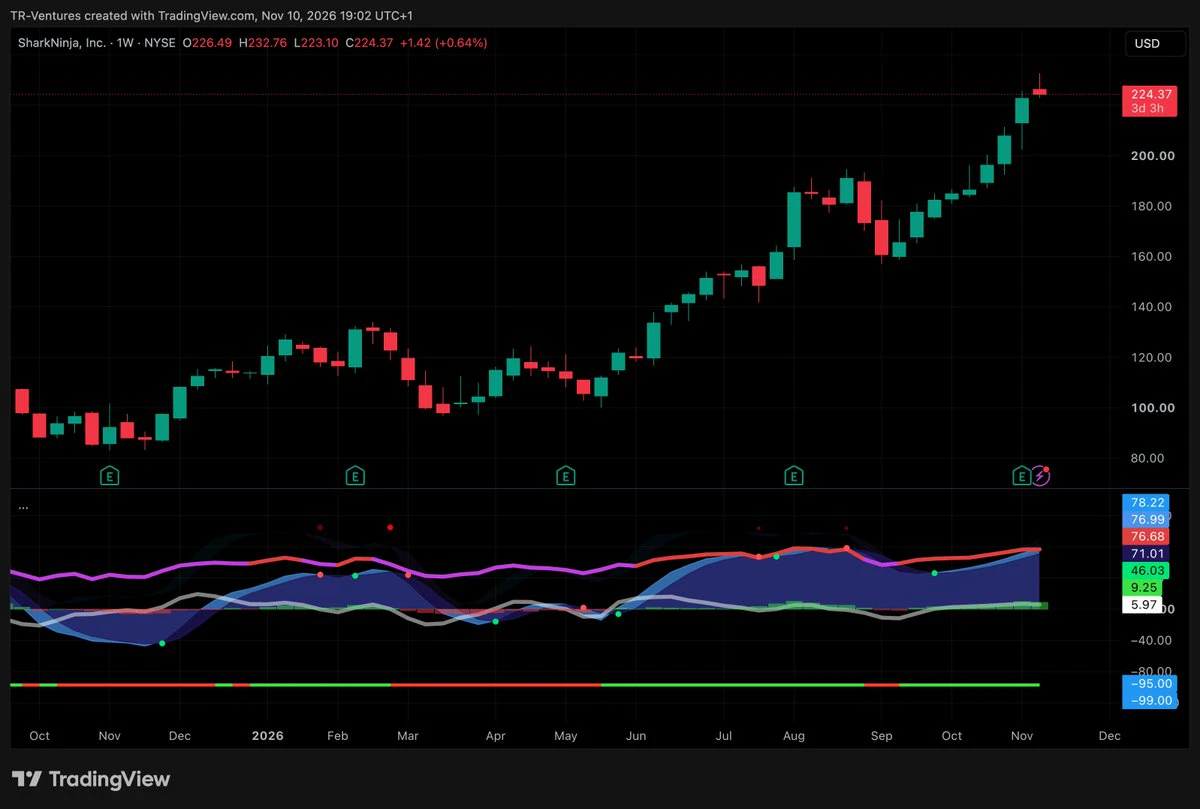
I don't talk often about stocks here but $SN is one of my favs.
They are really good at creating new trending products and marketing them well. And most importantly:
Kitchen and Home Appliances are very contrary to the rest of my portfolio.
Think of it as one way to hedge.
post-image
SN-1.62%
#每周来晒 #美国10月CPI即将公布

The upcoming U.S. Consumer Price Index (CPI) report could become one of the most important macroeconomic events for financial markets. At a time when investors are closely monitoring inflation, interest rates, economic growth and liquidity conditions, even a small difference between expected and actual CPI figures could create significant volatility across traditional and digital assets.

My assessment is that this report should not be viewed simply as another monthly inflation update. It could provide important clues about the Federal Reserve's next policy decision and d
BTC-0.67%
ETH-1.26%
XAUT+0.30%
XAU+0.38%
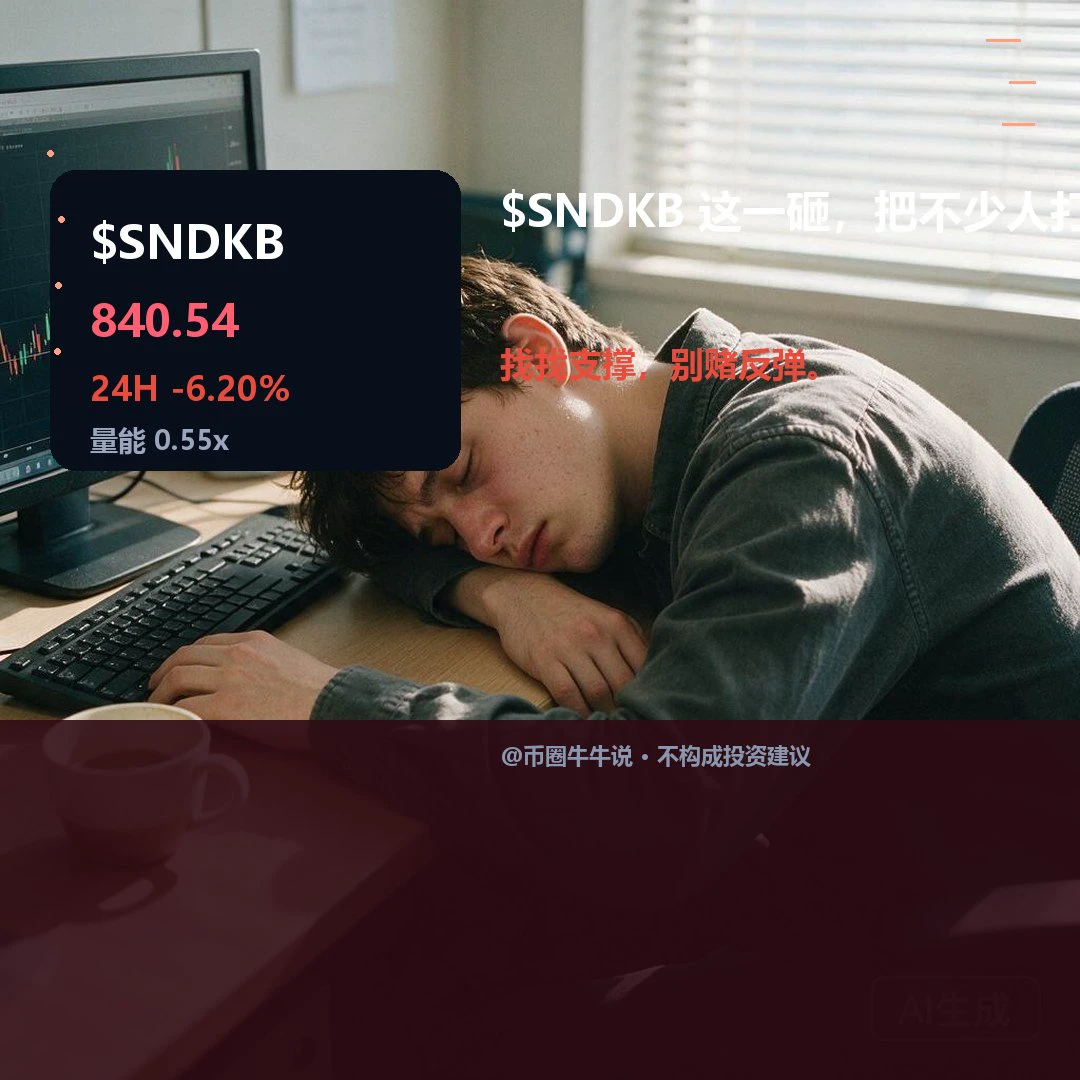
$SNDKB Currently at 840.54, down 6.20% over 24H (range: 833.7–915.86). The 1H trend is weak, with an RSI of 40; the 4H trend is weak, with an RSI of 51. If it breaks above 915.86 decisively, watch for further upside. If it falls below the 833.7 support, the short-term structure may weaken. The market is highly volatile; for observation only.
post-image
HSBC, with more than $3.44 trillion in assets, has now supported more than $8.3 billion in digital asset issuances on its Orion platform.
In July, when the Bank of England cleared Orion for its sandbox, the total was more than $5 billion.
@HSBC
HSBC-0.32%
ORION-6.09%
Load More

Join 40 M users in our growing community

⚡️ Join 40 M users in the crypto craze discussion

💬 Engage with your favorite top creators

👍 See what interests you

Trending Topics

GateGlobalComplianceExpansion

7.7k Views253 Discussing

Gate continues to expand its global compliance footprint, now covering 81 regulated jurisdictions across Europe, North America, Asia, and Oceania. From MiCA and U.S. state-level MTLs to Japan’s FSA, Dubai, and Australia-related regulatory approvals, global exchanges are entering a new stage of compliance competition. Do you think regulatory strength will become as important as products and liquidity for exchanges in the future?

USCPIDataIncoming

68.07k Views2.39k Discussing

USIranTalksShowNewProgress

16.45k Views1.33k Discussing

View More