



Square
Following
Hot
News
Notifications
Profile
Share your thoughts
placeholder
Article
Combos are now live on Jupiter Predict, powered by Polymarket, letting Solana users stack sports and esports picks into one bet for a bigger payout.
Polymarket took in a record $125.65M in fees in October, more than $4.05M a day.
@JupiterExchange
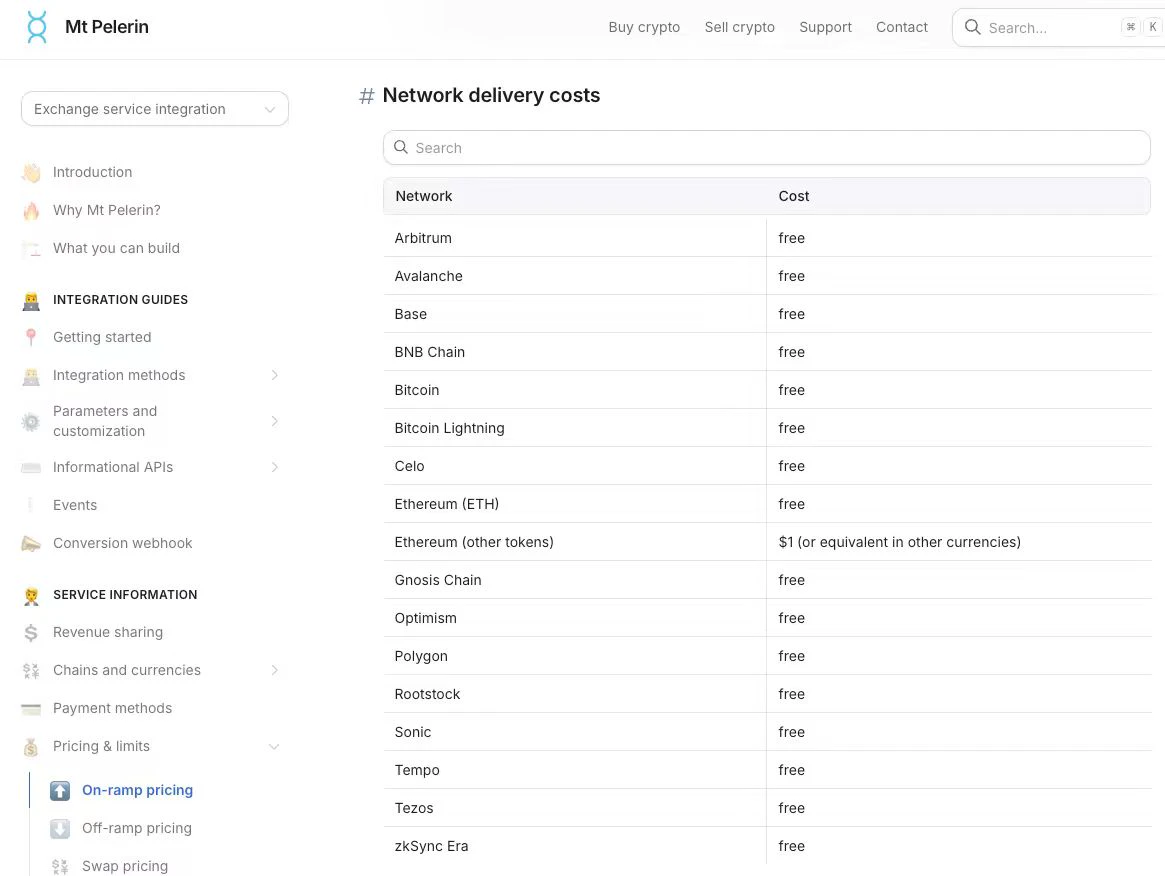
f(x) Protocol @protocol_fx's fxUSD can connect directly to bank accounts through Mt Pelerin, but completing an actual fiat on-ramp or off-ramp involves several separate steps.
When buying, users send fiat to Mt Pelerin via bank transfer or another method. Mt Pelerin converts it into fxUSD at the prevailing exchange rate, then sends it to the wallet specified by the user.
The official page says buying fxUSD by bank transfer has a 0% conversion fee, while the card FAQ lists a 2.5% fee. Selling works in reverse: users send fxUSD from their wallet to the service provider, which converts it to fiat
post-image
ETH-1.26%
BTC-0.67%
Trenches
ZIG
Z
bade
b
ZIG
0x8c...1145
Market Cap
$.
Change
.
24h Vol
$.
Holders
.
STONK
S
bade
b
STONK
6GmA...UNgx
Market Cap
$.
Change
.
24h Vol
$.
Holders
.
IDOL
I
bade
b
IDOL
0x3b...ab07
Market Cap
$.
Change
.
24h Vol
$.
Holders
.
BTC
B
bade
b
BTC
C5xp...pump
Market Cap
$.
Change
.
24h Vol
$.
Holders
.
FLOAT
F
bade
b
FLOAT
Bv1a...BMmr
Market Cap
$.
Change
.
24h Vol
$.
Holders
.
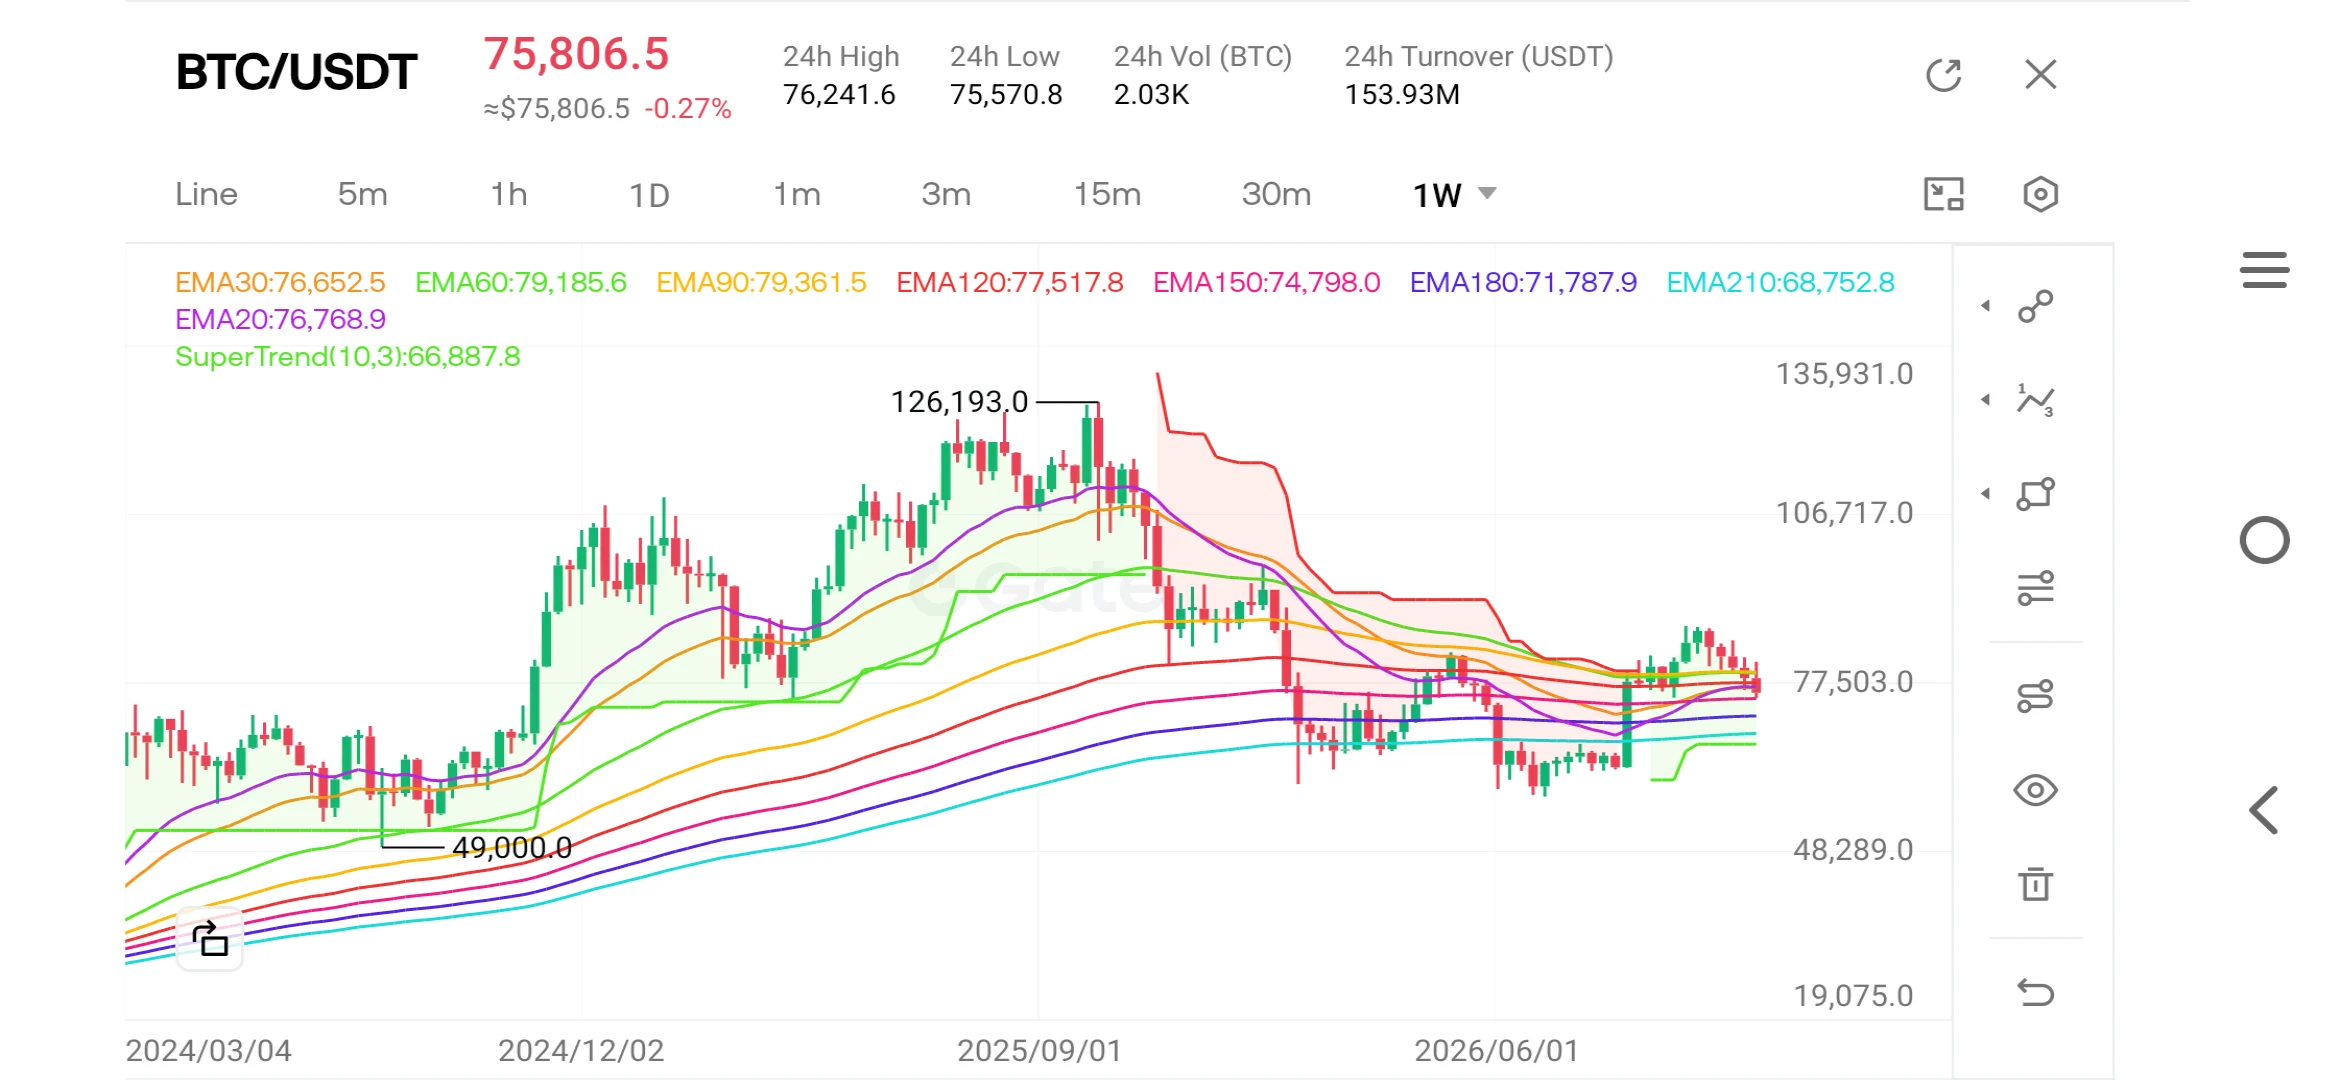
Why has the Ahr999 dropped below 0.45, and what does this signify?

As Bitcoin trades within the $75,000–$76,000 range, the Ahr999 indicator has fallen below the 0.45 threshold to approximately 0.43—a level historically identified as a "buy-the-dip" zone. It has been confirmed that previous instances where the indicator dipped below 0.45 coincided with the market bottoms seen in late 2018, early 2020, and the 2022 bear market. Furthermore, it is noted that Bitcoin is currently attempting to defend the $75,000 support level, with the market’s focus fixed on the U.S. Consumer Price Index (CPI) d
post-image
BTC-0.67%
  • 1
$JCT Down 18% in a day, and the longs got completely wiped out. Yesterday it peaked at 0.0036; now it’s at 0.0027, after touching a low of 0.0026. Trading volume hit $100 million—and it hasn’t dried up, which means it’s not that nobody’s trading anymore. Some are buying at the lows, while others are cutting losses at the highs, with a bloodbath of turnover.
Think of it this way: it’s like a market stall having a clearance sale in the last half hour. Produce that originally cost 3.6 is now 2.7, and sales volume is still huge—not because the produce has gone bad, but because the vendor is in a h
Many traders expect a price pullback after BTC rises, hoping to get a better entry. But a retest is not always an opportunity; sometimes it can also signal that a downtrend is resuming. The key is to determine whether support is holding and whether the overall market trend remains healthy.
First, assess the strength of support. If a price area has repeatedly seen rebounds in the past, it may indicate strong buying demand there. When the price returns to this area, watch closely to see whether buyers step in again.
Second, watch for changes in trading volume. If volume gradually declines as the
BTC-0.67%
#Ahr999跌入抄底区间 Ahr999 is a commonly used valuation indicator in the Bitcoin community, introduced in 2018 by Jiu Shen, who goes by the online handle “ahr999.” It is also called the “Jiu Shen Index.” It is used to judge whether the current price is expensive or cheap.
Formula: (current price ÷ 200-day DCA cost) × (current price ÷ exponential growth valuation).
200-day DCA cost: the average cost of buying a fixed amount each day over the past 200 days, calculated using the geometric mean.
Exponential growth valuation: the long-term theoretical price fitted to the number of days since Bitcoin’s cr
BTC-0.67%
  • 5
  • 1
When BTC Moves Sideways, How Can You Determine Its Next Direction?

In the cryptocurrency market, sideways price action is often more frustrating for traders than a one-way rally or decline. Prices fluctuate repeatedly within a range, making it look like there are plenty of opportunities, but few people can actually capitalize on them. Some keep going long, while others repeatedly go short, only to find that fees and frequent stop-losses keep eating away at their accounts.

So, how should you determine BTC’s next move while it’s trading sideways?

First, watch for changes in trading volume. If
post-image
BTC-0.67%
[new streamer]MARKET UPDATE
live-cover
LIVE659
11.8 Weekend Morning Market Overview: Sideways Trading Over the Weekend—Get Some Rest

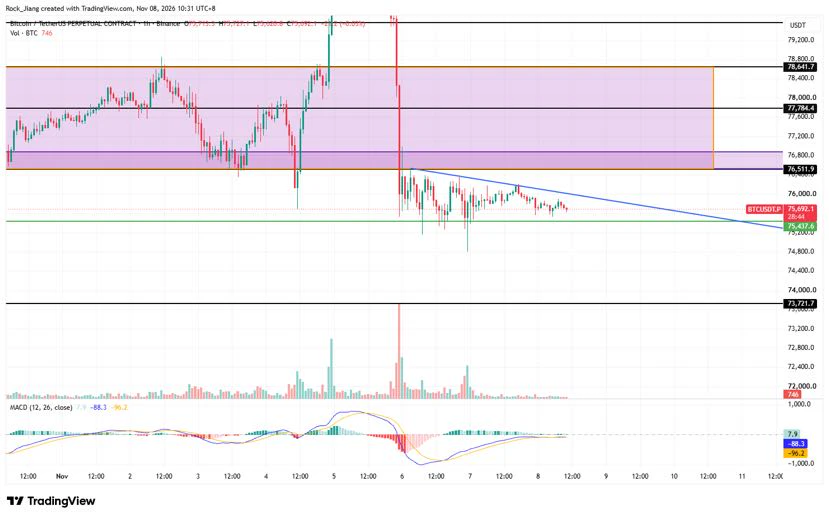
BTC formed a doji this morning and is trading sideways near the lows

BTC is in a descending converging triangle pattern. As time passes, 7.54 and the descending trendline are converging, showing signs of a rebound

BTC has retested 7.54 several times, and the candlestick bodies have not broken below it, so support is holding for now

Resistance is above 7.65. Support and resistance have switched roles. A bullish rebound is only likely if the price breaks above 7.65 and holds; otherwise, expect c
post-image
BTC-0.65%
  • 5
#美股史诗级抛售 #每周来晒
🤖 The Generative Pivot: Rotating Capital from Silicon Infrastructure to Software Commercialization

The architectural paradigm of the artificial intelligence supercycle is undergoing a monumental phase transition. Following an aggressive, multi-billion-dollar deleveraging event across hardware, foundry, and computational data-center stocks, public equity markets are executing a highly coordinated capital rotation. The foundational layer of the trade is fundamentally shifting: the market is moving rapidly away from tracking who is spending the most on raw computing power to scr
Falcon_Official
#USAIStocksHitHard NAS100 5M: Bulls Are Regaining Control – Key Demand Zone in Focus

NAS100 is showing encouraging bullish momentum on the 5-minute timeframe after sweeping sell-side liquidity (SSL) and reclaiming an important support area.

This price action suggests buyers are stepping back into the market. However, the next move will depend on how price reacts around the demand zone.

Key Levels to Watch:

- Equilibrium: 26,670
- OTE Zone: 26,513
- Bullish Order Block: 26,448
- Demand Zone: 26,513 – 26,448
- Liquidity Target: 27,054

Bullish Outlook

I'm watching for a controlled pullback into the 26,513–26,448 zone. If buyers defend this area and bullish confirmation develops, NAS100 could gain enough momentum to target the 27,054 liquidity level.

What Could Invalidate the Setup?

A strong move below the demand zone would weaken the bullish structure and require a fresh assessment of market conditions.

For now, there is no need to chase price. Let the market return to the planned zone, observe the reaction, and wait for confirmation before considering a long position.

Patience and discipline matter more than catching every move.

What are you watching on NAS100 — another bullish leg or a deeper pullback?

#USStocksFaceHistoricSelloff #GateLaunchesPoSECProofOfSecurity #GateGuardNowAvailableForFree #ShareWeekly $NAS100

GOOGL+0.72%
MSFT-0.95%
AMZN-0.44%
PLTR+3.57%
ORCL+0.84%
  • 3
#Ahr999EntersBottomBuyingZone

AHR999 Drops Below 0.45: Bitcoin Enters a Historically Important Bottom-Buying Zone

The Market Has Reached an Important Point

Imagine watching Bitcoin trade around $80,000, then seeing its price move lower while a long-term valuation indicator enters a historically important zone. You might wonder whether the market is approaching a major turning point or simply experiencing another correction.

That is the situation surrounding the AHR999 indicator on November 8, 2026. Its latest reported reading is approximately 0.429, placing Bitcoin inside the historically
post-image
BTC-0.67%
Apparently, this is the fifth-generation housing currently being piloted in China.
#ARIA

Writing

ARIA Climbs 7.8%: A Strong Market Move, but the Real Story Is What Happens Next

The Move That Caught Attention

ARIA has recorded a positive 24-hour move, reaching 0.16023 USDT with a price increase of 7.8%. The move comes alongside approximately 3.45 million USDT in 24-hour trading volume. These figures show meaningful market activity, but there is an important question behind the rise: is this the beginning of stronger demand, or simply a short-term wave of buying?

Market data recorded on November 8, 2026, at 01:30 UTC, provides a useful starting point for understanding wh
post-image
ARIA+22.03%
‍#每周来晒 #广场交易达人 #WCTCS9

Next Week's Crude Oil Trading Plan

Crude oil posted its biggest weekly drop in six years last week, confirming a double-top pattern. I expect it will likely rebound early next week, and my trading strategy is to go long first, then short:

1. Crude oil long:

Planned entry: around 97

Stop-loss: 92

Take-profit: around 105

2. Crude oil short:

Planned entry: above 105

Stop-loss: 111

Take-profit: Hold for the long term $XBRUSD
post-image
XBRUSD-1.42%
Ten years of childhood sweethearts showing off their love.
A classmate dropped a major bombshell.
post-image
$ZEC I caught the falling knife at 1241, and my hands are still shaking.
Let’s start with the data—no need to comfort me yet. ZEC is currently at 1241.52, down 8.06% over 24h, with an intraday high of 1355.45 and low of 1235.21. Trading volume is 1.349 billion—it hasn’t contracted, which means panic selling is still underway. I reviewed ZEC’s price action across the past three halving cycles: after the first halving, a roughly -12% shakeout came on day 18; after the second, it was -9.8% on day 22; after the third, -8.5% on day 15. Today is exactly day 16 after this halving, with a decline of 8
ZEC+1.16%
🚀🚀🚀$BTC ‌$GT ‌$ETH ‌#CPI数据前瞻
post-image
BTC-0.65%
GT-2.24%
ETH-1.23%
  • 4
Buying the dip has already brought me to tears. Promise me, don’t cry so easily.
post-image
Michael Saylor Reveals 400-Year History Behind Bitcoin Earnings
Michael Saylor traced the financing model for holding bitcoin through Strategy’s dividend-paying stock back to four centuries of financial history. His analysis linked Dutch trading companies, railroad financing, and U.S. tax law to the company’s Stretch securities.
In an analysis dated November 7, Michael Saylor, founder and executive chairman of Strategy Inc. (Nasdaq: MSTR), linked the company’s yield-bearing securities to four centuries of financial history. He described Stretch, Strategy’s variable-rate preferred stock trading
post-image
BTC-0.67%
MSTR-0.30%
STRC+0.34%
Following the release of the non-farm payrolls data, the probability of a Fed rate hike in December
live-cover
LIVE2,648
Load More

Join 40 M users in our growing community

⚡️ Join 40 M users in the crypto craze discussion

💬 Engage with your favorite top creators

👍 See what interests you

Trending Topics

USCPIDataIncoming

1.04k Views1.47k Discussing

The U.S. October CPI report will be released on November 10 at 8:30 a.m. ET. September CPI came in at 3.7% year over year, and markets will be watching closely for signs that inflation is cooling, especially in core CPI. A softer-than-expected reading could strengthen rate-cut expectations, while hotter inflation may pressure risk assets through higher Treasury yields and a stronger dollar. How do you think this CPI print will move $BTC, U.S. stocks and gold?

USAIStocksHitHard

23.56k Views3.69k Discussing

USNonfarmPayrolls

40.34k Views4.38k Discussing

View More