







#StriveHoldingsRiseTo36818BTC #WCTCS9 Strive now holds 36,818 BTC: the numbers behind the accumulation, and what they can and cannot tell the market
Strive's Bitcoin treasury just crossed 36,800 BTC, and with BTC near $81,791 the question is whether steady corporate buying changes market expectations. Here is the data first, then my read.
The purchases
Strive added 1,223 BTC between October 14 and 16 for roughly $100 million, at an average of about $81,734 per coin. That follows 2,822 BTC bought on October 12 and 13 for $235 million. Together, 4,045 BTC were acquired between October 12 and 16 for about $335 million, at an average of roughly $82,803 per coin including fees and expenses.
The holdings jump
Holdings rose from 29,462 BTC before the three recent transactions to 36,818 BTC, an increase of about 25%. At today's $81,791, the stack is worth roughly $3.01 billion by my math. That puts Strive ahead of MARA Holdings' reported 35,577 BTC treasury.
My math on the week's cost basis
The latest 1,223 coins were bought at $81,734, so at $81,791 they sit almost exactly at breakeven, up about $70,000. The full 4,045 BTC blended at $82,803 is about 1.2% above today's price, an unrealized paper loss near $4.1 million. That is small against a $335 million purchase, and it shows Strive was buying near the middle of a volatile week, not at the lows. The overall cost basis of all 36,818 BTC has not been disclosed.
How it was funded
This matters as much as the buying. Strive raised about $369 million through warrant exercises and issued 13.7 million common shares. It also priced a $630 million offering of 15% SATS preferred stock on October 15, set to settle October 20. The 15% annual dividend rate adds an ongoing financial obligation. By my calculation, that is about $94.5 million a year on $630 million. If all of it were deployed at today's price, it would buy roughly 7,700 BTC, though the company has not said how the proceeds will be used.
One reassuring detail: holdings rose 12.3% over the period, keeping bitcoin per share broadly unchanged, so existing shareholders were not significantly diluted in BTC terms.
The race for position
CEO Matt Cole said the company could finish 2026 as the second-largest public Bitcoin holder, behind Strategy's 848,250 BTC. The next target is Twenty One Capital, which held 43,514 BTC in early October, a gap of roughly 6,700 BTC. The Block notes Strive would need to acquire an average of around 700 BTC per week to surpass Metaplanet's stash.
The scale of the buying
Strive's five-day pace works out to about 809 BTC per day. At the current 3.125 BTC block subsidy, miners produce about 450 BTC a day, so Strive absorbed roughly 1.8 times daily issuance that week. That is a meaningful demand source. Still, the pace has been uneven, and broader institutional demand remains uncertain.
Does continued accumulation strengthen market expectations
My honest answer is partly. Corporate treasury buying is supportive: it shows large buyers stepping in during weakness, it removes coins from liquid supply, and it feeds a narrative of institutional conviction. But the price record this week shows its limits. BTC ranged from about $79,842 to $84,324 during the very days Strive was buying, and it is still testing the same resistance. Demand of this size supports dips, but it does not by itself set direction.
The risks to the model
First, the funding loop depends on equity markets. Warrant exercises and preferred sales work best when the stock trades well. Second, a 15% dividend is a fixed cost, so lower BTC prices would stress the model. Third, concentration matters, since a few treasury companies have driven a large share of recent demand.
Chart context at $81,791
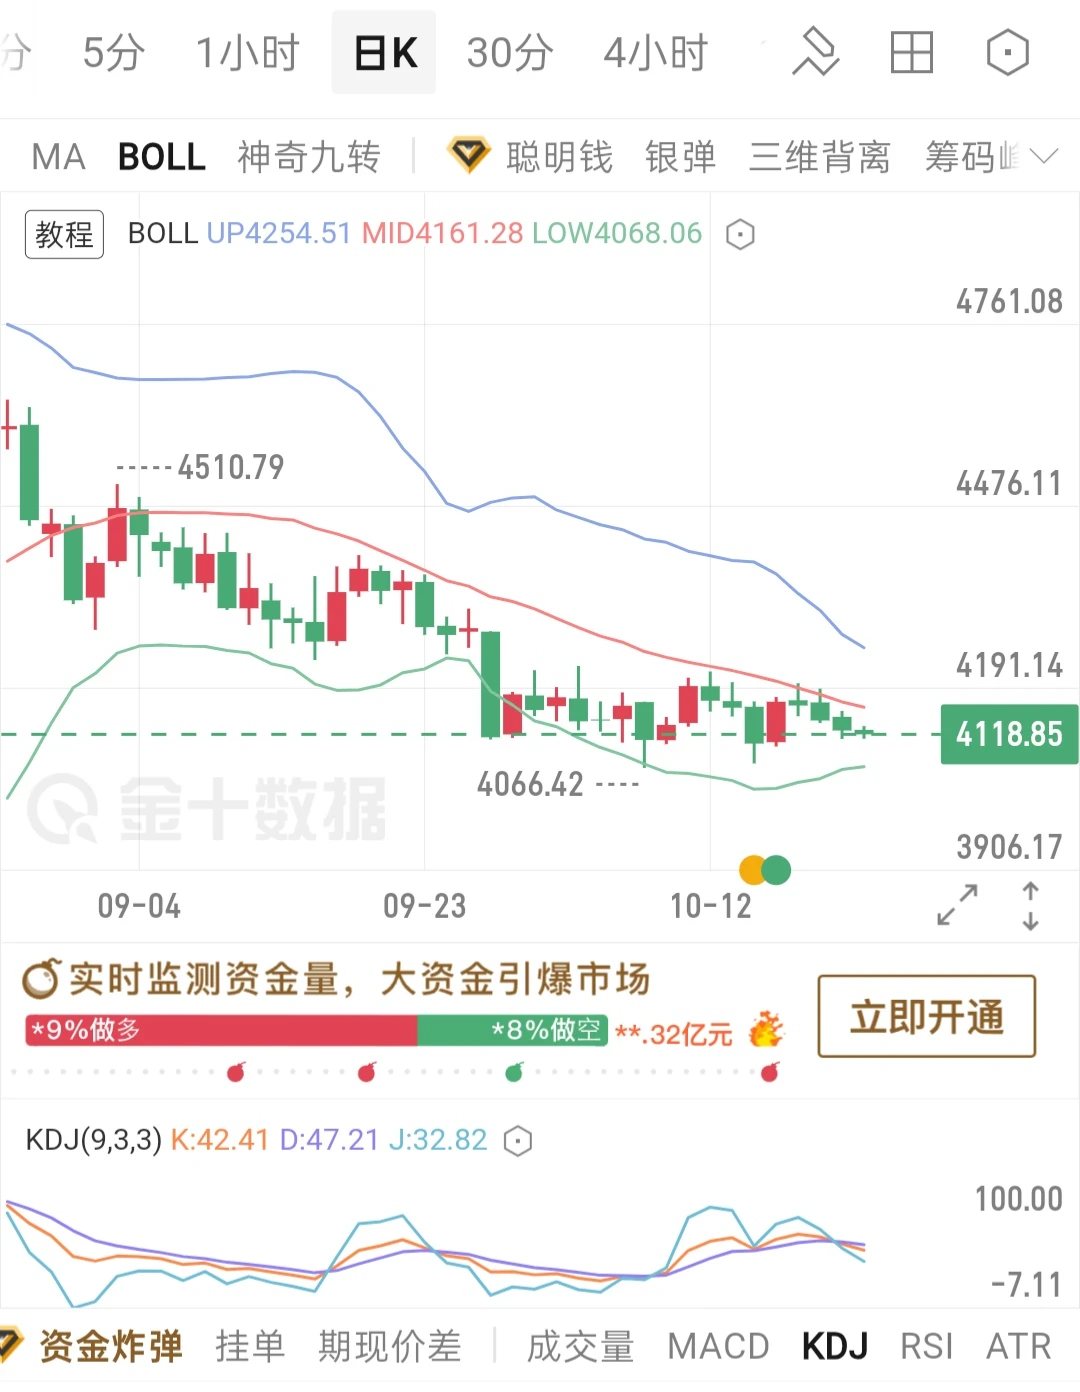
BTC sits just below resistance at $82,538, with $84,049 to $84,250 above it. Support sits at $81,000 and then the 50-day EMA near $80,443. A daily close above $82,538 would be the first sign that the accumulation story is feeding into price. A close below $80,443 would put $79,694 back in play.
What I will watch next
The settlement of the SATS offering on October 20, the next weekly disclosure of purchases, how much of the new capital goes into BTC, and whether peers such as Strategy and Metaplanet keep buying. The Fed meeting on October 27-28 is the next macro test.
My take
Treasury accumulation is a real tailwind, but it is one input among many. I would treat it as a supportive floor, keep size modest, and wait for price to confirm above $82,538 before leaning bullish.
Share your own view below: does steady corporate buying change your outlook, and which level are you watching.
Strive's Bitcoin treasury just crossed 36,800 BTC, and with BTC near $81,791 the question is whether steady corporate buying changes market expectations. Here is the data first, then my read.
The purchases
Strive added 1,223 BTC between October 14 and 16 for roughly $100 million, at an average of about $81,734 per coin. That follows 2,822 BTC bought on October 12 and 13 for $235 million. Together, 4,045 BTC were acquired between October 12 and 16 for about $335 million, at an average of roughly $82,803 per coin including fees and expenses.
The holdings jump
Holdings rose from 29,462 BTC before the three recent transactions to 36,818 BTC, an increase of about 25%. At today's $81,791, the stack is worth roughly $3.01 billion by my math. That puts Strive ahead of MARA Holdings' reported 35,577 BTC treasury.
My math on the week's cost basis
The latest 1,223 coins were bought at $81,734, so at $81,791 they sit almost exactly at breakeven, up about $70,000. The full 4,045 BTC blended at $82,803 is about 1.2% above today's price, an unrealized paper loss near $4.1 million. That is small against a $335 million purchase, and it shows Strive was buying near the middle of a volatile week, not at the lows. The overall cost basis of all 36,818 BTC has not been disclosed.
How it was funded
This matters as much as the buying. Strive raised about $369 million through warrant exercises and issued 13.7 million common shares. It also priced a $630 million offering of 15% SATS preferred stock on October 15, set to settle October 20. The 15% annual dividend rate adds an ongoing financial obligation. By my calculation, that is about $94.5 million a year on $630 million. If all of it were deployed at today's price, it would buy roughly 7,700 BTC, though the company has not said how the proceeds will be used.
One reassuring detail: holdings rose 12.3% over the period, keeping bitcoin per share broadly unchanged, so existing shareholders were not significantly diluted in BTC terms.
The race for position
CEO Matt Cole said the company could finish 2026 as the second-largest public Bitcoin holder, behind Strategy's 848,250 BTC. The next target is Twenty One Capital, which held 43,514 BTC in early October, a gap of roughly 6,700 BTC. The Block notes Strive would need to acquire an average of around 700 BTC per week to surpass Metaplanet's stash.
The scale of the buying
Strive's five-day pace works out to about 809 BTC per day. At the current 3.125 BTC block subsidy, miners produce about 450 BTC a day, so Strive absorbed roughly 1.8 times daily issuance that week. That is a meaningful demand source. Still, the pace has been uneven, and broader institutional demand remains uncertain.
Does continued accumulation strengthen market expectations
My honest answer is partly. Corporate treasury buying is supportive: it shows large buyers stepping in during weakness, it removes coins from liquid supply, and it feeds a narrative of institutional conviction. But the price record this week shows its limits. BTC ranged from about $79,842 to $84,324 during the very days Strive was buying, and it is still testing the same resistance. Demand of this size supports dips, but it does not by itself set direction.
The risks to the model
First, the funding loop depends on equity markets. Warrant exercises and preferred sales work best when the stock trades well. Second, a 15% dividend is a fixed cost, so lower BTC prices would stress the model. Third, concentration matters, since a few treasury companies have driven a large share of recent demand.
Chart context at $81,791
BTC sits just below resistance at $82,538, with $84,049 to $84,250 above it. Support sits at $81,000 and then the 50-day EMA near $80,443. A daily close above $82,538 would be the first sign that the accumulation story is feeding into price. A close below $80,443 would put $79,694 back in play.
What I will watch next
The settlement of the SATS offering on October 20, the next weekly disclosure of purchases, how much of the new capital goes into BTC, and whether peers such as Strategy and Metaplanet keep buying. The Fed meeting on October 27-28 is the next macro test.
My take
Treasury accumulation is a real tailwind, but it is one input among many. I would treat it as a supportive floor, keep size modest, and wait for price to confirm above $82,538 before leaning bullish.
Share your own view below: does steady corporate buying change your outlook, and which level are you watching.