Square
Following
Hot
News
Profile
Share your thoughts
placeholder
Article
$XTIUSD has gone in too heavily; as long as it doesn't retest the bottom, take profit around 95, set the stop-loss at 91.85, and add again below 91.3.
post-image
XTIUSD-0.95%
I was wolfing down lunch when a message from a buddy popped up on my phone: What happened to that ADA in your group? It’s made it onto the biggest losers list.
I took a look: 0.2351, down 7.3 points in a day.
To be honest, I’ve known this coin for so long I’ve almost lost all feeling for it. Back then, people called it the “Ethereum killer” more often than my mom nagged me. But these past few years, it’s just been putting on a flatlining performance, and you don’t even know what serious narrative it has left now. Today it made the unusual-movers list, but volume didn’t really pick up—it just k
post-image
ADA-6.42%
$MET 24 hours -5.69%, but what is most worth debating now is not the gain or loss, but which of the 1-hour and 4-hour charts is misleading. I would rather lay out the bear-case arguments first.
The bears see the risk of breaking below 0.4228, while the bulls need to prove that buyers remain after breaking above 0.5468. Current volume is 0.37x.
The current price is 0.4323, about 2.20% from the 1-hour support at 0.4228 and about 26.49% from the resistance at 0.5468. The position determines which side is more urgent, with the next level to watch shifting to 0.2857.
Waiting for the boundaries to p
post-image
MET-1.81%
BTC/USDT MARKET UPDATE: IS BITCOIN PREPARING FOR A STRONG BOUNCE?
Bitcoin is showing an interesting price movement on the 4-hour chart! At the time of this snapshot, BTC is trading around $82,513, after experiencing a sharp decline from the $85,000–$86,000 region toward a recent low of approximately $80,397.
📊 Key Technical Levels to Watch
🔹 Current Price: $82,513
🔹 Immediate Resistance: $82,881
🔹 Major Resistance: $83,816
🔹 Strong Resistance Zone: $85,868–$87,513
🔹 Immediate Support: $81,875
🔹 Major Support: $80,397–$80,935
📉 What Is the Chart Telling Us?
Bitcoin recently faced stron
post-image
BTC-0.62%
$NEAR The most concerning thing is not whether the price rises or falls, but that after the price moved for a while, participation failed to keep up.
This time, I’m not looking at the gainers and losers list, only the levels. The current price is 4.76, about 9.64% above the 1-hour support at 4.301 and about 17.54% below the resistance at 5.595.
My criteria are simple: only a breakout above 5.595 followed by continuation would count as follow-through from higher levels; a break below 4.301 invalidates the original assessment. The 1-hour and 4-hour outlooks are both weak, with RSI at 40 and 41,
post-image
$LIT Recovery structure ... next target 4.30
LIT is showing a solid recovery trend after rebounding from the 3.49 low, with buyers now pushing the price back above 3.70. Next price: 3.75 Next target: 4.00 Extended target: 4.30 Key support: 3.30 As long as 3.30 holds, I believe the broader recovery structure will remain valid, with targets still pointing toward 4.00–4.30. A clean break above 3.75–3.80 would be the first strong confirmation that buyers are back in control. Trading at $LIT
post-image
LIT+2.67%
Go long on this move around $JTO
. Entry: 0.5171 - 0.5247Target range: 0.5460 / 0.566Stop-loss: 0.5016JTO longs have rebounded strongly from the bottom and are gathering momentum to reclaim the range! Note: If the 15-minute chart cannot hold MA7, it may retest the 0.50 support level. Don’t go all-in, guys. Position size should be determined based on your own account situation. Looks like the time has come.👇👇👇Today’s focus: $RLC and $ETH .
post-image
JTO-6.58%
RLC+27.96%
ETH-3.12%
Many people directly equate “the price has fallen” with “the trend has turned bearish,” which is the most common misconception in technical analysis. Whether a drop to the moving average is a breakdown or a pullback depends on the structure, not the magnitude of the decline itself.
$JTO Current price 0.5271, down 6.72% over 24h, but the structure has not deteriorated. MA5=0.52126 has crossed upward to sit just below MA20=0.527485, and the price is currently caught between MA20 and MA5, representing a typical moving-average entanglement rather than a bearish alignment. The MACD histogram remai
post-image
JTO-6.58%
ENA-3.18%
UNI-5.03%
ETH rose 0.91% over a 15-minute window, representing a technical rebound after the previous pullback, driven by a recovery from oversold conditions. However, it lacks a clear event catalyst, while sell orders dominate the order book and liquidity remains thin, limiting the gain. ETH is down 3.71% over 24 hours and 8.48% over 7 days, with the medium-term outlook still weak. The sustainability of the rebound remains to be confirmed by trading volume and buying pressure.
post-image
ETH-3.12%
[ NEW STREAMER ] BTC AND ETH
live-cover
LIVE1,548
$SUI After breaking below the moving averages, can it still hold up in the short term?
Conclusion first: The technical picture has weakened; the rebound favors shorts rather than longs, and 1.0561 looks more like a continuation point in the decline than a bottom.
$SUI The current price is 1.0561, down 7.06% over 24h, with a trading volume of 112.7M USDT, indicating a high-volume sell-off. In terms of the moving-average structure, the price has fallen below MA5 and MA10, with MA5 beginning to cross below MA10 to form a short-term death cross. MA20 has turned downward after flattening, breaking
post-image
SUI-5.86%
ME-3.09%
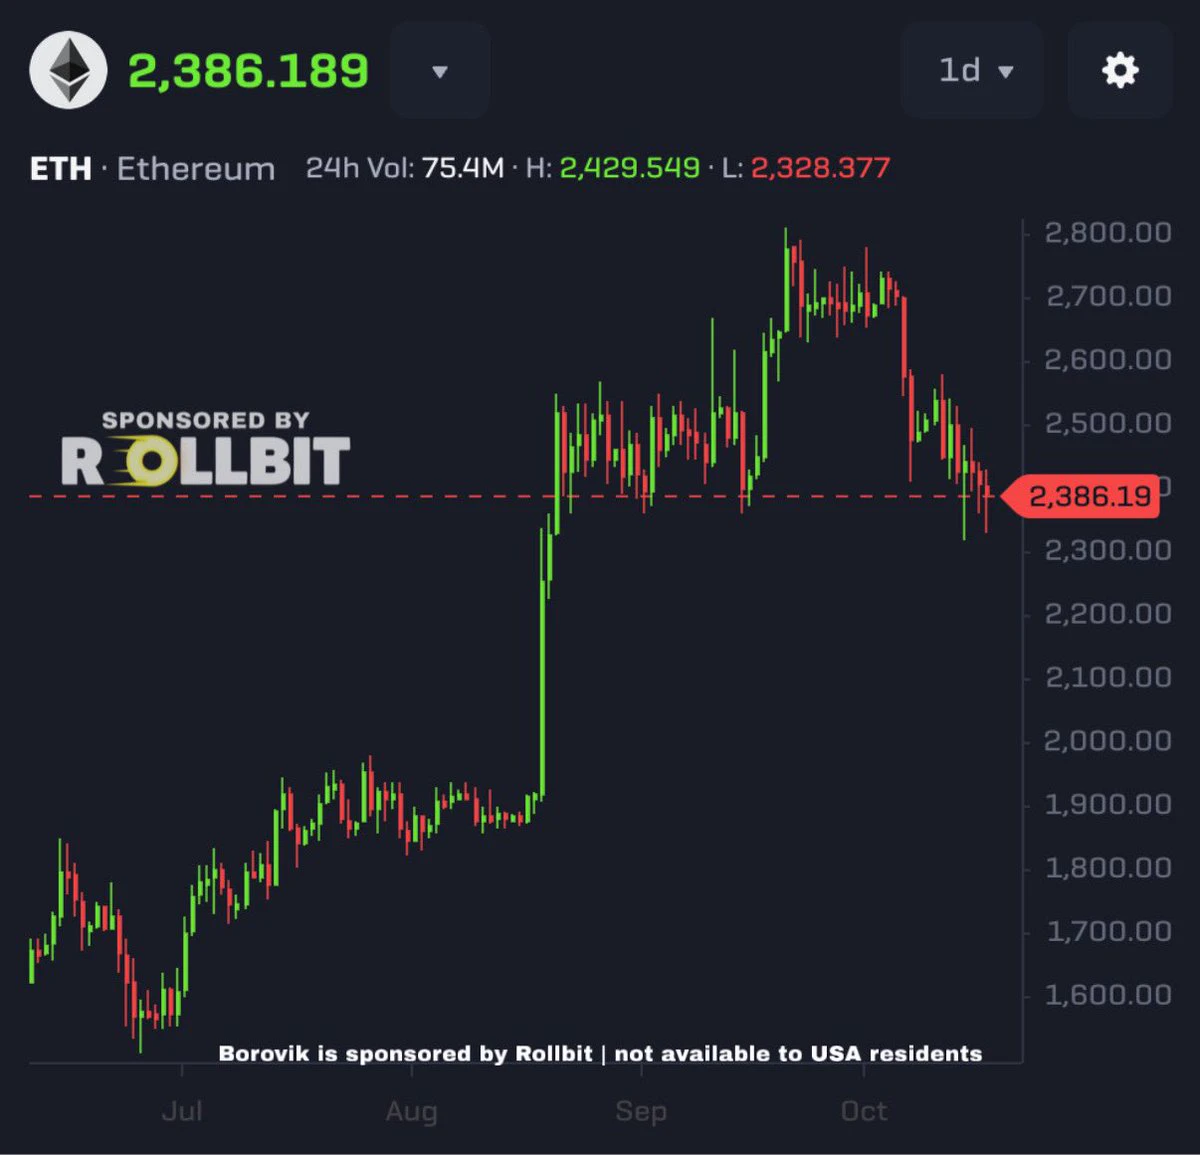
This cycle’s key market focus is whether ETH can break below the 2400 level. There is some possibility of a breakdown, but market consensus does not favor a sustained deep decline.
2300 and 2200 would be low-probability black swan scenarios; if triggered, the potential returns would be huge. Overall, the expectation is for a pulse-like correction, with limited expectations of a one-sided plunge and range-bound trading as the main scenario.
post-image
ETH-3.12%
#BTC回调触及81000美元
BTC Retests $81,000: A Rebound Is Here, but a Bottom Still Needs Proof
Bitcoin pulling back from around $87,000 to briefly touch $81,000, followed by a recovery toward $82,000, creates an important decision point. My view is that the rebound deserves attention, but it does not yet settle the debate between a temporary recovery and a lasting bottom. A market can bounce because sellers pause, short positions close, or buyers begin testing support. Those forces do not all produce the same outcome. What matters next is whether buyers can defend the recovery when selling pressure r
GateSquare
📉 BTC retests $81,000, rebound underway—is the bottom in?
Just a few days ago, the market was still discussing 90K, but BTC quickly pulled back from around 87K, briefly touching $81,000 before rebounding to around 82K.
The market rhythm has suddenly changed, and the divide between bulls and bears is becoming increasingly apparent.
Some believe the area around 81K is an opportunity to build positions in a new round, while others worry this is merely a brief rebound amid a downtrend.
Several key questions now deserve attention:
📊 Can the 81K support hold, or will 80K be tested next?
💰 After outflows from spot BTC ETFs, can buying demand return?
🏦 With the Fed remaining hawkish and CPI due to be released soon, will macro pressure continue to affect the market?
Bring #BTC回调触及81000美元 to Gate Square to share your market outlook, trading strategy, or position review.
Whether you are bottom-fishing, waiting on the sidelines, or reducing your position, you are welcome to share your reasoning.
👉 https://www.gate.com/post
  • 2
  • 1
$ETH
This volatility is as tight as an old lady’s foot-binding cloth; Ethereum should shoot upward within a day or two. The structure is exactly the same as BTC’s. With the ABC move complete, whether it’s a genuine or false breakout, stick to a bullish bias and wait for confirmation before taking action. 😏
post-image
ETH-3.12%
BTC-0.62%
#BTC回调触及81000美元
BTC Retests $81,000: A Rebound Is Here, but a Bottom Still Needs Proof
Bitcoin pulling back from around $87,000 to briefly touch $81,000, followed by a recovery toward $82,000, creates an important decision point. My view is that the rebound deserves attention, but it does not yet settle the debate between a temporary recovery and a lasting bottom. A market can bounce because sellers pause, short positions close, or buyers begin testing support. Those forces do not all produce the same outcome. What matters next is whether buyers can defend the recovery when selling pressure r
GateSquare
📉 BTC retests $81,000, rebound underway—is the bottom in?
Just a few days ago, the market was still discussing 90K, but BTC quickly pulled back from around 87K, briefly touching $81,000 before rebounding to around 82K.
The market rhythm has suddenly changed, and the divide between bulls and bears is becoming increasingly apparent.
Some believe the area around 81K is an opportunity to build positions in a new round, while others worry this is merely a brief rebound amid a downtrend.
Several key questions now deserve attention:
📊 Can the 81K support hold, or will 80K be tested next?
💰 After outflows from spot BTC ETFs, can buying demand return?
🏦 With the Fed remaining hawkish and CPI due to be released soon, will macro pressure continue to affect the market?
Bring #BTC回调触及81000美元 to Gate Square to share your market outlook, trading strategy, or position review.
Whether you are bottom-fishing, waiting on the sidelines, or reducing your position, you are welcome to share your reasoning.
👉 https://www.gate.com/post
$OGN revealing its origins to be very rich, ultra giga rich
post-image
OGN+98.00%
I laughed when I came across a piece of news while scrolling over lunch.
Netflix is making an eight-episode series, with the protagonist based on SBF, the guy behind FTX. Even the title is pretty savage. A scammer’s story is being turned into a hit show—how surreal is that?
What does $STRK have to do with it? Not a damn thing. People in the industry are just watching the spectacle and adding fuel to the emotional fire.
$STRK is a serious L2 project doing real tech in the zk space, while the top spots on the trending charts are usually occupied by memes and this kind of gossip. Yet today it q
post-image
STRK+39.81%
  • 1
$DOT is showing strong bullish momentum pumping over +6.77% to reach $1.1641! 
Key Metrics:
• 24h High: $1.1659
• 24h Low: $1.0095
• 24h Volume: 9.68M DOT ($10.57M USDT) 
Big catalyst behind the move Polkadot has officially announced its new native stablecoin, dotUSD! 
With strong buying volume pushing prices up from the $1.08 support level the charts are looking very lively. 
Are you holding $DOT or trading this breakout? Let us know your price targets below! #BTCPullsBackTo81000 #CEXandDEXFundingRatesTurnNegative
post-image
DOT+5.54%
  • 1
$GEOD buy geod for mod to long term.
strong fundamental project with real revenue and demand.
buy and hold or put it in the Smart Rebalance bot until the market kicks off again.
GEOD+0.47%
  • 1
crypto market update
live-cover
LIVE2,023
Load More

Join 40 M users in our growing community

⚡️ Join 40 M users in the crypto craze discussion

💬 Engage with your favorite top creators

👍 See what interests you

Trending Topics

GateAtTOKEN2049

35.27k Views20.81k Discussing

Gate brought a series of major events to TOKEN2049 Singapore! From the official launch of Gate Money to the F1 Red Bull driver meet-and-greet and the Gate Gala, we witnessed a new chapter of "One Gate, Borderless Finance." Which moment from TOKEN2049 stood out most to you?

BTC Pulls Back to 81000

25.42k Views35.7k Discussing

AIStocksFallALABDropsOver9%

24.66k Views554 Discussing

View More