Square
Following
Hot
News
Notifications
Profile
Share your thoughts
placeholder
Article
🏆 Gate ranks among the global top three—giveaway time! 🎁
According to DeFiLlama (November 9), Gate ranks 3rd among global CEXs, with $40.66 million in 24-hour net inflows.
Let’s celebrate together 💙
🎁 3 winners × 5 USDT
Join now 👇
✅ Follow @Gate_Livezh and @Gate__Live
❤️ Like + repost
💬 What recent win are you proud of? Share below! 🏆
📊 Source:

‍#GateLive #Gate

GateLive
🏆 Gate hits the global Top 3 — giveaway time! 🎁
Per DeFiLlama (Nov 9), Gate ranked 3rd globally among CEXs, with $40.66M in 24-hour net inflows.
Let's celebrate 💙
🎁 3 winners × 5 USDT
Join in 👇
✅ Follow @Gate_Livezh & @Gate__Live
❤️ Like + Repost
💬 What's a recent win you're proud of? Share it below! 🏆
📊 Source:
https://www.odaily.news/zh-CN/newsflash/532275
‍#GateLive #Gate
repost-content-media
What Is the Brier Score? How Can Mathematical Methods Evaluate the Quality of a Trading Model’s Probability Predictions?

In crypto quantitative trading, even if a model often correctly predicts whether prices will rise or fall, that does not mean the probabilities it gives are reliable. For example, if a model predicts a 90% chance that BTC will rise, but prices rise only 60% of the time after similar predictions, it may be overconfident. The Brier score can help us evaluate the error between probability predictions and actual outcomes.

First, what is the Brier score?

For binary predictions
post-image
BTC-0.67%
Trenches
PIEVERSE
P
bade
b
PIEVERSE
0x0e...25a9
Market Cap
$.
Change
.
24h Vol
$.
Holders
.
牛逼
牛
bade
b
牛逼
0x96...7777
Market Cap
$.
Change
.
24h Vol
$.
Holders
.
ON
O
bade
b
ON
0x0e...1d48
Market Cap
$.
Change
.
24h Vol
$.
Holders
.
STONK
S
bade
b
STONK
6GmA...UNgx
Market Cap
$.
Change
.
24h Vol
$.
Holders
.
FLOAT
F
bade
b
FLOAT
Bv1a...BMmr
Market Cap
$.
Change
.
24h Vol
$.
Holders
.
Bank, are you going to ruin me too?! I only went all-in with half, and now everything’s frozen across the board!
Diplomatic momentum has returned to the forefront of US-Iran negotiations. Contacts facilitated by Qatar, combined with statements from President Trump regarding an end to the conflict, have boosted risk appetite in global markets, leading to divergent trends across commodities and crypto assets. However, the gap between market pricing and the uncertainties on the ground is prompting investors to maintain a cautious stance.

Diplomatic Developments and Oil Prices

Reports suggest that Qatar and Pakistan have put forward a mediation proposal—which both sides have reportedly received favorably
post-image
BTC-0.67%
BZ-1.18%
CL-1.83%
NAS100-0.07%
SPX500+0.19%
$ARIA Thanks, I couldn't hold on anymore, so I closed out my position and got out. Love you (ღ˘⌣˘ღ), you helped me make some money
post-image
ARIA+22.03%
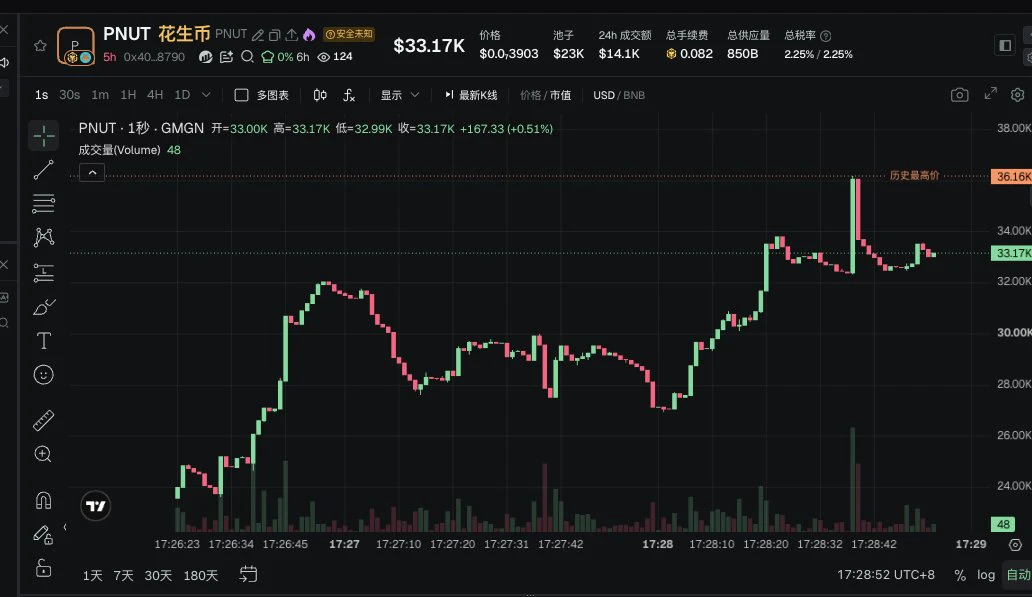
What are we trading, what are we trading?
Are we in the meme agent archaeology phase now?
How come Neiro and PNUT have both shot up?
What are you guys going after next???
post-image
MEME-0.94%
NEIRO-1.64%
PNUT-1.27%
[ NEW STREAMER ]CRYPTO MARKET
live-cover
LIVE1,930
What Are ROC Curves and AUC? How Can You Tell Whether a Price Direction Prediction Model Can Truly Distinguish Between Outcomes?

In crypto quantitative trading, you can’t judge whether a model is effective by accuracy alone. Suppose BTC spends most of its time without a major rise. A model that always predicts a decline might still achieve seemingly good accuracy, yet fail to identify genuine opportunities to go long. ROC curves and AUC can help us assess a model’s ability to distinguish between different outcomes.

First, what is an ROC curve?

An ROC curve compares the true positive rate wi
post-image
BTC-0.67%
What Are ROC Curves and AUC? How Can You Tell Whether a Price-Movement Prediction Model Can Truly Distinguish Outcomes?

In crypto quantitative trading, a model’s effectiveness cannot be judged by accuracy alone. Suppose BTC does not make a sharp move upward most of the time. A model that always predicts a decline might achieve seemingly good accuracy, yet fail to identify genuine opportunities to buy. ROC curves and AUC can help us evaluate a model’s ability to distinguish between different outcomes.

First, what is an ROC curve?

An ROC curve compares the true positive rate with the false po
post-image
BTC-0.67%
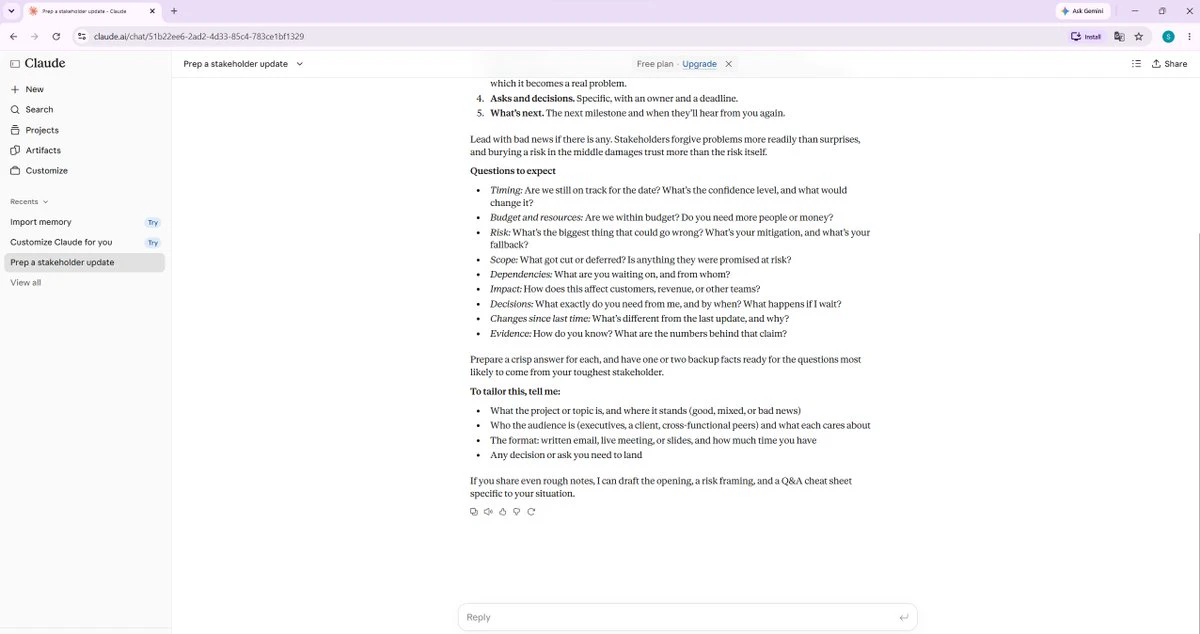
Setting up my third Claude account—every click makes my heart race. A bad boy like A÷ really is so easy to love and hate.
post-image
📢 Gate Live Tonight’s Livestream Preview | November 10

Tonight’s focus: U.S. October CPI! Will inflation data reshape rate-cut expectations?
After BTC fell to $73k, which price levels are worth watching?

Multiple hosts take turns discussing everything from the Nvidia turmoil and BTC’s price action to how to catch market cycles in spot trading.
Join Gate Live every night to discuss the market and watch key levels!

🔥 Watch now https://www.gate.com/live
post-image
BTC-0.67%
NVDA-4.34%
  • 5
  • 1
BTC | ETH | Gold | Crude Oil
live-cover
LIVE3,851
What Is the Brier Score? How Can the Quality of a Trading Model’s Probability Forecasts Be Evaluated Mathematically?

In cryptocurrency quantitative trading, even a model that often correctly predicts the direction of price movements does not necessarily provide reliable probabilities. For example, if a model predicts a 90% probability that BTC will rise, but the price rises only 60% of the time in similar cases, it may be overconfident. The Brier score can help us evaluate the error between probability forecasts and actual outcomes.

First, what is the Brier score?

For binary predictions, th
post-image
BTC-0.67%
Trump Media Reports $409.7M Q3 Profit, Driven by Digital Assets

Trump Media & Technology Group reported a net profit of $409.7 million for the third quarter of 2026, with digital asset gains playing a major role.

The company recorded approximately $378.1 million in digital asset gains, highlighting how crypto holdings can significantly influence corporate financial results.

However, the headline profit needs context. Revenue was just $3 million, while adjusted EBITDA showed a loss of $12.3 million.

This shows the growing impact of digital assets on corporate balance sheets, but also th
📈 AI tech stocks rebound strongly—who will lead the next wave?
Last week, AI tech stocks experienced sharp volatility, with popular stocks such as $NVDA and $AMD rebounding after steep pullbacks.
Will the rebound continue, or will they pull back again?

💬 Let's hear your take today:
If you had to pick one AI tech stock now, which one would you bet on? Share your pick and why you like it.

🌟 Gate Square's Stock Chat Season is underway
Three outstanding authors are selected daily, each receiving 5 USDT plus an official featured spot to give your investment insights more exposure.

Post your
GateSquare
📈 AI tech stocks rebound strongly—who will lead the next wave?
Last week, AI tech stocks experienced sharp volatility, with popular stocks such as $NVDA and $AMD rebounding after steep pullbacks.
Will the rebound continue, or will they pull back again?

💬 Let's hear your take today:
If you had to pick one AI tech stock now, which one would you bet on? Share your pick and why you like it.

🌟 Gate Square's Stock Chat Season is underway
Three outstanding authors are selected daily, each receiving 5 USDT plus an official featured spot to give your investment insights more exposure.

Post your original views with #Gate股票畅聊季 and share your market take👇
👉 Sign up now:
https://www.gate.com/campaigns/6898
repost-content-media
NVDA-4.34%
AMD+13.35%
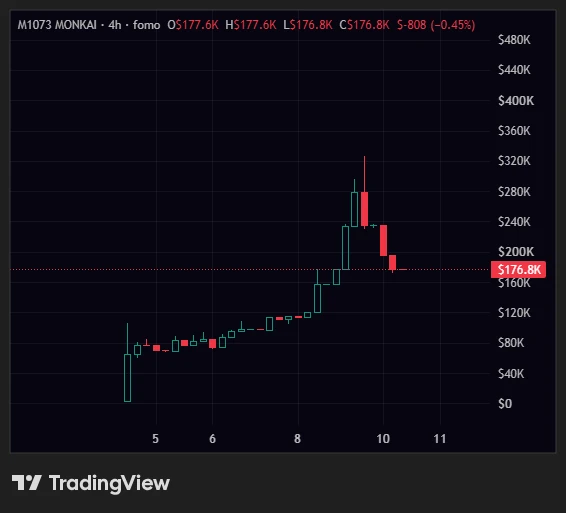
How the f are people still fading $MONKAI at these levels?
We're still VERY early and this might be the last free entry before the real move starts
$1M MC is an easy target here, don't be left watching from the sidelines when it sends
post-image
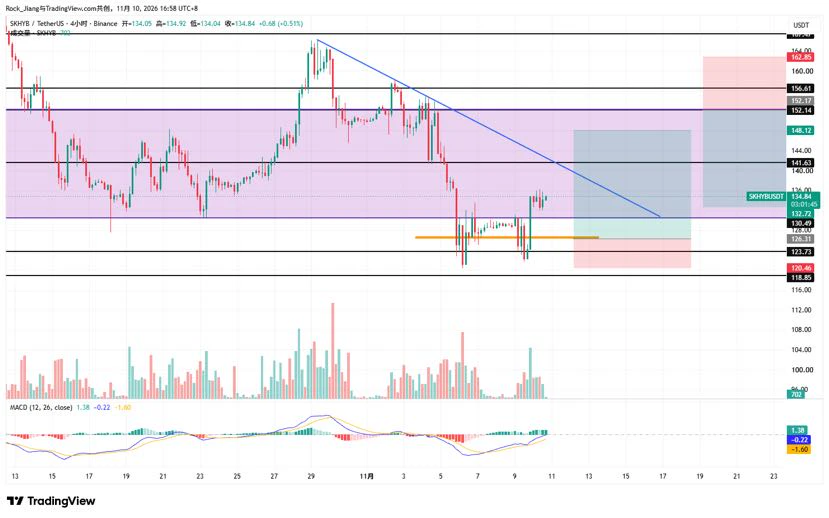
Nov. 10, Tuesday Market Overview: SKHY (SK Hynix) Returns to the Trading Range

After SKHY on the Korean stock market plunged and triggered a circuit breaker a few days ago, it surged enough to trigger one again today. Korean investors are experiencing both extremes—their roller-coaster ride is quite exhilarating.

SKHY retested support at 123.73 several times, forming a small W-bottom pattern before rebounding back into the 130.49-152.14 trading range

130.49 resistance has turned into support—a resistance/support flip. A retest can be an opportunity to enter a small long position

14
post-image
SKHY+0.86%
  • 1
Global stock markets suddenly bounce back! The pullback in oil prices is just the trigger—the real drama may only just be beginning

If financial markets were a TV series, the past few days would definitely count as a plot-twist episode.
Geopolitical risks had been mounting, compounded by a correction in tech stocks, and market sentiment had turned gloomy. Just as many investors were getting ready to throw in the towel, signs of easing tensions emerged, oil prices fell, and global stock markets quickly rebounded.
U.S. stocks surged on November 9, with the S&P 500 up about 2.3% and the Nasdaq u
SNDK+6.27%
  • 13
$PUMP is showing signs of a potential bullish recovery on the 1H chart. Buyers are attempting to build momentum, and holding the key support zone will be important for further upside.

Key Figures

Entry Zone: $0.003538 – $0.003559

TP1: $0.003670

TP2: $0.003688

Final TP: $0.003722

Stop Loss: $0.003431

RSI: 46

Funding Rate: +0.005%

Market Outlook:

As long as $PUMP stays above $0.003431, the bullish structure remains intact. A sustained move higher could open the door toward the next resistance levels around $0.003670–$0.003722.

However, losing the support zone could weaken the recover
post-image
PUMP-1.06%
A 5% jump does not, by itself, constitute a trend.

The sharp rise in the KOSPI, which exceeded 5%, was driven primarily by Samsung and SK Hynix. From the perspective of an individual investor, I do not view this move as the beginning of a trend.

Data flows originating from the U.S. and various geopolitical developments remain unclear. In the current climate, it is wiser to maintain a cautious approach and wait for the markets to settle. On days like these, the costliest mistake one can make is to increase one’s position out of fear of missing out on a single day’s rally. While this surge o
post-image
SK Hynix+6.69%
Load More

Join 40 M users in our growing community

⚡️ Join 40 M users in the crypto craze discussion

💬 Engage with your favorite top creators

👍 See what interests you

Trending Topics

GateGlobalComplianceExpansion

24.88k Views194 Discussing

Gate continues to expand its global compliance footprint, now covering 81 regulated jurisdictions across Europe, North America, Asia, and Oceania. From MiCA and U.S. state-level MTLs to Japan’s FSA, Dubai, and Australia-related regulatory approvals, global exchanges are entering a new stage of compliance competition. Do you think regulatory strength will become as important as products and liquidity for exchanges in the future?

USCPIDataIncoming

53.79k Views2.28k Discussing

USIranTalksShowNewProgress

9.49k Views1.29k Discussing

View More