







Square
Following
Hot
News
Profile
Share your thoughts
placeholder
Article
Do you think clicking “Confirm” once in your wallet is just to complete a transaction?
In DeFi, you may also be granting a smart contract permission to use your tokens, and that permission doesn’t necessarily disappear automatically after the transaction ends.
Before each approval, check three things:
🔹 Is the contract you’re approving official?
🔹 Does the allowance exceed what you actually need?
🔹 Does this permission still need to remain after the transaction is complete?
An unlimited approval doesn’t mean your assets will definitely be stolen, but if the approved contract runs into troub
post-image
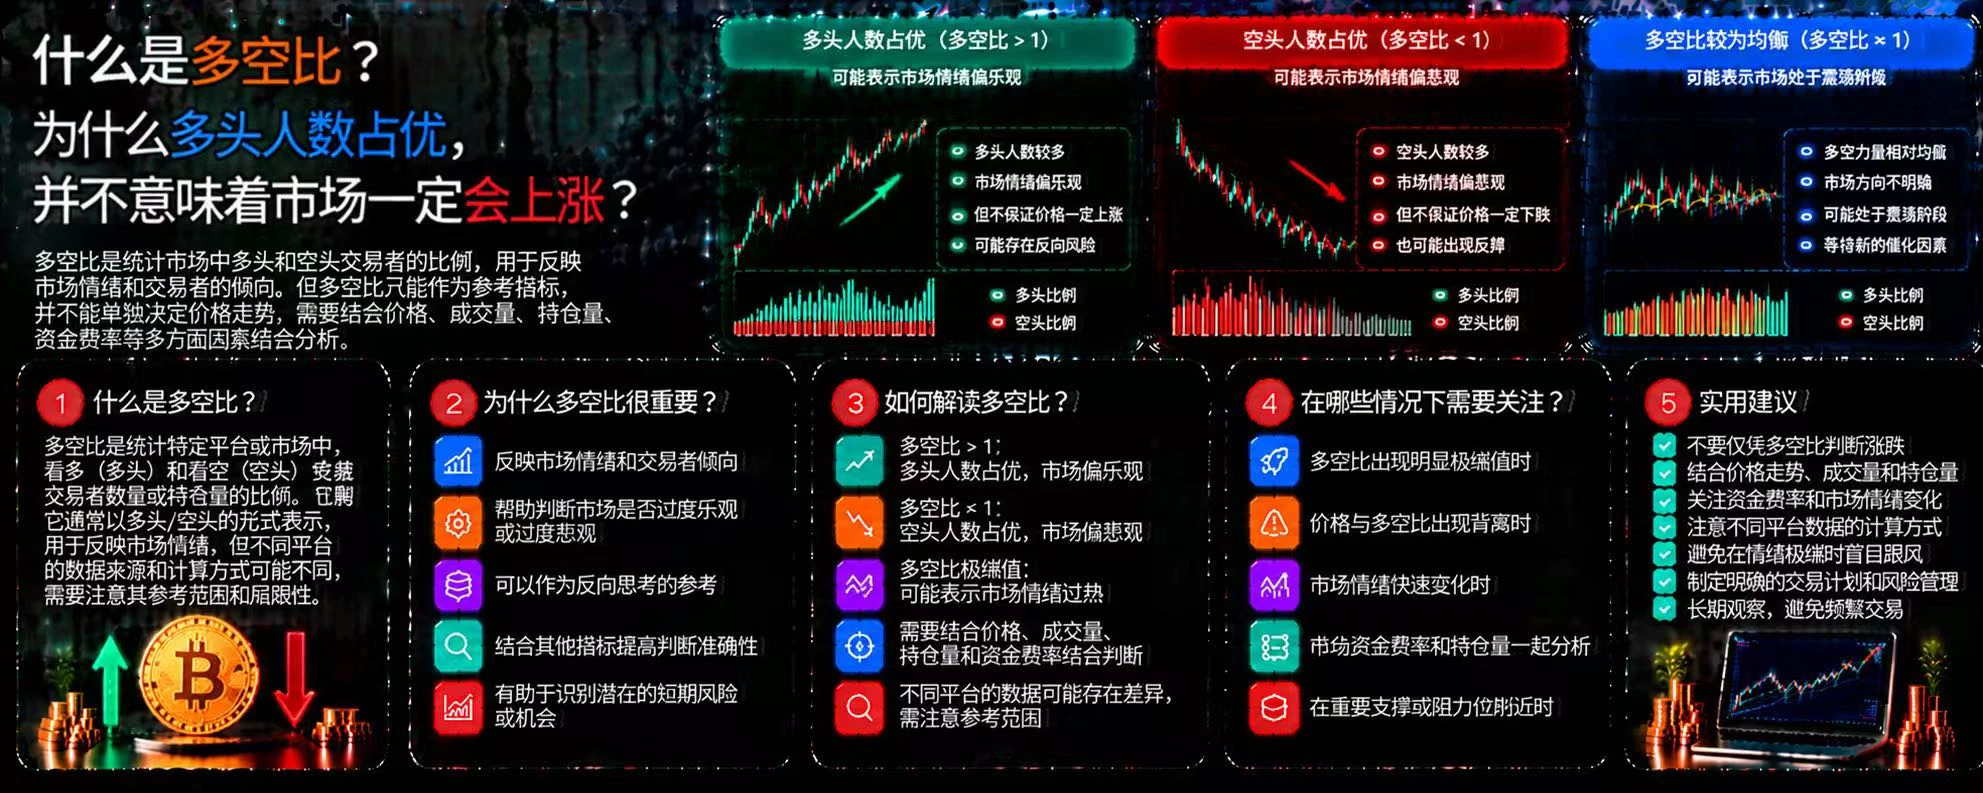
What Is the Long-Short Ratio? Why Doesn’t a Majority of Traders Being Long Mean the Market Will Definitely Rise?
In crypto trading, many people see the long-short ratio rise and assume bullish sentiment is strengthening, then choose to chase long positions. But market sentiment and actual price movements do not always align. The long-short ratio can help us understand traders’ positioning bias, but it cannot directly determine how the market will move next.
First, what is the long-short ratio?
The long-short ratio measures the relative proportion of longs to shorts in a given market. However,
post-image
Trenches
ZIG
Z
bade
b
ZIG
0x8c...1145
Market Cap
$.
Change
.
24h Vol
$.
Holders
.
BTC
B
bade
b
BTC
C5xp...pump
Market Cap
$.
Change
.
24h Vol
$.
Holders
.
HIGH
H
bade
b
HIGH
7ymF...high
Market Cap
$.
Change
.
24h Vol
$.
Holders
.
STONK
S
bade
b
STONK
6GmA...UNgx
Market Cap
$.
Change
.
24h Vol
$.
Holders
.
CORLA
C
bade
b
CORLA
0xba...7777
Market Cap
$.
Change
.
24h Vol
$.
Holders
.
$JCT After continuing to fall on rising volume, the latest pump looks like an obvious bull trap, with a further sharp decline highly likely.
post-image
JCT-3.26%
Democrats sweep both chambers, the dollar falls to a five-week low of 101.4, and gold rallies from 3946 to 4147 in two days, +$200.
At 4133, price is above the daily MA20 (4075), but the EMA50 (4158) is still capping it: today's high was 4146.99, stopping $11 short. This is a recovery, not confirmed reversal.
Only two moves: go long on a pullback to 4110–4118, with a stop at 4092; or wait for a 1h close above 4158 before following. Price is caught in the middle right now, so no trade.
Nonfarm payrolls tomorrow at 21:30. Don't hold positions through the data.
#黄金 #觉照交易法 #XAUUSD
post-image
XAU+0.38%
XAUUSD+1.58%
The market has been pretty volatile these past few days. Are you all doing okay?
post-image
Timeline cleanse.
You’re welcome.
post-image
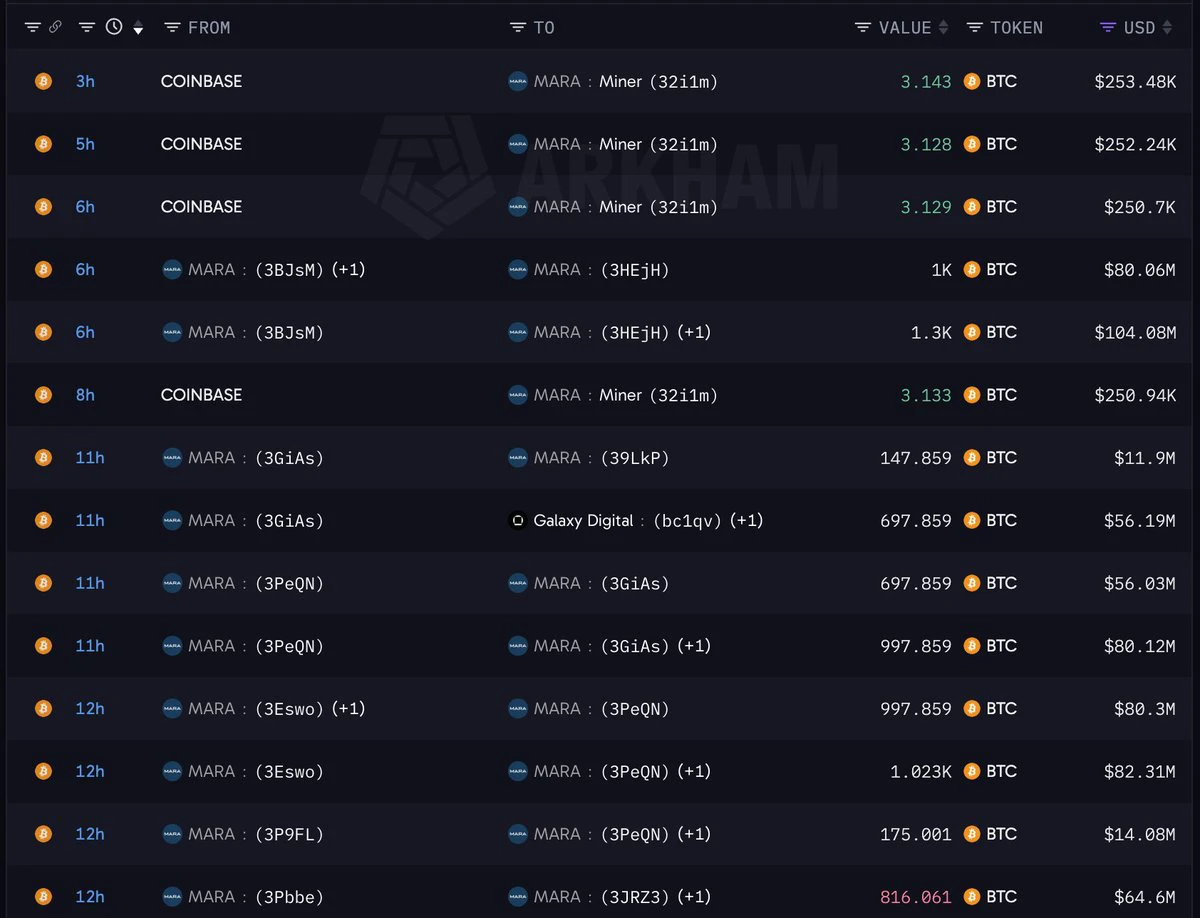
🚨 MARA MOVES $132.8M IN BITCOIN!
Bitcoin miner MARA has transferred 1,650 $BTC | $132.8M to Galaxy Digital, Copper, and other platforms in the last 12 hours.
After this big transfer, the fear of another round of selling in the market has increased..
post-image
MARA-4.24%
BTC-0.67%
GLXY-16.94%
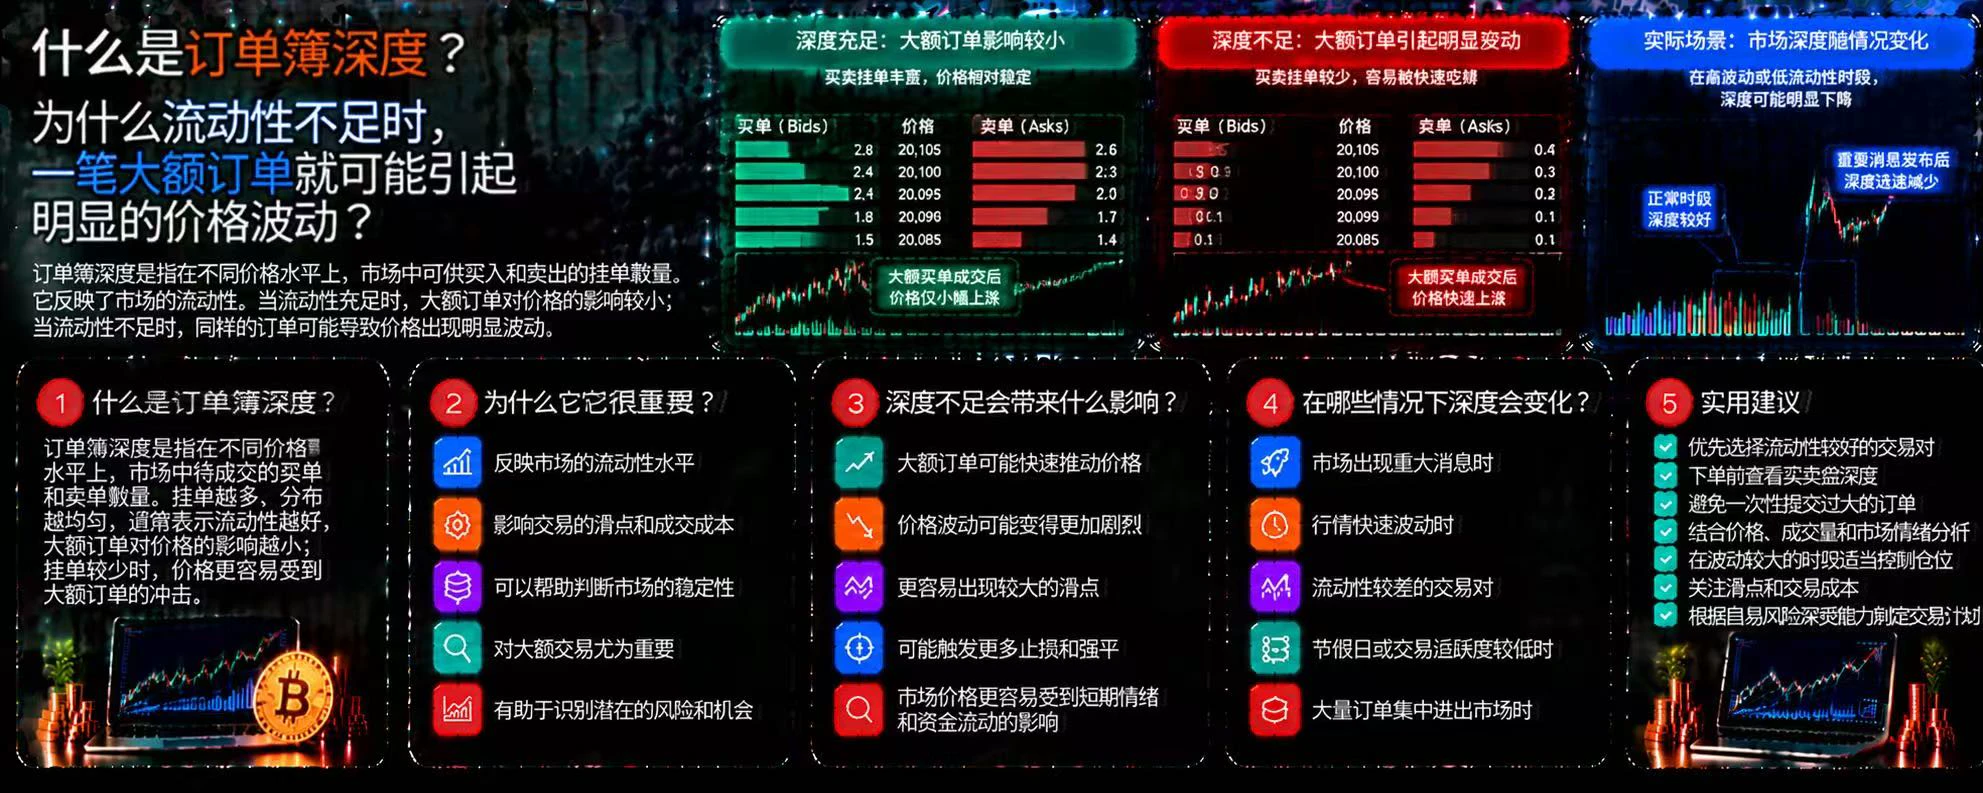
What is order book depth? Why can a large order cause significant price fluctuations when liquidity is insufficient?
In cryptocurrency trading, orders of the same size can produce completely different execution results under different market conditions. Sometimes, a large order enters the market without noticeably moving the price; at other times, a single order can drive the price sharply up or down. One key factor behind this is order book depth.
First, what is order book depth?
The order book displays limit buy and sell orders submitted by traders at different prices. Order book depth refle
post-image
$DOT
Declining volume needs to be viewed from both sides—some are quietly accumulating, while others are already keeping vigil at the funeral home.
Take $OK: after dipping as low as around $106, it somehow managed to hold steady, with trading volume shrinking like a bone that’s been chewed on. Experienced traders recognize this pattern at a glance: the big players are nearing the end of their shakeout, and the weak hands that were going to leave have already done so.
Now look at the “partners in misery,” $DOT and $AD —the picture is completely different.
$DOT sports a $1.6 billion market cap
post-image
DOT-1.51%
ADA-1.48%
[New Streamer] Market Prediction ABout BTC
live-cover
LIVE3,077
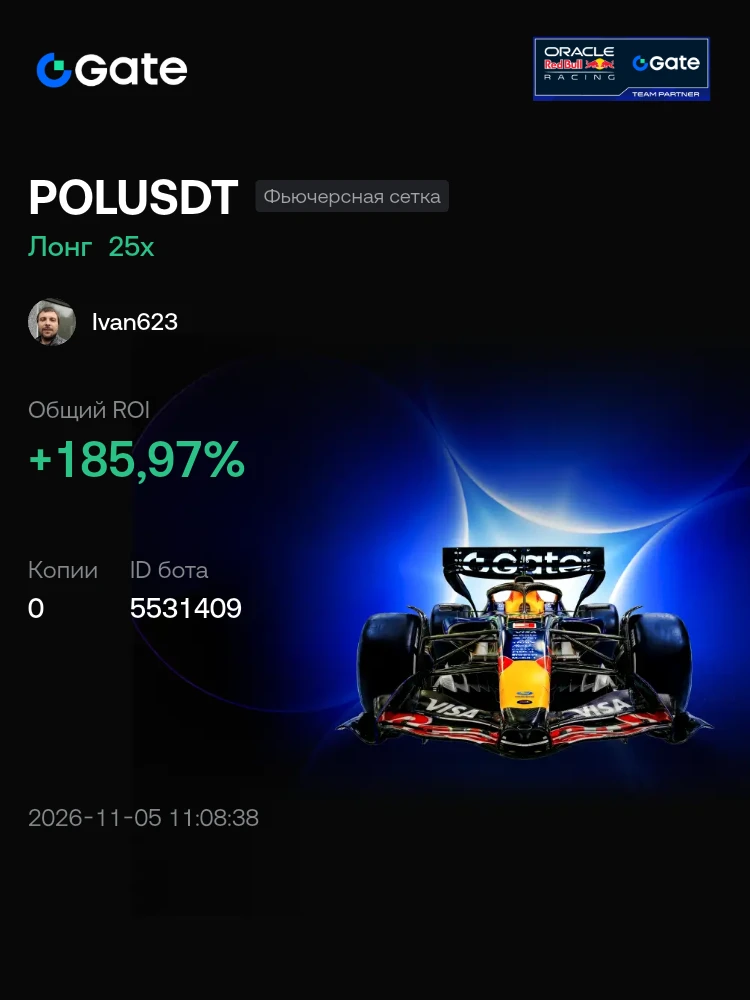
#Боты I’m trading POLUSDT with a Futures Grid bot on Gate. Join me!
post-image
November 5 pending orders
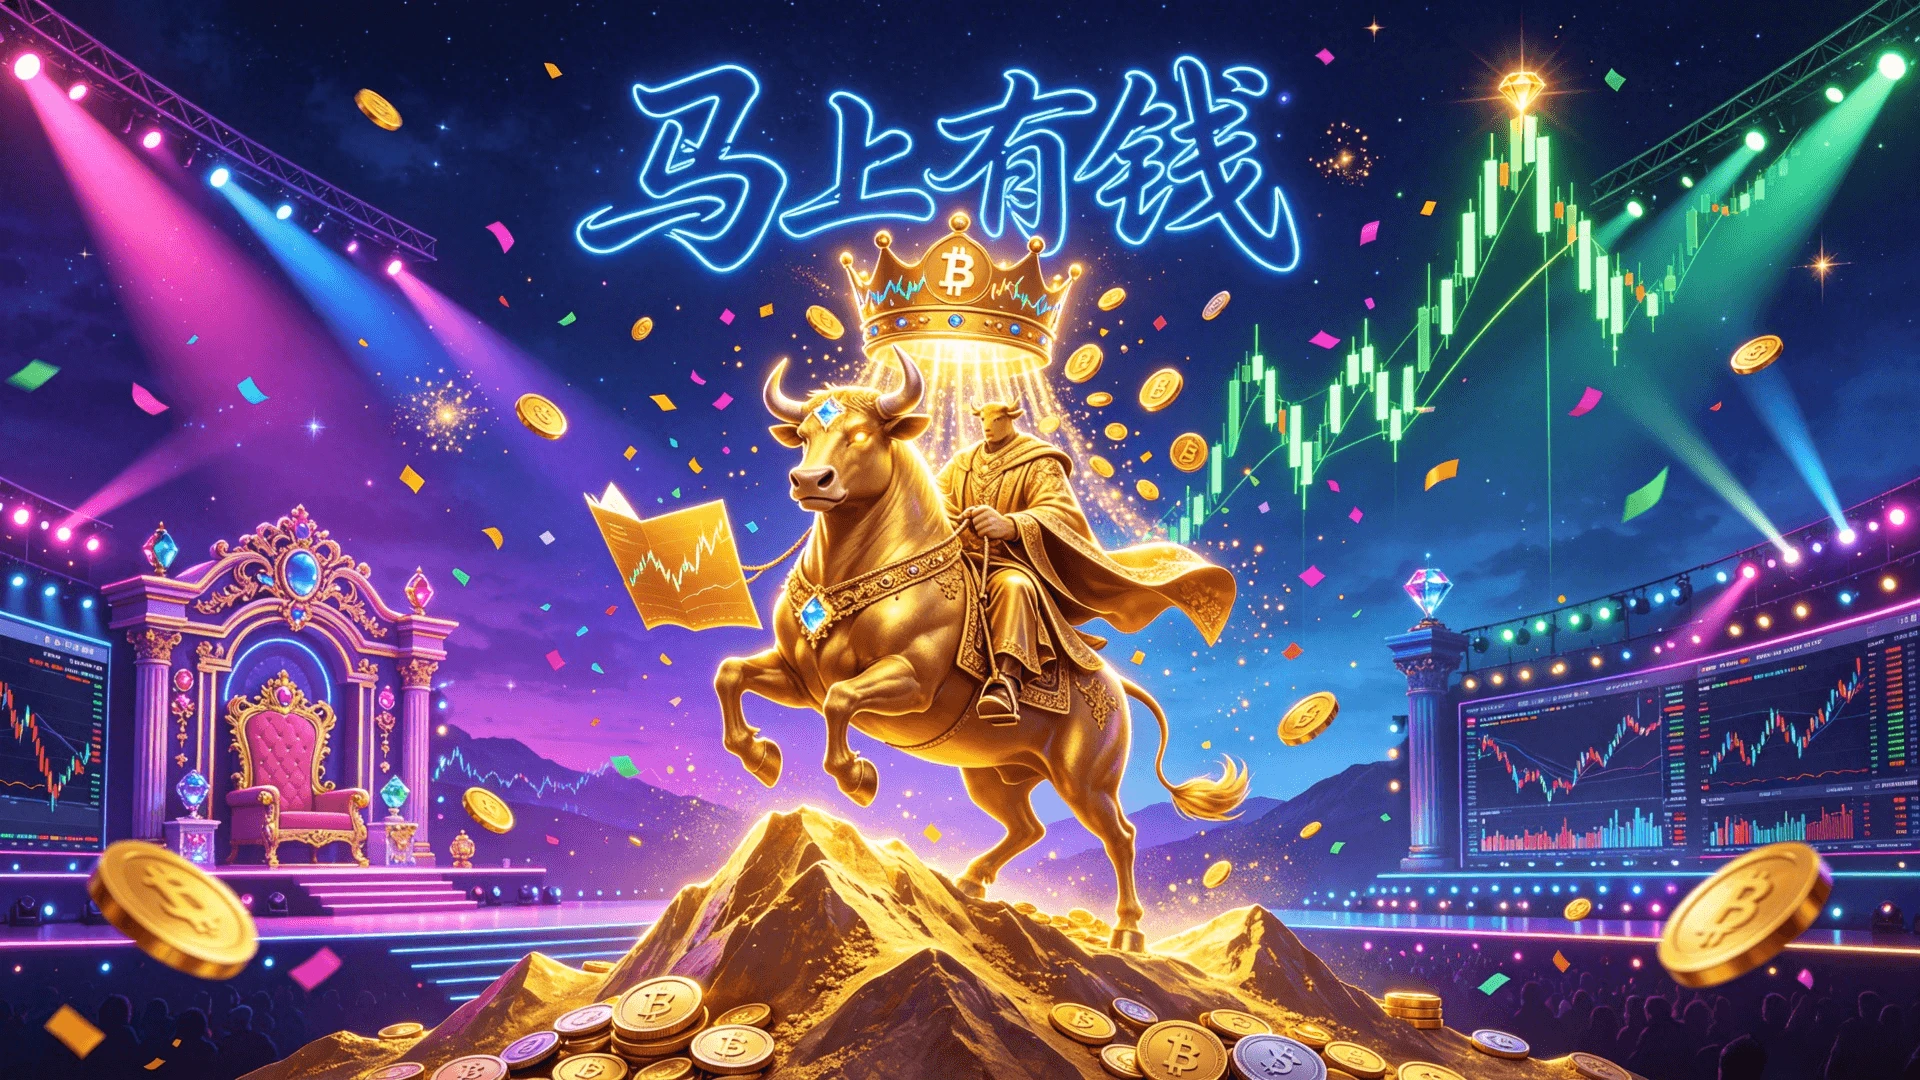
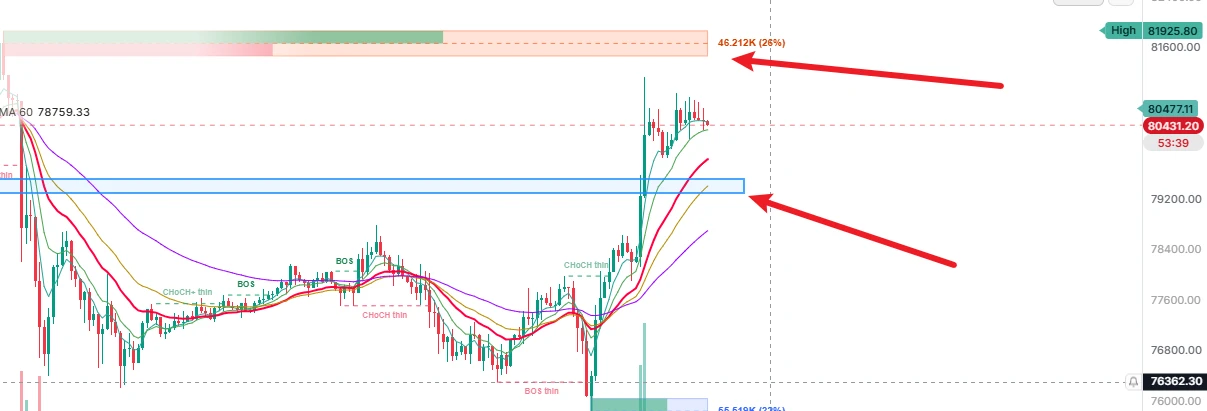
BTC: Go long near 79,300; add at 78,500. Targets: 80,300–81,500. Stop-loss: 78,100.
BTC: Go short near 81,700; add at 82,500. Targets: 80,700–79,500. Stop-loss: 82,900.
Keep an eye on the market for short-term entries. You are responsible for your own profits and losses. Taking profit at any time is the right move. If your profit doubles, be sure to promptly set your stop-loss at breakeven. $BTC
Everyone, please take a moment to tap follow. I’ll share suitable entry levels as soon as they come up. #BTC重返8万
post-image
BTC-0.65%
My WCTC S9 Trading Journey Begins!
Every trading decision is an opportunity to learn, improve, and grow. I have joined WCTC S9 with the goal of testing my strategies, managing risk, and making smarter trading decisions.
My focus is not only on winning but also on understanding market movements, identifying opportunities, and learning from every trade.
I will share my trading experience, market analysis, strategies, and lessons throughout this competition.
Let's compete with discipline, confidence, and smart decisions!
#WCTCS9 #GateWCTCS9GlobalTradingCompetition #GateSquare
post-image
  • 1
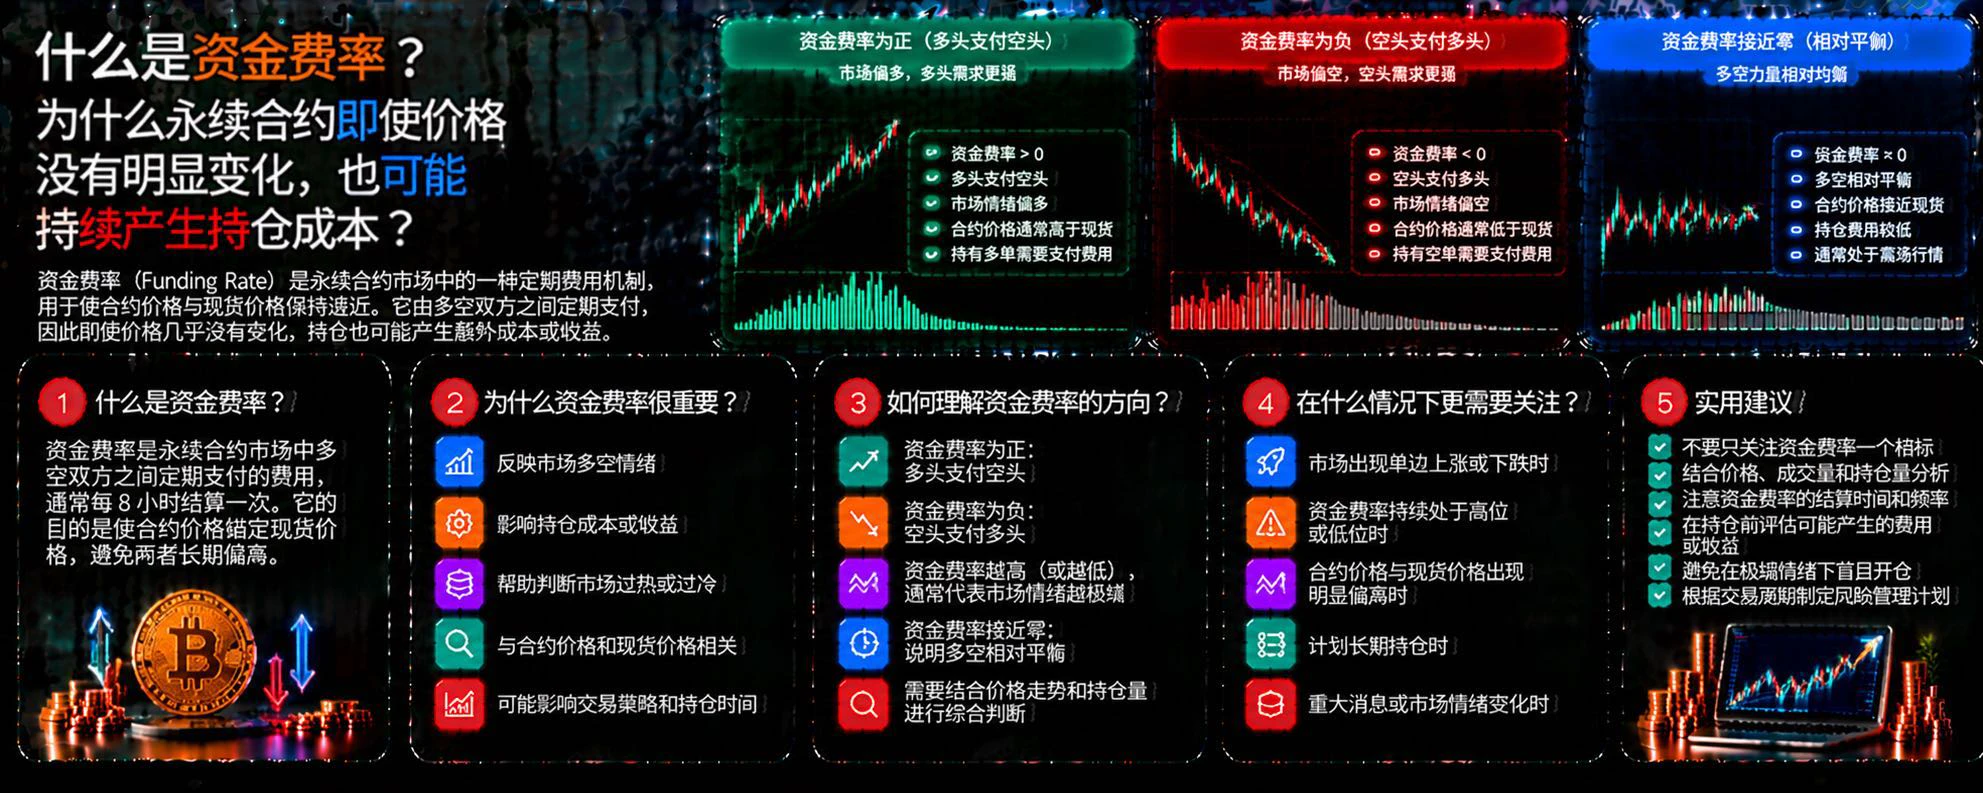
What Is the Funding Rate? Why Can Perpetual Contracts Continue to Generate Holding Costs Even When Prices Show No Significant Movement?
In cryptocurrency trading, many people focus only on price movements after opening a position and overlook the funding rate. For perpetual contract traders, even if prices move sideways for a long time, holding a position may still generate additional costs or returns as long as the funding rate is nonzero.
First, what is the funding rate?
The funding rate is a mechanism in perpetual contracts for periodic payments between longs and shorts, intended to help ke
post-image
Layout: Bitcoin, Ethereum, Dogecoin
live-cover
LIVE1,655
  • 1
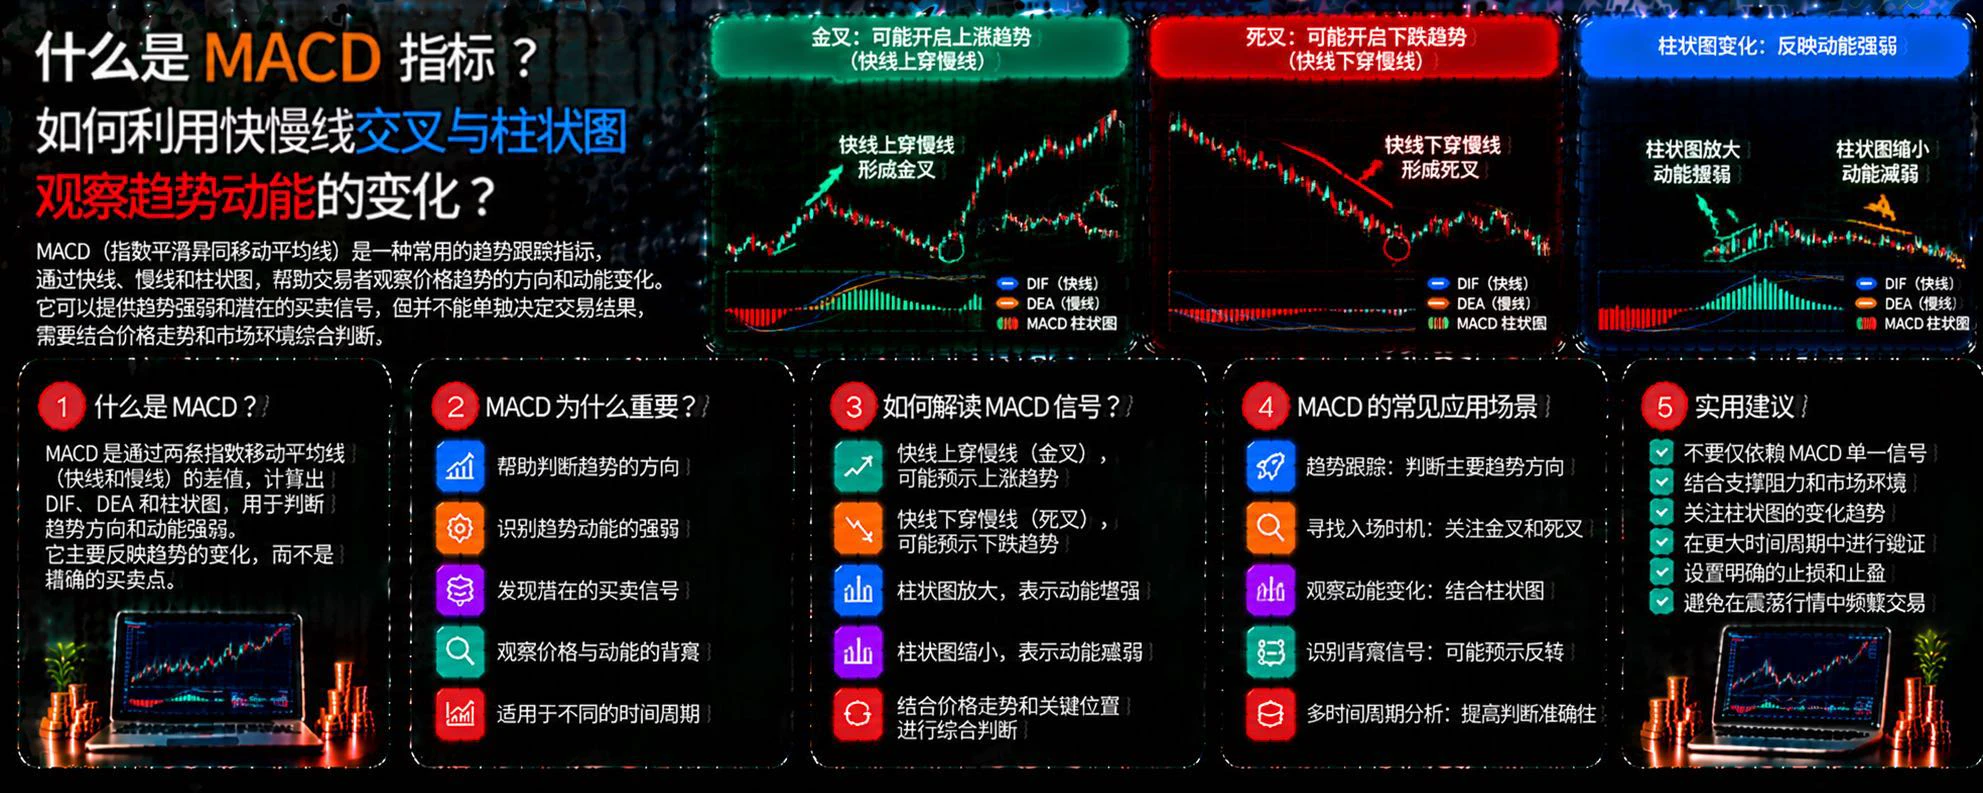
What Is the MACD Indicator? How Can You Use Crossovers and the Histogram to Track Changes in Trend Momentum?
In cryptocurrency trading, short-term price fluctuations can easily cloud your judgment. MACD is a common trend-following indicator that helps traders analyze trend direction and momentum by observing crossovers between two lines and changes in the histogram. However, it cannot accurately predict every price rise or fall, and it is not suitable for use on its own without considering market conditions.
First, what is MACD?
MACD stands for Moving Average Convergence Divergence, and its co
post-image
🏆 Join WCTC S9, share your results and strategies, and win extra rewards!
Every decision you make in the competition can be worth sharing. Post your results and discuss your trading ideas on Gate Square to get an extra chance to win rewards from your competition experience 🎁
Exclusive posting benefits:
• 3 outstanding creators selected daily, each receiving a 100 USDT position experience voucher
• Quality posts may earn an additional 1 GT
• Accumulate valid participation to enjoy extra weekly prize draws
📝 Post with #WCTCS9 and share your real experience and reasons behind your decisions!
post-image
GateSquare
🏆 Join WCTC S9, share your results and strategies, and win extra rewards!
Every decision you make in the competition can be worth sharing. Post your results and discuss your trading ideas on Gate Square to get an extra chance to win rewards from your competition experience 🎁
Exclusive posting benefits:
• 3 outstanding creators selected daily, each receiving a 100 USDT position experience voucher
• Quality posts may earn an additional 1 GT
• Accumulate valid participation to enjoy extra weekly prize draws
📝 Post with #WCTCS9 and share your real experience and reasons behind your decisions!
👉 Register to participate in the event
https://www.gate.com/campaigns/6559
👉 Publish a post now
https://www.gate.com/post

repost-content-media
GT-2.41%
  • 6
Long $SOLV Price has just broken above the BOS structure and remains above EMA 20/50/100/200. Prioritize longs when the price retests the support zone. Entry 1: 0.00470 – 0.00474 Entry 2: 0.00462 – 0.00465 Entry 3: 0.00454 – 0.00458 Take profit 1: 0.004835 Take profit 2: 0.005105 Take profit 3: 0.005225 Stop loss: 0.00445
post-image
SOLV-4.59%
What Is Slippage? Why Isn’t the Price You See When Placing an Order Necessarily the Final Execution Price?
In cryptocurrency trading, many people see one price when placing an order, only to find that the actual price is different after execution. This phenomenon is commonly called slippage. It may seem like only a slight price difference, but during highly volatile markets, large trades, or leveraged trading, it can significantly affect trading costs and the final outcome.
First, what is slippage?
Slippage is the difference between the expected execution price and the actual execution price.
post-image
Load More

Join 40 M users in our growing community

⚡️ Join 40 M users in the crypto craze discussion

💬 Engage with your favorite top creators

👍 See what interests you

Trending Topics

GateLaunchesPoSECProofOfSecurity

930 Views461 Discussing

Beyond Proof of Reserves, Gate has introduced PoSEC, a new Proof of Security framework focused on how user assets are stored and protected. By disclosing the distribution of assets across cold storage and hot wallets, users can directly understand Gate’s storage structure and risk coverage under extreme scenarios. Gate’s latest cold storage coverage ratio stands at 104.58%, meaning cold-storage assets alone are sufficient to cover all user assets. PoR verifies whether reserves are sufficient, while PoSEC shows how assets are stored and how risks are covered — together forming a more complete asset security framework. Share your results and experience! [👉 Learn more](https://gate.com/proof-of-security)

BTCBackAbove80K

58.53k Views41.31k Discussing

DemocratsWinBothChambers

21.04k Views467 Discussing

View More