Square
Following
Hot
News
Notifications
Profile
Share your thoughts
placeholder
Article
🚨 WAIT… WHY ARE BEARS SO CONFIDENT BTC WILL BREAK $70K?

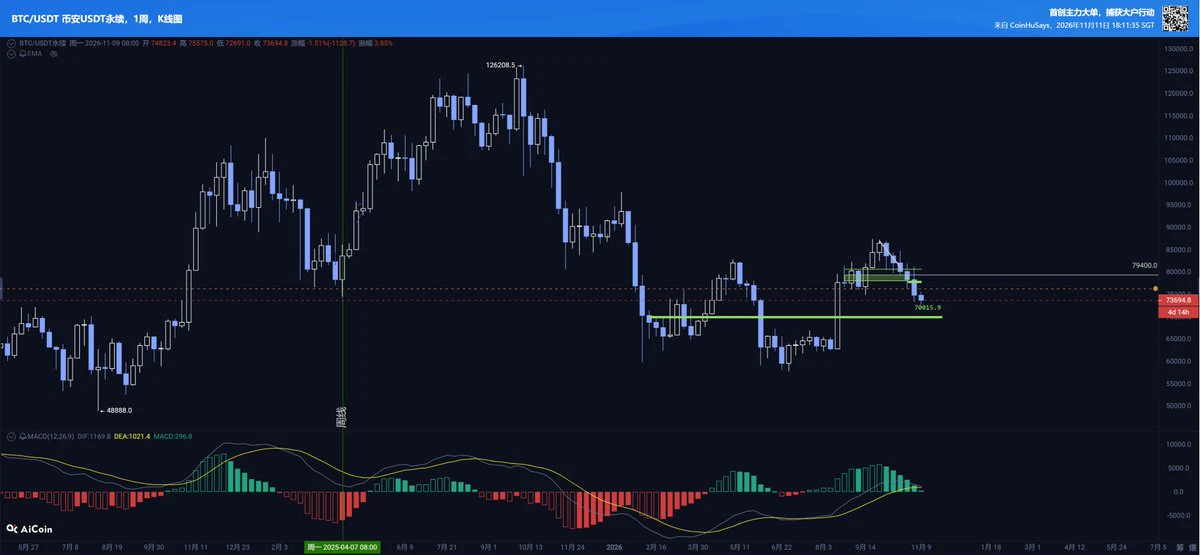
Listen… everyone is waiting for Bitcoin to crash below $70K, but I'm watching how buyers are defending the $73K zone. 👀

$BTC dropped toward $72,750, but sellers couldn't maintain the pressure. Buyers stepped in and pushed price back above $73K.

That's an interesting reaction.

Here's the LONG setup I'm watching:

🟢 Entry Zone: $73,000–$73,400
🎯 TP: $76,450
🛑 SL: $72,730

First, I want to see BTC reclaim $74K. If buyers take control, $75K–$76,400 becomes the next target zone.

And don't ignore the short sellers…

A strong breakout
BTC-0.67%
NVDA-5.47%
That startled me—I thought the place was haunted.
post-image
Trenches
mihao
m
bade
b
mihao
4Cxj...pump
Market Cap
$.
Change
.
24h Vol
$.
Holders
.
AGT
A
bade
b
AGT
0x5d...e274
Market Cap
$.
Change
.
24h Vol
$.
Holders
.
HOLD
H
bade
b
HOLD
4iJ7...pump
Market Cap
$.
Change
.
24h Vol
$.
Holders
.
PIEVERSE
P
bade
b
PIEVERSE
0x0e...25a9
Market Cap
$.
Change
.
24h Vol
$.
Holders
.
X
X
bade
b
X
9VZe...pump
Market Cap
$.
Change
.
24h Vol
$.
Holders
.
Support and resistance levels are the most fundamental and practical concepts in technical analysis. Many traders study candlesticks and indicators every day, yet overlook an important question: at which price levels are buying and selling forces likely to shift?

First, a support level is an area where buying pressure may increase as the price falls. When the price approaches this area, some buyers may start entering the market, slowing the decline. But a support level does not mean the price definitely won’t break below it.

Second, a resistance level is an area where selling pressure may in
post-image
BTC-0.67%
U.S. October CPI comes in hotter than expected! The probability of a 25-basis-point rate hike in Dec
live-cover
LIVE2,136
Yesterday, the monthly CPI came in hotter than expected.
Headline rose 0.4% on the month against the 0.3% the market expected, and core came in at 0.3% against 0.2%.
I believe the market reaction is also muted, considering the yearly data wasn’t released due to the 2025 government shutdown.
So it could’ve been much worse, considering the last PPI spiked to a 4-year high.
The odds of a hike at the December meeting have now jumped to around 87%.
In fact, the debate is no longer hike or hold, but hike once or more, as there’s a 12% chance of a 50 bps hike.
Not looking good for $BTC , as higher rat
BTC-0.67%
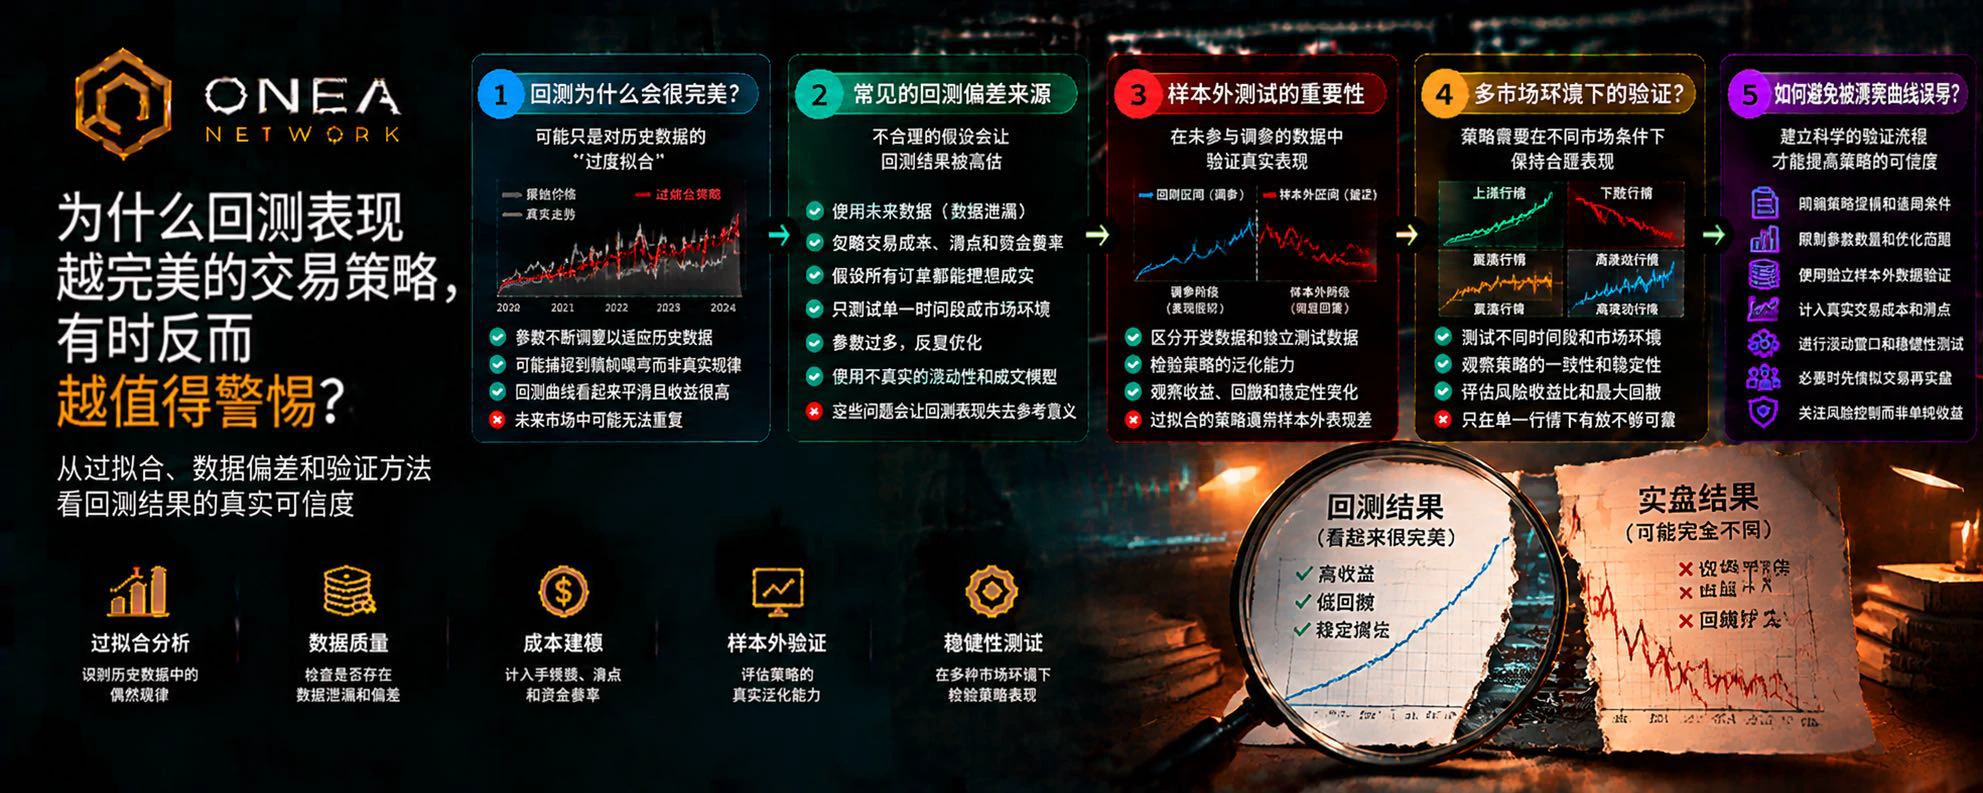
Why do some trading strategies make money in backtests but fail to cover trading costs in live trading?

A trading strategy shows profits every month in backtests.

But once you start trading for real, you find that your account returns are far below expectations. You may even predict the direction correctly, yet your account balance keeps falling.

The problem may not be that you misread the market, but that you underestimated trading costs.

Profits in a backtest are only theoretical results. Returns after deducting real trading costs are closer to what you can actually keep.

I. Trading cos
post-image
Why Do Blockchain Transactions Fail? From Gas Fees to Smart Contract Restrictions, a Complete Guide to Troubleshooting

In the Web3 world, many people have encountered situations like these:

You click Confirm, but your wallet keeps showing Pending; sometimes a transaction suddenly changes to Failed; other times, it takes a long time to complete, leaving you unsure whether to keep waiting or try again.

These situations may look similar, but their underlying causes can be very different.

Understanding why a transaction failed is more important than blindly raising the Gas fee or repeatedly cl
post-image
ETH-1.26%
Why can a small adverse price move cause huge losses when using high leverage?

In crypto markets, some traders use high leverage because they hope to control a larger position with less margin.

But they often overlook one key issue:

Leverage amplifies not only potential gains, but also the rate of losses relative to their own margin.

When prices move in an unfavorable direction, margin can shrink rapidly. Once account equity is insufficient to meet the platform's maintenance margin requirement, forced liquidation may be triggered.

I. How exactly does leverage amplify risk?

Suppose you pu
post-image
Turns out Sun Wukong gave me my sense of justice as a kid.
post-image
market rebound
live-cover
LIVE1,658
Every rise has its cause; every gain and loss has its basis.

Price retests key support, Bollinger Bands contract and selling pressure wanes, MA60 provides a floor, and a top-to-bottom reversal structure takes shape. Look for a low-risk window to try going long, set a stop-loss, and wait patiently for the setup to play out.

Markets are unpredictable; discipline comes first. $BTC
BTC-0.65%
$ES | Asset Synchronization
• 85% WR model | Middle Asset SMT Break.
ES+0.17%
I had a fever of 38.5°C today, and my AI detected it right away, saying I had a fever—not that I’d had too much to drink. AI is changing lives with medical-grade monitoring
$H That was a brutal plunge: -25.33%, 24h low of 0.0313, current price 0.0326, and trading volume of 15.6M. Here’s a simulation of today’s trading steps in a market maker’s voice: Early in the session, place small bids at 0.036 to make retail traders think support is solid; after 10 a.m., pull the buy orders and turn around to smash through 0.034, triggering stop-losses; accelerate the drop in the afternoon to 0.0313 and liquidate leveraged positions; then slowly buy back around 0.032 toward the close. The 15.6M volume shows that panic selling really came out, but there are signs of support bi
  • 6
  • 1
Why does the price move in its original direction after you get stopped out?

You go long BTC and set a stop-loss.

The price falls, triggering your stop-loss and closing your position.

But a few minutes later, the price starts rising again, even reaching your original target.

You might wonder: Was your stop-loss targeted? Is the market deliberately shaking retail traders out?

This can certainly be frustrating, but before drawing conclusions, you need to distinguish between several different causes.

A stop-loss being triggered does not necessarily mean your trade thesis was wrong; a subseq
post-image
BTC-0.67%
BTC is currently down for six consecutive weekly candles.
U.S. stocks have now stabilized, rising yesterday evening and again in tonight’s overnight session, especially AI hardware stocks, which carry significant weight.
However, U.S. stocks related to crypto are still falling, possibly due to concerns about Democrats taking power and pessimism about Trump’s crypto policies, compounded by worries early this morning that MicroStrategy could be removed from an index. They have yet to stabilize.
The next level to watch is a stabilization above 7000. #BTC
post-image
BTC-0.67%
MSTR-3.72%
Doubling is a simple thing,
post-image
How do you create a BTC trading plan? Build a truly actionable trading process!

When trading BTC, many people watch the market and study indicators every day, and often adjust their views based on market changes. But when it comes time to actually trade, they don’t know where to enter, how much loss should prompt them to exit, or when to stop trading.

The problem is often not a lack of analytical tools, but the absence of a complete trading plan.

First, determine the market direction. Before opening a position, observe the broader BTC trend and decide whether the market is currently rising,
post-image
BTC-0.67%
In the cryptocurrency market, many traders have learned some technical analysis methods, yet still repeatedly lose money in sideways markets. The reason may not be a lack of technical skill, but a failure to recognize the current market state.

The biggest difference between trending and sideways markets is how prices move.

First, in a sideways market, prices usually fluctuate repeatedly within a certain range, with resistance above and support below. If you follow a trend-trading approach—going long when you see prices rise and short when you see them fall—you can easily get caught repeatedl
post-image
Is BTC suitable for dollar-cost averaging? Use time to create a more measured investment pace!

In the cryptocurrency market, many people hope to buy at the bottom and sell at the top. But in reality, even experienced investors find it difficult to accurately predict every market reversal. Some make a lump-sum purchase and then face a major drawdown, while others keep waiting for a lower price and ultimately miss a long-term rally.

So, is BTC suitable for dollar-cost averaging?

First, it reduces the difficulty of market timing. The biggest feature of dollar-cost averaging is investing funds
post-image
BTC-0.67%
Load More

Join 40 M users in our growing community

⚡️ Join 40 M users in the crypto craze discussion

💬 Engage with your favorite top creators

👍 See what interests you

Trending Topics

GateGlobalComplianceExpansion

16.7k Views364 Discussing

Gate continues to expand its global compliance footprint, now covering 81 regulated jurisdictions across Europe, North America, Asia, and Oceania. From MiCA and U.S. state-level MTLs to Japan’s FSA, Dubai, and Australia-related regulatory approvals, global exchanges are entering a new stage of compliance competition. Do you think regulatory strength will become as important as products and liquidity for exchanges in the future?

USOctoberCPIBeatsExpectations

88.29k Views2.66k Discussing

AnthropicIPOValuationCouldReach1.4T

12.71k Views1.61k Discussing

View More