Share crypto content and earn up to 60% commissions through content mining.
placeholder
gatefun
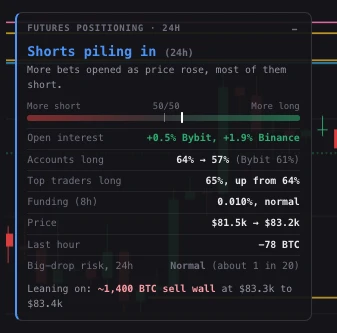
JUST IN: CryptoQuant founder notes BTC demand has turned positive in both spot and perpetual futures for the first time since ATH—if this persists for a month, a new bull cycle could be underway. $BTC
BTC8.07%
post-image
  • Reward
  • Comment
  • Repost
  • Share
Practice what you preach—I’ll never trade without a stop-loss again. Protecting principal is the most important thing.
View Original
post-image
  • Reward
  • Comment
  • Repost
  • Share
💰 $COLLECT /USDT
🔻 SHORT
✳️ ENTRY (Use DCA STRATEGY) : 6340 , 6500, 6700
🎯 TARGETS - 6200 , 6000 , 5740 , 5500 , 5220 , 4900
🀄️ LEVERAGE -  cross 10x
🔴 STOPLOSS - 6900
COLLECT16.70%
post-image
  • Reward
  • Comment
  • Repost
  • Share
The hand that set the stop-loss a few days ago was trembling slightly; this morning I realized that filial piety was unnecessary. I opened the chart early, and $US indeed made another push, still following the old script—every surge falls just short, with clear resistance overhead. After waiting all day at this level, I finally caught it showing weakness. My short position at 0.046375 is now at 0.017808, sitting on a +1212.17% profit. Don’t let profits inflate, and don’t despair over a drawdown. Position management is simple: close 70% first, move the stop-loss on the remaining 30% to the entr
US3.24%
SOL6.97%
BNB5.62%
View Original
post-image
  • Reward
  • Comment
  • Repost
  • Share
Perpetual trading is moving deeper into consumer facing crypto apps as Coinbase adds Hyperliquid to Base App
Eligible users can now access 290+ markets with leverage of up to 50x, expanding derivatives exposure directly within the platform
COIN8.29%
HYPE21.18%
post-image
  • Reward
  • Comment
  • Repost
  • Share
US initial jobless claims for the week ended Aug 15 were 206k vs 210k expected, signaling a tighter labor market and potential hawkish tilt for risk assets. $BTC / $ETH (as relevant)
BTC8.07%
ETH14.11%
post-image
  • Reward
  • Comment
  • Repost
  • Share
#BTCETHReboundTradingIdeas
BTC +7%, ETH +18% — I’m Watching the Pullback, Not Chasing the Candle
The current rebound has definitely changed the mood of the market. Bitcoin has pushed strongly higher while Ethereum has shown even more aggressive momentum, and after watching the market move like this, the biggest temptation for traders is to jump in because they are afraid of missing the next move. Personally, I think this is the moment to become more patient, not more emotional. A strong rally can continue, but after a fast expansion the risk of entering late also increases. My focus right now
BTC8.07%
ETH14.11%
post-image
  • Reward
  • 1
  • Repost
  • Share
HighAmbition:
2026 GOGOGO 👊
#HYPESurges22%ApproachesAllTimeHigh Hyperliquid Is Back at the Center of the Market
$HYPE is moving fast, and this is one of the strongest altcoin rallies of the current market session. Hyperliquid surged roughly 22% in one day, with the daily move taking price from around $58.52 to a high near $72.16 before closing around $71.39. The latest market data is even showing HYPE trading around the $72–$74 area, with the token now only a few percent below its recorded all-time high near $76.85–$76.87.
That is a very different situation from a normal altcoin bounce.
HYPE is now entering the area wher
post-image
Yusfirah
#HYPESurges22%ApproachesAllTimeHigh Hyperliquid Is Back at the Center of the Market
$HYPE is moving fast, and this is one of the strongest altcoin rallies of the current market session. Hyperliquid surged roughly 22% in one day, with the daily move taking price from around $58.52 to a high near $72.16 before closing around $71.39. The latest market data is even showing HYPE trading around the $72–$74 area, with the token now only a few percent below its recorded all-time high near $76.85–$76.87.
That is a very different situation from a normal altcoin bounce.
HYPE is now entering the area where every additional move higher brings it closer to price discovery. Once an asset reaches its previous record zone, there are fewer historical resistance levels above it. That can create extremely strong momentum if buyers successfully break the ATH, but it can also produce aggressive profit-taking because traders who bought much lower have an obvious reason to lock in gains.
Why Is HYPE Moving So Aggressively?
One important catalyst behind the latest surge is the changing regulatory narrative around Hyperliquid's perpetual-futures platform. Reports say the move followed signals that the CFTC is exploring a compliant pathway that could potentially allow Hyperliquid to expand its presence in the U.S. market.
That matters because Hyperliquid is already one of the strongest decentralized derivatives platforms, and greater access to the U.S. market could significantly expand the addressable user base if such a pathway actually develops.
But I would separate regulatory signals from confirmed regulatory approval. Traders should not price in the entire future before the details become official.
The fundamentals are also attracting attention. Recent reporting says Hyperliquid generated around $106 million in August fees, with nearly $400 billion in perpetual-futures volume and roughly 70% share of on-chain perpetuals trading.
For me, that is one of the most interesting parts of the HYPE story.
The token is not moving only because of social-media excitement. The underlying Hyperliquid ecosystem continues to generate significant trading activity and fees.
The ATH Is Now the Main Battle
The current all-time-high region is approximately $76.85–$76.87 according to current market data.
That means HYPE is extremely close to a potential breakout.
If HYPE reaches $76–$77 and sellers fail to stop the move, a clean daily breakout above the previous ATH could create a completely different market structure.
Above the ATH, there is no major historical resistance in the traditional sense.
That is where price discovery begins.
And price discovery can become extremely powerful because traders who were previously waiting for a resistance breakout may suddenly start chasing momentum.
My HYPE View
My short-term view is bullish but extremely cautious.
Why cautious?
Because HYPE has already delivered approximately 22% in one session.
I like the trend, but I do not like chasing an extended candle.
For me, the best confirmation would be a clean break above $76.85–$77, followed by price holding that area instead of immediately falling back below it.
If that happens, I would start watching the psychological levels:
$80 → $85 → $90 → $100
The $80 area would be the first major psychological checkpoint after the ATH.
If momentum remains strong above $80, $85 could become the next area where traders take profit.
A sustained move above $90 would make $100 a much more interesting psychological target.
I would treat these as potential market-reaction zones rather than guaranteed targets.
My Trading Plan
I would divide the setup into three different scenarios.
Scenario 1 — Clean ATH Breakout
If HYPE breaks above $76.85–$77 with strong volume and then holds that level as support, I would consider the breakout technically stronger.
In that situation, my attention would move toward:
$80 → $85 → $90 → $100
I would prefer scaling rather than entering the entire position at once.
Scenario 2 — ATH Rejection
If HYPE reaches the $76–$77 region and gets rejected aggressively, I would not automatically short.
A rejection after a 22% rally can simply mean traders are taking profits.
I would watch whether price finds buyers around the previous breakout areas.
The $70–$72 zone is particularly important because it is close to the current breakout area after the latest surge.
If HYPE pulls back toward this region and buyers defend it, the market could attempt the ATH again.
Scenario 3 — Deeper Pullback
If HYPE loses $70 with strong selling pressure, I would become more cautious.
A deeper correction could bring $65–$67 into focus.
Below that, I would watch approximately $60–$62, because that region is close to the lower part of the latest explosive move.
The important thing is that I would not treat every dip as a buying opportunity. I want to see support + buyer reaction + improving structure before considering a fresh entry.
My Preferred Entry Philosophy
After a 22% rally, I would rather wait for confirmation than chase.
My ideal sequence would be:
Breakout → Retest → Support confirmation → Entry → Momentum continuation
For example, if HYPE breaks $77, pulls back toward the breakout region and successfully holds it, that would be more attractive to me than buying after a sudden vertical move toward $80+.
If HYPE never gives a retest, I would rather take a smaller position than use aggressive leverage.
There will always be another setup.
What Makes HYPE Different?
Hyperliquid's biggest strength is its growing position in decentralized derivatives trading.
Recent reports highlight extremely strong trading activity, while the protocol's fee generation and token-burn mechanism continue to attract attention. One report said August fees had already reached approximately $106 million, while more than 47 million HYPE tokens had been burned.
That creates an interesting fundamental narrative:
More trading activity → more fees → stronger protocol economics → greater attention on HYPE.
But there are still risks.
A large portion of the recent move can be driven by momentum, and momentum can reverse quickly.
There are also supply, unlock and valuation considerations that traders should keep in mind. Strong fundamentals do not eliminate volatility.
My Profit Management Idea
If I were already holding HYPE from lower levels, I would not wait for one perfect top.
I would consider taking partial profits into major psychological zones while keeping some exposure for a potential price-discovery move.
For example, the areas I would monitor for potential profit-taking are:
$77 ATH zone
$80
$85
$90
$100
This does not mean HYPE must reach every level.
It simply creates a structured way to manage a position instead of making emotional decisions during a fast rally.
What Would Make Me More Bullish?
I would become increasingly bullish if HYPE shows four things:
1. A decisive break above $76.85–$77
2. Strong volume during the breakout
3. Successful retest of the previous ATH
4. Continued strength in Hyperliquid trading activity
If all four appear together, the argument for a sustained price-discovery phase becomes much stronger.
What Would Change My View?
A failed ATH breakout followed by a sharp loss of the recent breakout structure would make me more defensive.
If HYPE loses $70 and continues making lower highs, I would stop chasing.
If it falls toward $65–$67, I would wait for a new structure.
If the broader crypto market also turns lower, HYPE could experience a much larger correction because high-beta assets generally react more aggressively during risk-off periods.
My Final Opinion
This is one of the most interesting HYPE setups I have seen because the token is no longer simply recovering from a correction.
It is approaching its historical record zone after a 22% one-day surge.
The current price is around the low-$70s, while the ATH is around $76.85–$76.87, meaning HYPE is only a few dollars away from entering a fresh price-discovery phase.
My bullish roadmap is straightforward:
$70–$72: immediate support area
$76.85–$77: ATH breakout battle
$80: first psychological upside zone
$85: next momentum zone
$90: major extension
$100: major psychological target
My risk roadmap is equally important:
Below $70: caution
$65–$67: deeper support zone
$60–$62: major lower support area
For me, the biggest mistake would be buying HYPE purely because it has already risen 22%.
The better question is:
Can HYPE prove that $77 is no longer resistance, but the beginning of price discovery?
If yes, the upside can become much more interesting.
If no, I would rather wait for a healthy pullback and a new setup.
HYPE has already shown explosive strength. Now the market needs to prove whether this is simply a powerful rally or the beginning of a completely new chapter above the previous all-time high.
#HYPE #Hyperliquid #TradingPlan
repost-content-media
  • Reward
  • Comment
  • Repost
  • Share
$SPCX On the daily chart, it has reached the 130 support level, but the downward pressure remains strong. On the four-hour chart, it has come straight down, with no rebound in sight. On the one-hour chart, the previous candlestick has become shorter, showing some signs of a rebound. You can consider opening a long position, but be sure to set a stop-loss at 132. A safer approach is to wait for a bottoming signal on the four-hour chart before entering. One bullish candlestick is enough to enter, but a stop-loss must still be set. Do not hold the position if 130 breaks. Volatility has been high
SPCX-5.17%
View Original
post-image
post-image
post-image
  • Reward
  • Comment
  • Repost
  • Share
#TopFiveLeaguesPreMatchPredictor
⚽ LaLiga Pre-Match Prediction | Rayo Vallecano vs Deportivo Alavés
Rayo Vallecano face Deportivo Alavés tonight in what could be a closely contested LaLiga matchup at Estadio Municipal de Butarque in Leganés.
Rayo come into the game looking to respond after a narrow 2–1 defeat against Sevilla in their opening match. Despite the result, they showed attacking intent and created opportunities, with Álvaro García making an immediate impact by scoring inside the opening minutes.
Alavés arrive with confidence after an impressive 3–0 victory over Getafe. Their strong
post-image
  • Reward
  • Comment
  • Repost
  • Share
#BTCETHReboundTradeIdeas
BTC + ETH Rebound: Chase the Rally or Wait for the Pullback?
BTC and ETH have both delivered powerful rebounds, but after a move this strong, the hardest decision is no longer identifying the trend. It is deciding how to enter without turning a good market setup into a bad trade.
My approach here is simple: I would not chase a vertical candle. I would wait for confirmation or a controlled pullback.
For BTC, the first area I would watch is the $68,000–$68,500 zone. If Bitcoin pulls back into this region, holds it as support, and buyers return with healthy volume, that
post-image
  • Reward
  • 1
  • Repost
  • Share
HighAmbition:
To The Moon 🌕
Whale alert: a single address just opened ~$81.6M in BTC and ETH shorts, with liquidation prices around $2,327 ETH and $72,756 BTC. This could signal near-term downside pressure if markets move against these levels. $BTC $ETH
BTC8.21%
ETH14.19%
post-image
  • Reward
  • Comment
  • Repost
  • Share
#BTCSurgesPast70000Up8.3%
The moment every Bitcoin trader has been watching for two months finally arrived. Bitcoin not only reclaimed the psychological $70,000 barrier but pushed decisively above it, delivering a stunning 8.3% surge from the lows hit just 24 hours earlier. The current price stands at approximately $69,720 after touching a high of $70,055, representing an 8.25% gain over the past 24 hours and a massive 9.86% gain over the past week. This is the strongest single-day performance Bitcoin has shown since early June.
What Drove This Breakout?
The rally was powered by a convergence
post-image
  • Reward
  • Comment
  • Repost
  • Share
#BTCETHReboundTradeIdeas
BTC + ETH Rebound: Chase the Rally or Wait for the Pullback?
BTC and ETH have both delivered powerful rebounds, but after a move this strong, the hardest decision is no longer identifying the trend. It is deciding how to enter without turning a good market setup into a bad trade.
My approach here is simple: I would not chase a vertical candle. I would wait for confirmation or a controlled pullback.
For BTC, the first area I would watch is the $68,000–$68,500 zone. If Bitcoin pulls back into this region, holds it as support, and buyers return with healthy volume, that
BTC8.07%
ETH14.11%
post-image
  • Reward
  • 3
  • Repost
  • Share
SoominStar:
2026 GOGOGO 👊
View More
$LAB has seen declining volume and is forming its first bottom. If successful, you can enter an initial position.
LAB5.37%
View Original
post-image
hihappy
0/50
Futures
30D ROITrader PnL
+6.77%
+10.78
Win Rate
--
AUM
0
Copiers PnL
--
  • Reward
  • Comment
  • Repost
  • Share
$GPS 4H-Level Short Trend Practical Review】
The moving averages on the 4-hour chart formed a high-level death cross, and the price broke below key support, confirming the bearish trend. We accurately entered a short position at 0.017023, using 25x leverage to amplify the trend gains and successfully secured an astonishing 715.06% return! The strategy signal has been shared—congratulations to everyone who followed the trade and made big profits!
$ETH
Trade Logic Analysis:
Entry: After the death cross was confirmed, we followed the trend and opened a short position at the top.
Take profit: Clo
GPS-0.99%
ETH14.19%
SNDK0.36%
View Original
GPSUSDT
Short
Cross 25X
Return %
+711.9%
Entry Price(USDT)
0.017023
Mark Price(USDT)
0.012021
  • Reward
  • Comment
  • Repost
  • Share
#USTreasuryBuybacksAndRegulatorySignalsDriveCryptoSurge
BTC + ETH Daily Market Analysis: Rebound Confirmed, But the Retest Matters
Bitcoin and Ethereum have entered a very different market environment after yesterday’s sharp upside move. BTC is currently trading around $69.5K–$69.9K, while ETH is around $2.24K, after both assets experienced a major momentum expansion.
On the 1-day timeframe, the most important development is the recovery from the recent lower range and the aggressive expansion in volume and momentum. Bitcoin moved above $68K and reached levels near $70K, while Ethereum reclai
BTC8.07%
ETH14.11%
post-image
  • Reward
  • 1
  • Repost
  • Share
HighAmbition:
To The Moon 🌕
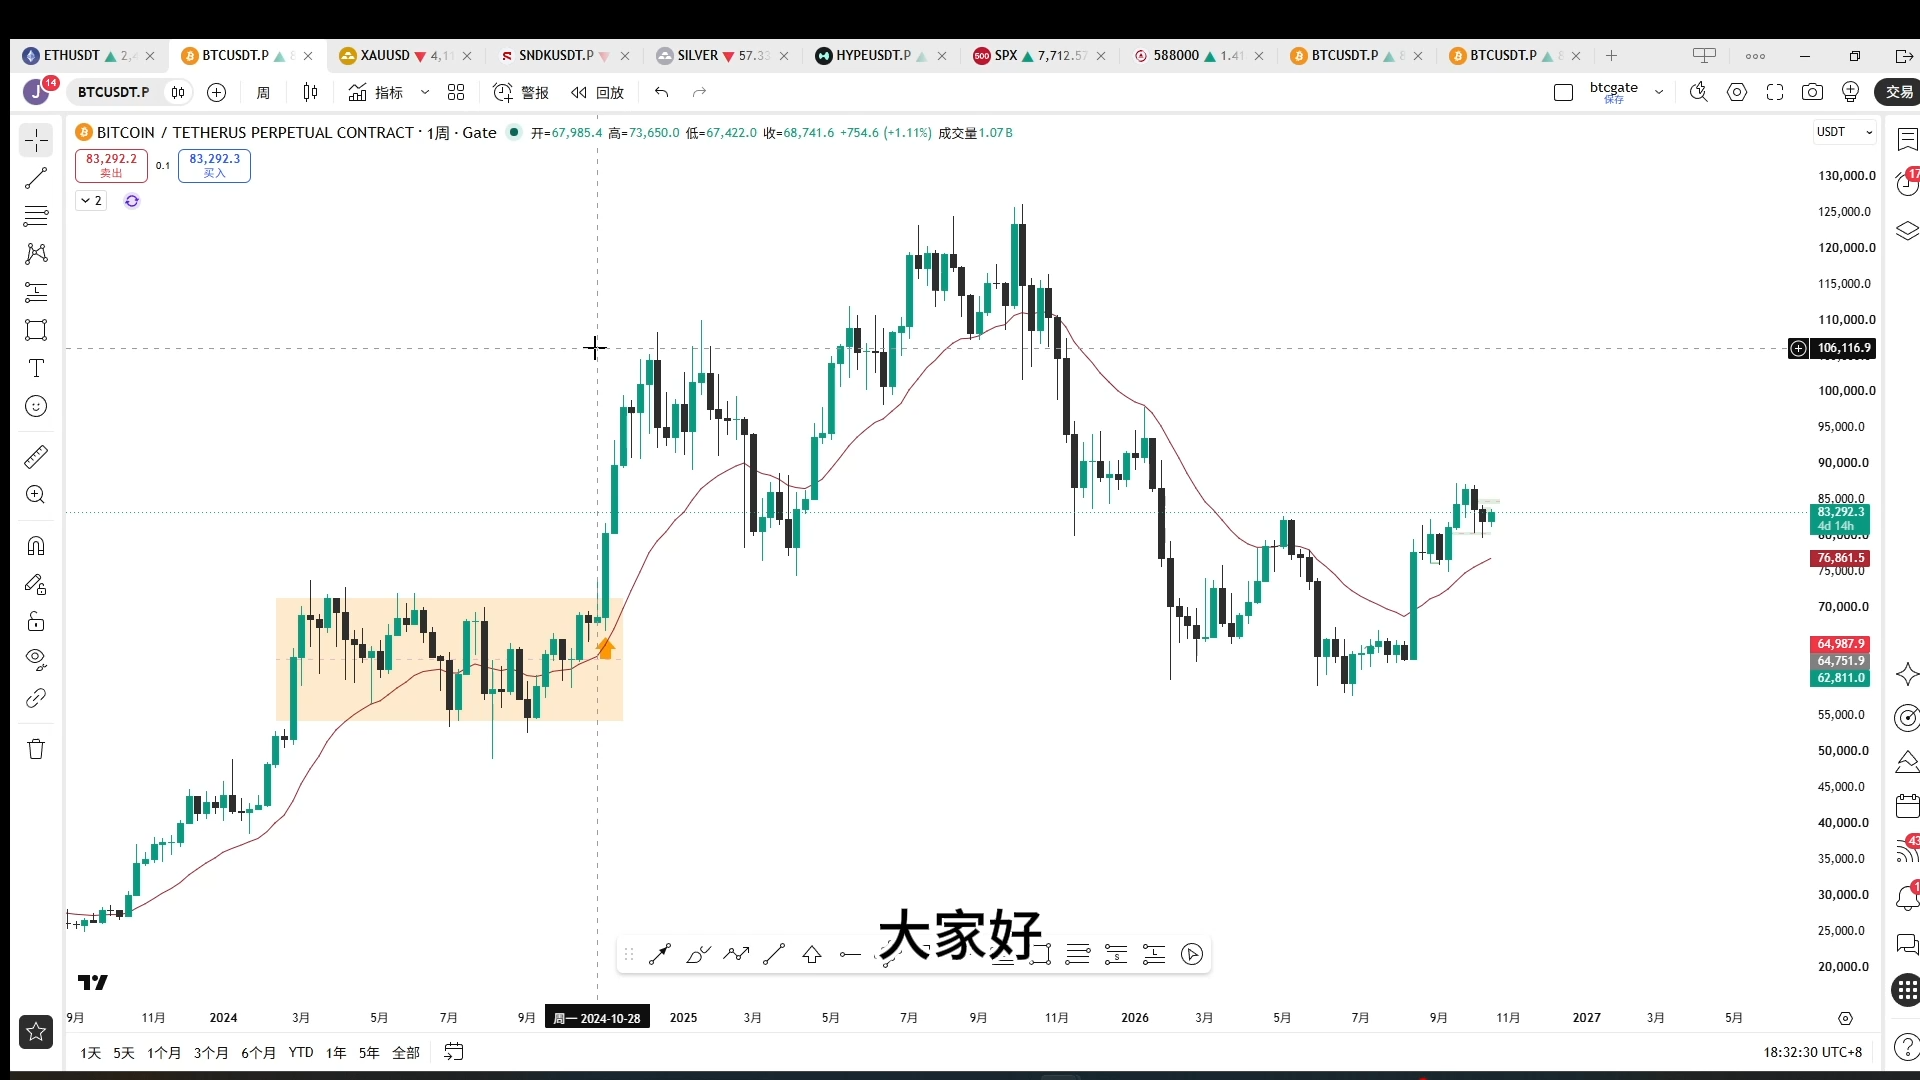
This small swing long has been very profitable, and many of you have taken the small swing longs I notified you about: blindly long below 60,000; if you went long around 60,000–63,000, don’t rush. Stay steady and we’ll keep waiting. #BTC #ETH #SNDK
BTC8.07%
ETH14.11%
SNDK2.10%
View Original
post-image
  • Reward
  • Comment
  • Repost
  • Share
🔥 Strategy Win: $H Short Position Scores a Big Victory!
Congratulations to the guys who followed the trade signals in the Hot Chat Square and successfully made profits! In this HUSDT contract trade, we precisely opened a short position at the high of 0.11725, using 10x leverage, and secured an exceptional 330.40% return near 0.07819!
$BTW
📊 Professional Review and Trend Analysis:
On the four-hour chart, HUSDT’s previous upward momentum had weakened, while the MACD indicator formed a death cross at a high level (Note: In the context of the short-position logic, this is a bearish death-cross
H-16.57%
BTW-39.31%
BOME43.65%
View Original
post-image
HUSDT
Short
Cross 10X
Return %
+328.62%
Entry Price(USDT)
0.11725
Mark Price(USDT)
0.07818
  • Reward
  • Comment
  • Repost
  • Share
Load More

Join 40 M users in our growing community

⚡️ Join 40 M users in the crypto craze discussion
💬 Engage with your favorite top creators
👍 See what interests you
  • Pinned