





Square
Following
Hot
News
Notifications
Profile
Share your thoughts
placeholder
Article
A trading strategy performs well in historical backtests. Why might it gradually fail in real markets?

A beautiful return curve does not necessarily mean a reliable trading strategy.

In the cryptocurrency market, many traders test entry signals, take-profit and stop-loss settings, and position parameters using historical data. But once a strategy is deployed in the market, its win rate may decline, drawdowns may grow, and it may even lose money over the long term.

So where does the problem lie?

1. Historical data is not the same as future markets

Backtesting only shows how a strategy perf
post-image
The most expensive lesson crypto taught me: admitting I'm ordinary
It took me four years to say this out loud.
When I first entered crypto, I truly thought I was different.
Other people lost money because they were greedy, stupid, or didn't understand the technology.
I was different. I'd read so many books, drawn so many lines, and I could hold on.
Looking back now, that wasn't confidence; it was youth.
In my first year, I lost 60%.
I had plenty of reasons:
Bad market conditions, market makers were too ruthless, news came too late, and I was too unlucky.
It never occurred to me that the simple
post-image
BTC-0.65%
ETH-1.23%
Trenches
ZIG
Z
bade
b
ZIG
0x8c...1145
Market Cap
$.
Change
.
24h Vol
$.
Holders
.
STONK
S
bade
b
STONK
6GmA...UNgx
Market Cap
$.
Change
.
24h Vol
$.
Holders
.
CLAUDIA
C
bade
b
CLAUDIA
2j5S...W2ZM
Market Cap
$.
Change
.
24h Vol
$.
Holders
.
FLOAT
F
bade
b
FLOAT
Bv1a...BMmr
Market Cap
$.
Change
.
24h Vol
$.
Holders
.
MAGGIE
M
bade
b
MAGGIE
8rHo...PmZV
Market Cap
$.
Change
.
24h Vol
$.
Holders
.
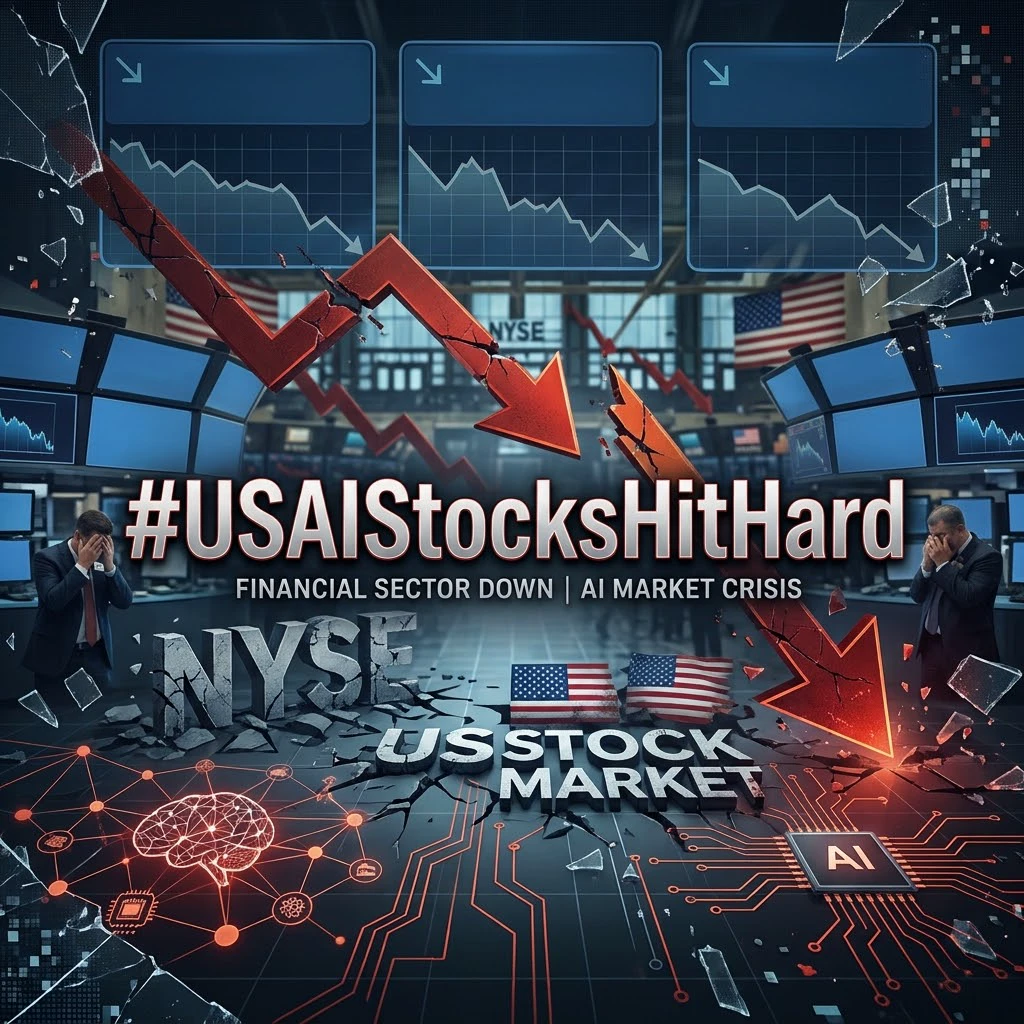
#USAIStocksHitHard #ShareWeekly

U.S. Stocks at a Turning Point: Is the Next Move a Recovery or Another Wave of Selling?

The U.S. stock market is entering a critical period where investor expectations, corporate earnings, interest rates, and artificial intelligence investments are all competing to determine the next major direction. Following the recent sharp decline in technology shares, investors are asking an important question: Has the market already experienced its worst correction, or is another round of volatility ahead?

My view is that the market is moving through a valuation adjust
post-image
MSFT-0.95%
GOOGL+0.72%
AMZN-0.44%
AMD+11.55%
INTC+8.00%
#USNonfarmPayrolls #每周来晒
🛑 Structural Recalibration: Macro Volatility Intensifies After Blockbuster October Labor Print

The global macroeconomic layout has entered a phase of intense structural repricing following the official release of the U.S. Bureau of Labor Statistics (BLS) October employment data. For multi-strategy funds and active trading desks, the historical predictive models have been completely upended. This is no longer an environment driven by speculative soft-landing narratives; it is a market reacting to undeniable, high-velocity labor resilience that alters the future path
post-image
NFP-6.17%
XAU+0.38%
$BAND $BAND is now heavily shorting, then bought in at $0.0619; short entry price: 0.1761 $BAND 👇
post-image
BAND-2.33%
#ETH #BTC #BAN #PHA #PNUT
Fam, I’m your spiritual pillar. Latest update: there’ll be a huge dump tonight. Remember what I said—short immediately. Don’t go long. Only short the highs. Making money in crypto is simple; information is key. Follow along and make gains. Remember what I said?
ETH-1.23%
BTC-0.65%
BAN-3.97%
PHA+5.94%
PNUT-1.71%
Why Does the Exchange Show a Profit, Yet the Amount You Actually Earn After All Costs Is Much Smaller?

When reviewing their trades, many traders focus only on the difference between the buy and sell prices, while overlooking an important issue:

Paper profit does not necessarily equal actual net profit.

Especially in the cryptocurrency market, trading frequency, order types, holding periods, and market liquidity can all affect the final result.

To find out whether a strategy can actually make money, you need to understand at least the following five types of costs.

1. Trading fees: Every b
post-image
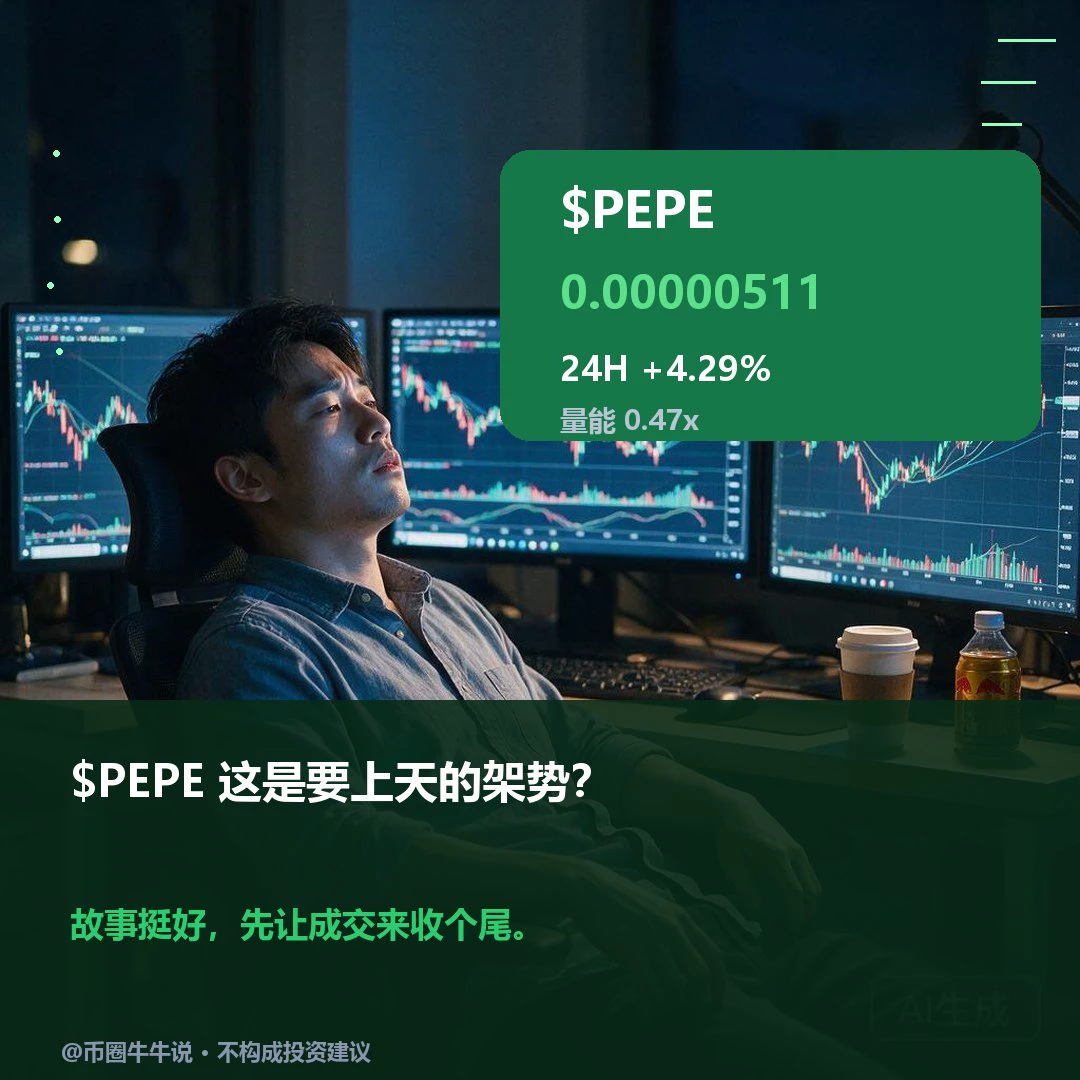
$PEPE Current price 0.00000511, 24H +4.29%. Both 1H/4H are bullish: 1H RSI 86.11/EMA 0.00000495, support 0.00000478/resistance 0.00000513; 4H RSI 62.07/EMA 0.00000495, support 0.00000463/resistance 0.00000521. Watch for a sustained move above the 0.00000513 resistance or a break below the 0.00000478 support. Review whether 0.00000513 can hold and whether price can reclaim 0.00000478 after losing it; volume ratio is 0.47x, with no confirmed invalidation. Market volatility is high; for observation only.
post-image
PEPE+0.97%
The harshest rule in crypto: The more desperately you try to turn things around, the harder it is to do so
This isn’t feel-good advice; it’s a conclusion I’ve reached after seeing far too many accounts.
The people who lose the most are often not the worst traders, but the ones who can’t wait.
First, let’s correct a misconception: having little money isn’t the problem
300U, 500U, 1000U—none of these are the problem.
The problem is having little money and still wanting quick results.
Small capital + wanting quick results = oversized positions + high leverage + frequent trading.
Put these four th
post-image
BTC-0.65%
🚩 Short-Side Little Whirlwind | Take profit $CLANKER +18.4%

✅ $CLANKER Short position closed at take profit
Held for 3 days 8 hours | Result +18.39% (including fees and funding fees)

📊 This trade
Before entry: 24h gain +68.8%, trending for the 2nd time
Entry: 12 hours after the signal, already down 14.3% from the signal price
During the trade: maximum unrealized loss 14.7% | maximum unrealized gain 18.3%

🛡 Rules unchanged
Stop-loss +18% (exchange limit order) | Take-profit 18% | Maximum duration 5 days

💬 Once the hype fades, patience is worth more than quick hands; take profits and cal
post-image
CLANKER-1.45%
People who carry too much gear are less likely to reach the finish line
Hikers have a saying: the heavier your pack, the less likely you are to reach the summit.
The same is true in crypto.
You have thirty trading strategies saved on your computer, follow twenty influencers on your phone, and get over ten trading calls every day—
You're not trading; you're climbing a mountain with a heavy load.
For newcomers to crypto, the gear looks like this:
One indicator, one asset, one rule.
Simple, but you can keep moving.
After three years in crypto, veterans' gear looks like this:
Eight indicators, fiv
post-image
BTC-0.65%
📉 U.S. tech stocks tumble across the board | Post to claim a red packet, with the weekly leaderboard winner taking home up to 100 USDT!
Gate Square’s “Weekly Share” special edition on trending topics is underway!

🎁 Event rewards
New users who post: 100% chance to claim a red packet
Weekly leaderboard rewards: win up to 100 USDT

📌 How to participate
1️⃣ Sign up for the event 👉 https://www.gate.com/campaigns/6244
2️⃣ Share your views with the hashtags #每周来晒 and #美股史诗级抛售

💬 This week’s topic
U.S. stocks faced a massive sell-off on Thursday, with the Nasdaq closing down more than 5% and A
GateSquare
📉 U.S. tech stocks tumble across the board | Post to claim a red packet, with the weekly leaderboard winner taking home up to 100 USDT!
Gate Square’s “Weekly Share” special edition on trending topics is underway!

🎁 Event rewards
New users who post: 100% chance to claim a red packet
Weekly leaderboard rewards: win up to 100 USDT

📌 How to participate
1️⃣ Sign up for the event 👉 https://www.gate.com/campaigns/6244
2️⃣ Share your views with the hashtags #每周来晒 and #美股史诗级抛售

💬 This week’s topic
U.S. stocks faced a massive sell-off on Thursday, with the Nasdaq closing down more than 5% and AI and chip stocks including NVDA and AMD tumbling across the board. Do you think this decline is short-term deleveraging, or is AI trading entering a deeper correction? Which do you favor next: chip stocks, tech giants, or other defensive sectors?

👉 Post now: https://www.gate.com/post/topic/USStocksFaceHistoricSelloff?topic_id=212400

repost-content-media
NDAQ+0.28%
NVDA+2.80%
AMD+11.55%
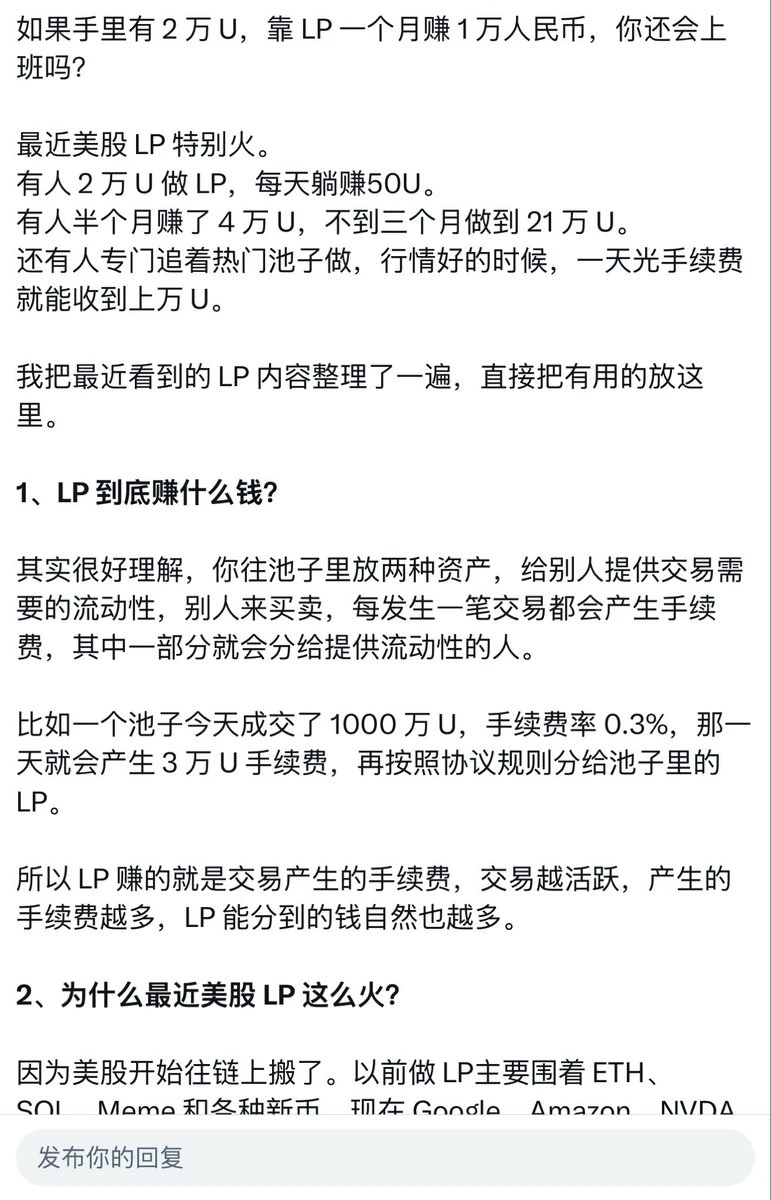
Were a lot of people farming LPs for on-chain U.S. stocks a while back? Like, put in 20,000 U and make 10,000 yuan a month—no need to work anymore. Are they all stuck now? Did they honestly go back to their day jobs?
post-image
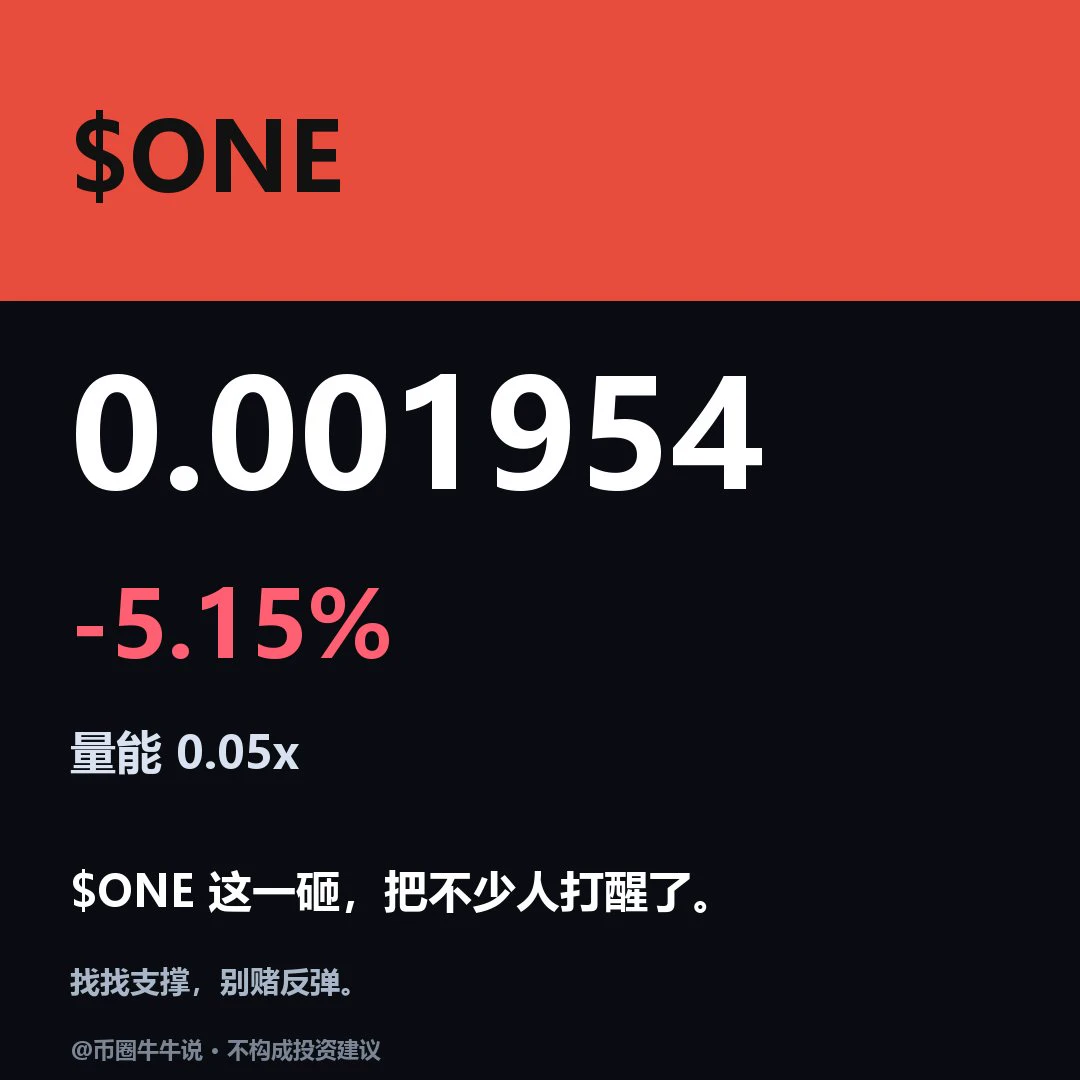
$ONE Current price: 0.001954, 24H -5.15% (0.001807–0.002476). 1H is weak: RSI 50.72/EMA20 0.001974, support at 0.001807/resistance at 0.00243; 4H is strong: RSI 63.74/EMA20 0.001749, support at 0.001027/resistance at 0.002476. The upside condition is holding above the 0.00243 resistance level; the downside condition is breaking below the 0.001807 support level. Review whether price can hold above 0.00243 and whether it can recover after losing 0.001807; the volume ratio is 0.048x, and the setup is invalid without confirmation of market participation. High market volatility; for observation onl
post-image
Just play dead and that's it$NVDA
post-image
NVDA+2.80%
#Gate股票畅聊季 #SNDK #WCTCS9
Gate Stock Talk Season: SNDK – The Growing Opportunity in the Memory and AI Storage Market
The technology sector is experiencing a major transformation as artificial intelligence, cloud computing, and data centers continue to expand. One company attracting attention in this evolving market is SNDK (SanDisk), which operates in the NAND flash memory and data storage industry.
SNDK and the Growing AI Revolution
Artificial intelligence is increasing the demand for high-performance storage solutions. AI models require enormous amounts of data to be stored, accessed, and pr
SNDK+3.53%
market price updates
live-cover
LIVE689
Night Update
live-cover
LIVE1,158
From 100k to 1 million: Do the “real math” first, and you’ll find it’s harder than you think
Most people calculate it like this: 100k × 10 = 1 million.
But you want 1 million in hand, not 1 million showing in your account.
There are a lot of costs in between quietly eating into your returns.
① Fees can eat up more than 15% a year
Assume you make 200 trades a year, with a notional position size equal to 1x your account per trade.
Taker fee 0.05% + closing fee 0.05% = 0.1% per trade
200 trades × 0.1% = 20% of your account
Even if you use maker orders for everything (0.02%), that still comes to 8
post-image
BTC-0.65%
Based on the provided data, the market is currently in a state of fragile equilibrium: short-term indicators signal a potential bounce, but the mid-term picture remains under pressure. The key event for the upcoming week is the US macroeconomic inflation data, which could dictate the direction of the market for the entire month of November.

📅 Macro Context: CPI and PPI

The market is holding its breath ahead of the inflation data set to be released next week. According to forecasts, both headline and core CPI are expected to rise by 0.3% MoM, which could support expectations for a Fed rate h
BTC-0.67%
  • 2
Load More

Join 40 M users in our growing community

⚡️ Join 40 M users in the crypto craze discussion

💬 Engage with your favorite top creators

👍 See what interests you

Trending Topics

USCPIDataIncoming

11.08k Views1.62k Discussing

The U.S. October CPI report will be released on November 10 at 8:30 a.m. ET. September CPI came in at 3.7% year over year, and markets will be watching closely for signs that inflation is cooling, especially in core CPI. A softer-than-expected reading could strengthen rate-cut expectations, while hotter inflation may pressure risk assets through higher Treasury yields and a stronger dollar. How do you think this CPI print will move $BTC, U.S. stocks and gold?

USAIStocksHitHard

27.78k Views3.74k Discussing

USNonfarmPayrolls

52.78k Views4.48k Discussing

View More