Square
Following
Hot
News
Notifications
Profile
Share your thoughts
placeholder
Article
What Is the Calmar Ratio? Why Is Maximum Drawdown Also an Important Metric for Evaluating Trading Strategies?

In cryptocurrency trading, some strategies deliver high annual returns but have also experienced substantial account losses, while others generate relatively lower returns but have smaller maximum drawdowns. Comparing only final returns can easily overlook the risks an account was exposed to along the way. The Calmar Ratio is a metric that helps us consider returns and maximum drawdown together.

First, what is the Calmar Ratio?

The Calmar Ratio is usually calculated by dividing the
post-image
Bitcoin short from 75,500, another call delivered!
Shared my view publicly this morning, and I’m currently up around 1,000 points.
This old short seller is still the same: willing to call the direction in advance and execute when the market moves.
The real value has never been in reviewing the trade after the fact, but in showing your hand beforehand! $BTC #BTC
BTC-0.67%
Trenches
ZIG
Z
bade
b
ZIG
0x8c...1145
Market Cap
$.
Change
.
24h Vol
$.
Holders
.
牛逼
牛
bade
b
牛逼
0x96...7777
Market Cap
$.
Change
.
24h Vol
$.
Holders
.
BTC
B
bade
b
BTC
C5xp...pump
Market Cap
$.
Change
.
24h Vol
$.
Holders
.
STONK
S
bade
b
STONK
6GmA...UNgx
Market Cap
$.
Change
.
24h Vol
$.
Holders
.
ANSEM
A
bade
b
ANSEM
9cRC...pump
Market Cap
$.
Change
.
24h Vol
$.
Holders
.
Jensen Huang admits to having an affair
Well,
Better to have no shame than no money!
Impressive!
I have to hand it to you!
P.S.
Her looks are just so-so,
Mr. Huang,
Your eye for women is pretty average...
post-image
Sudden flash crash before BTC’s weekly close! A wick down to $73,510, with $715 million in long posi
live-cover
LIVE3,138
$BTC The weekly and monthly charts show no signs whatsoever of bottoming. The bearish trend continues, and Bitcoin will fall to at least 72k, possibly even 69k. Ethereum will most likely fall to the 1,900s.
BTC-0.65%
#BTCFlashCrash $BTC #ShareWeekly
Short answer first. I think this was a leverage flush, but a flush that landed on a weak spot, and that is why I’m not calling it finished.

What happened

Late Sunday, BTC fell about 2.8% in roughly 15 minutes, from near 75,600 to a low around 73,510, then recovered most of it. About $745 million was liquidated in one hour, and $715 million of that was longs. That is about 96% longs, and it works out to roughly $255 million of long liquidations for every 1% of price drop, by my math. Over the full 24 hours, different trackers show anywhere from $850 million t
BTC-0.65%
  • 6
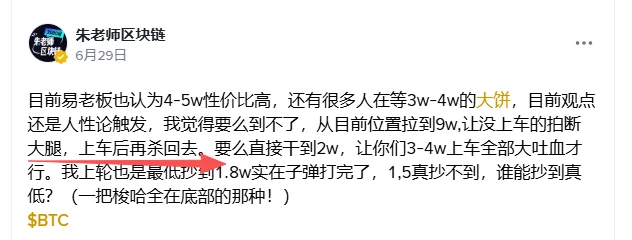
This market isn’t really going to do what I predicted in June and crash back down, is it? I’m scared as hell. $BTC
post-image
BTC-0.67%
BTC suddenly plunges to $73,510! $745 million liquidated in 1 hour, bulls stunned!

The crypto market has once again staged a heart-pounding midnight drama!
BTC suddenly plunged, briefly falling to $73,510 within 15 minutes before quickly rebounding. Before investors could react, about $745 million in positions had already been liquidated across the market, including a staggering $715 million in long positions!
What does that mean? Bulls were just anticipating a bull market, only to get an expensive lesson in risk management from the market in the blink of an eye.
This plunge was likely relate
NVDA+2.80%
  • 29
$FOLKS I think this coin is rising. Buy at 2.410 and 2.365. Targets: 2.490, 2.530, and 2.574. Stop loss: 2.315
post-image
FOLKS+0.88%
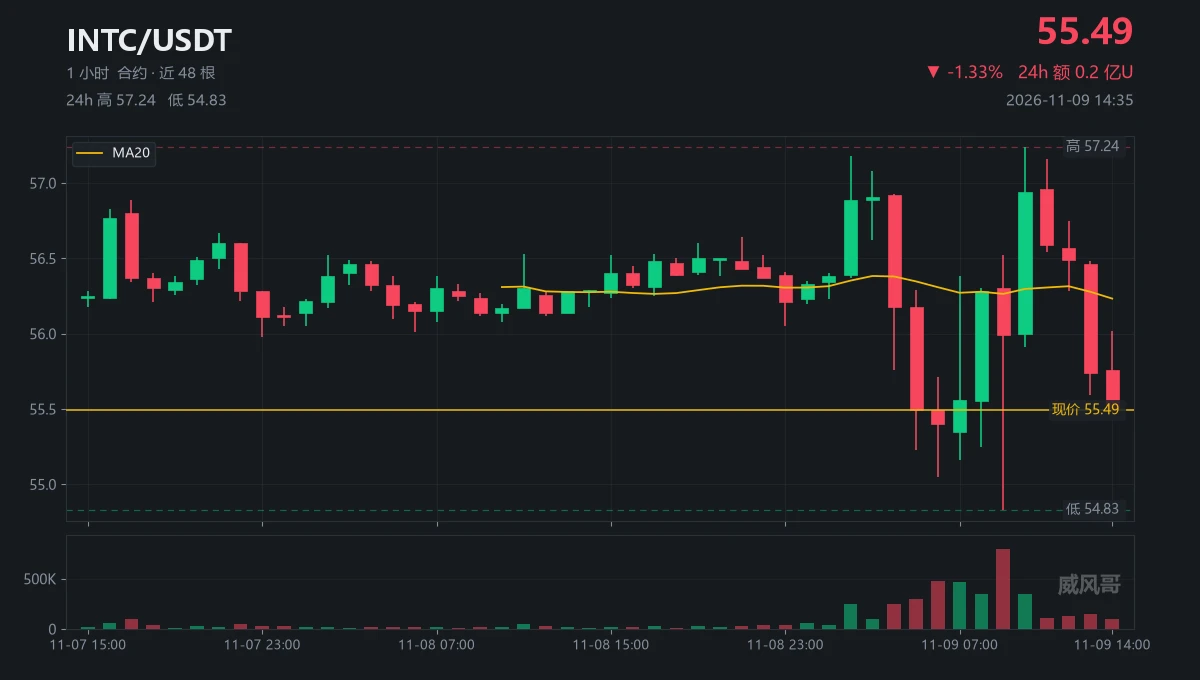
Can I ask something? Why did the 09:00 candle plunge to 54.83 and then close at 55.99?
It traded 791,000 contracts, the most all day, and buyers stepped in immediately after the plunge.
Then the 10:00 candle shot straight up to 57.24—does that count as a reversal?
Volume was only 346,000 contracts, 44% of the 09:00 candle's, and it gave all that back over the next seven hours.
So what exactly is 55.49 stuck at now?
At the midpoint of the 09:00 candle's lower wick, with neither bulls nor bears winning.
The highs of 57.18 and 57.24 are only six cents apart, but price just can't get through.
The
post-image
INTC+0.05%
AI Stocks Plunge, but Tech Giants Say Demand Hasn’t Disappeared! Is This AI Sell-Off an Overreacti
live-cover
LIVE3,491
Your crypto wallet is your gateway to interacting with blockchain networks.
But here's something important: owning a wallet also means taking responsibility for its security.
Protect your recovery phrase.
Never share your private keys.
Verify websites before connecting.
Be careful with suspicious links.
Security should never be an afterthought.
#CryptoSecurity #Blockchain #Web3Safety
post-image
Nvidia's CEO admitted an affair on Sunday, and $NVDA dropped 4.2% before Wall Street even opened.

Guys, Jensen Huang doesn't build the chips. Thousands of engineers do. The demand for AI compute stays the same whatever happens to one man's reputation.

BUT, and this is a HUGE but... He is the face of NVIDIA.

The keynotes, the leather jacket, the deals with world leaders. Steve Jobs never wrote the iPhone's code, but Apple still moved every time he did, right?

That being said... still BULLISH.
NVDA+2.80%
GM ☀️
Happy Mutant Monday 🧪
post-image
#RedBullDoublePodiumInBrazil $GT
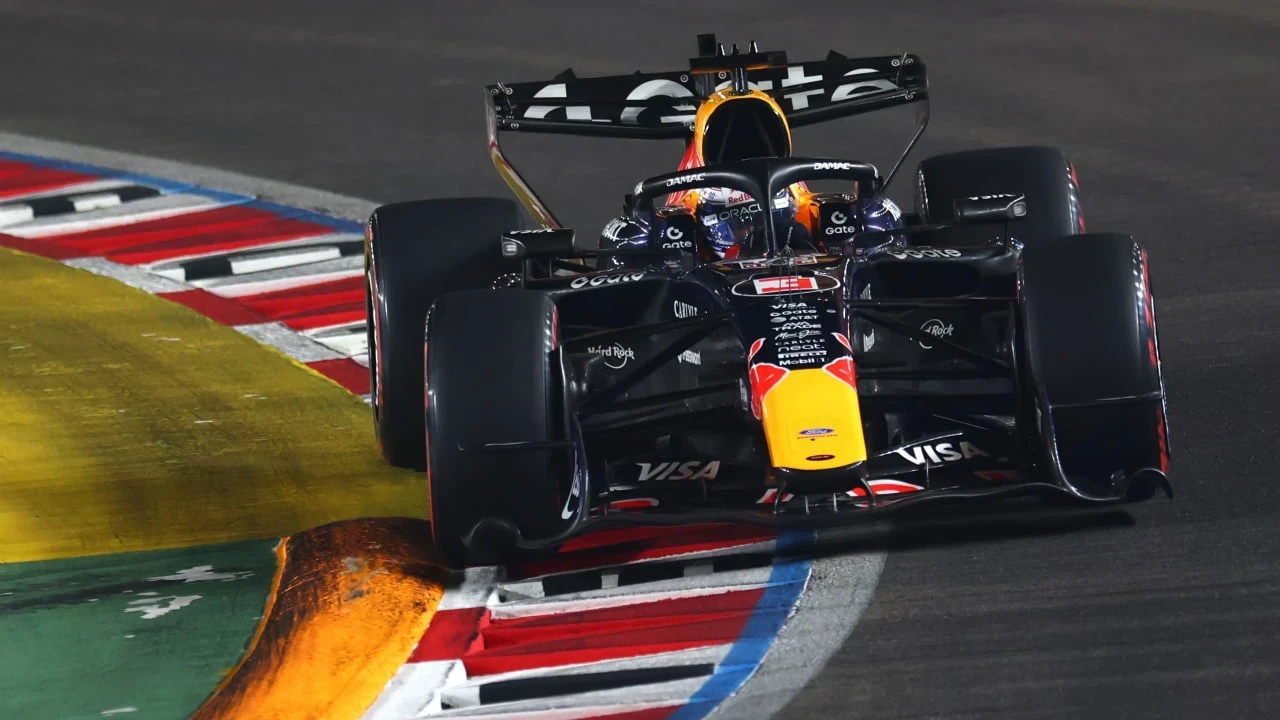
Red Bull took a double podium in Brazil, and most people will talk about the comeback. I find the numbers behind it more interesting. I follow markets more than racing, but as a brand story this weekend deserves a closer look.

The comeback in numbers

Max started 21st because of an engine penalty and finished second, which means he gained 19 places over a 71 lap race. Isack started fifth and finished third. Together that is 33 points for the team, 18 for Max and 15 for Isack. Max arrived on 261 points and left with 279, so one afternoon added about 7% to his
post-image
GT-2.41%
What Is the Sharpe Ratio? Why Isn’t a Higher-Return Strategy Necessarily the Better Choice?

In the cryptocurrency market, some trading strategies deliver high annual returns but come with sharp drawdowns, while others generate relatively steady returns and have more stable equity curves. Comparing only how much money a strategy ultimately makes may not fully capture its quality. In this case, the Sharpe Ratio can be a useful reference.

First, what is the Sharpe Ratio?

The Sharpe Ratio measures the relationship between an asset’s or strategy’s excess returns over the risk-free rate and the v
post-image
$HANA ’s vertical rally has finally run out of steam. It looks like everyone stopped buying almost at the same time, leaving a chart that’s gradually cooling off. Hard to say whether it’s looking to retest lower prices or will just trade sideways, but today’s momentum definitely looks heavy. Take profit: 0.01610 Stop loss: 0.0187 Market watch: $PIEVERSE : Current price 1.6017 - 24-hour change: +14.63% $ETH : Current price 2,113.93 - 24-hour change: -5.30%
post-image
HANA-3.22%
PIEVERSE+0.58%
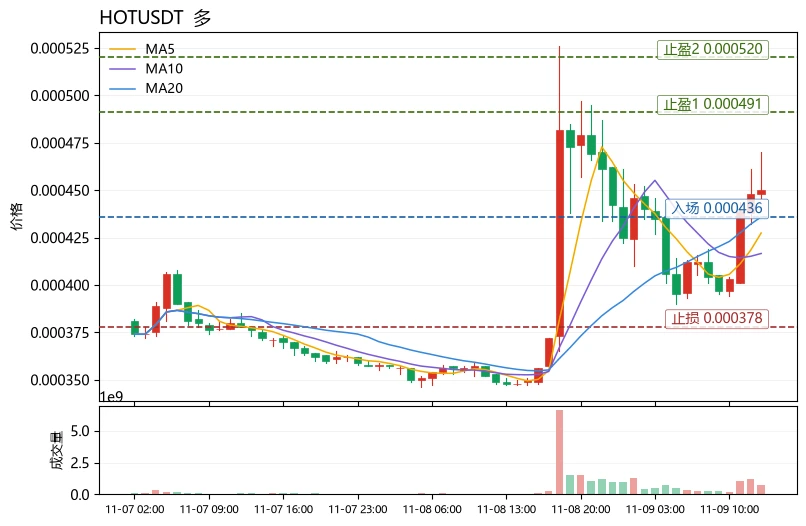
$HOT Short-term bullish, but this is a highly volatile asset rebounding against market sentiment, and the risk of chasing the rally is greater than the opportunity on a pullback. The Fear and Greed Index is only 29, with the broader market in fear territory and BTC providing no strong impetus; capital is leaning toward short-term speculation. HOT is up 29.23% over 24 hours against the trend, with trading volume of only 9.9M USDT, making this a small-cap, pulse-driven move. Technically, MA5 remains below MA20, so the trend has not fully reversed, but RSI at 61.8 is not overbought, the MACD his
post-image
HOT-1.97%
UNI+3.05%
LTC-0.07%
Monday market order alert! The 743 long position has been entered. Those looking to trade ETH can follow along. Reasons: First, bearish momentum has already been released, so chasing shorts now may not offer an ideal risk-reward ratio. Second, BTC’s 200-day moving average is currently near 73170, where a structural rebound may form. Set the stop-loss at 72900; if it breaks below that level, take the short-term loss and exit. #美国10月CPI即将公布 #BTC闪崩插针
post-image
ETH-1.26%
BTC-0.67%
#70%OfAltcoinsFallBelow200DMA $XRP $SOL #ShareWeekly
Seven out of ten altcoins below their 200 day average sounds like a clean bearish signal. Before I react to it, I want to understand what the number really measures, because I think it says less than it appears to.

What the indicator measures

The 200 day average is the average closing price over the last 200 days, and traders use it to separate long uptrends from downtrends. The reading counts how many altcoins on a large exchange sit below that line. It is a yes or no test. A coin that is 1% under the line counts the same as a coin that
XRP-1.12%
SOL-0.74%
  • 1
Load More

Join 40 M users in our growing community

⚡️ Join 40 M users in the crypto craze discussion

💬 Engage with your favorite top creators

👍 See what interests you

Trending Topics

USCPIDataIncoming

26.7k Views1.83k Discussing

The U.S. October CPI report will be released on November 10 at 8:30 a.m. ET. September CPI came in at 3.7% year over year, and markets will be watching closely for signs that inflation is cooling, especially in core CPI. A softer-than-expected reading could strengthen rate-cut expectations, while hotter inflation may pressure risk assets through higher Treasury yields and a stronger dollar. How do you think this CPI print will move $BTC, U.S. stocks and gold?

RedBullDoublePodiumInBrazil

1.25k Views30.52k Discussing

BTCFlashCrash

59.21k Views66.2k Discussing

View More