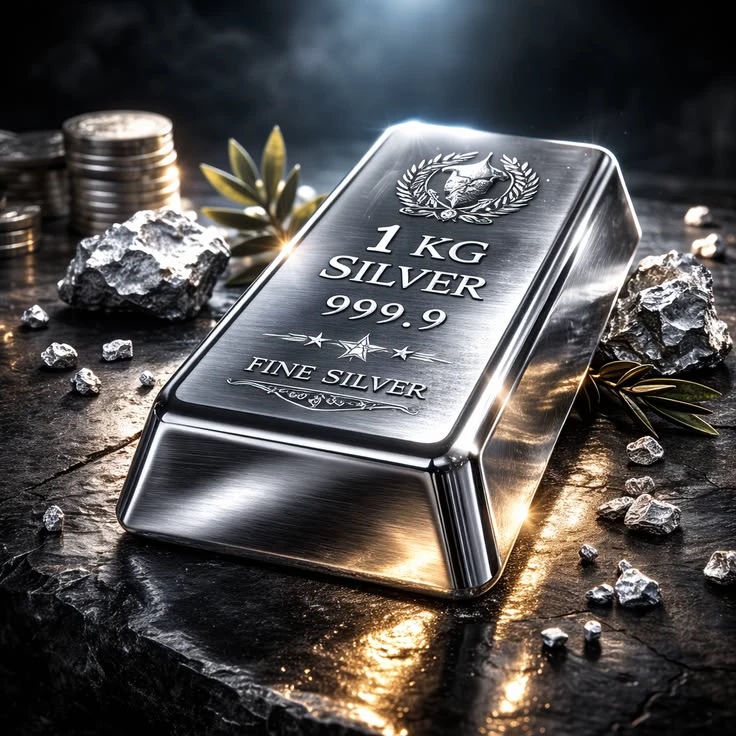










$XAG 🔬 The silver market is facing a historic test in 2026. After exceeding $121 per ounce at the beginning of the year, the price is now trading in the $45 range—a decline of more than 60% from its peak. However, interpreting this drop merely as a price movement would mean overlooking the structural transformation the market is currently undergoing.
Why $45? 👀
Three intersecting dynamics lie behind this decline.
🔹The first is the macroeconomic framework. Rising U.S. Treasury yields and a strengthening dollar have intensified pressure on precious metals, which offer no interest yield. The market is pricing in a more hawkish monetary policy stance from the Federal Reserve, which is accelerating capital outflows from assets like silver that lack a risk-free return.
🔹The second dynamic is the erosion of industrial demand. Approximately 60% of total demand for silver comes from the industrial sector, and industrial production is projected to contract by 2% to 3% in 2026. In particular, gains in the efficiency of solar panels have reduced the amount of silver used per unit, while demand for jewelry and silverware has also seen a sharp decline. Uncertainties surrounding investments in artificial intelligence and an oversupply in the electric vehicle market have further compounded this pressure.
🔹The third—and perhaps least discussed—dynamic is the unwinding of speculative positions. Aggressive buying in the first half of the year had pushed silver prices to historic highs; now, the closing of these positions through profit-taking is amplifying the selling pressure. There has been an outflow of over 55 million ounces from exchange-traded products (ETPs). This indicates a divergence between the financial market and the physical market, despite the tightness in the latter.
A Critical Divergence: Physical Shortage vs. Financial Selling 🔎
The most striking contrast here is that the silver market is experiencing a supply deficit for the sixth consecutive year—meaning physical demand is outstripping supply—yet the price is falling. This is because silver possesses a dual identity: it is both an industrial raw material and an investment asset. When interest rates rise, its appeal as an investment weakens; when industrial demand slows, its role as a raw material falters. Currently, both identities are under pressure simultaneously, marking a rare, synchronized decline in silver’s "dual-engine" structure.
Technical Outlook and Key Levels to Watch
The $45 level serves as a critical psychological threshold. Should the price remain sustained below this mark, support zones at $42 and $40 may come into play. On the upside, the initial resistance lies at $48.62, followed by the $51.49 level, where the 21-day moving average is situated. While the RSI indicator’s approach to the oversold zone raises the possibility of a short-term rebound, a recovery in industrial demand is required for a genuine trend reversal.
At present, silver is not being priced strictly as a precious metal, nor purely as an industrial metal; the market is questioning both narratives simultaneously. Nevertheless, the long-term supply deficit and the themes surrounding the energy transition remain relevant. However, in the short term, financial conditions and an industrial slowdown are taking precedence. The $45 level should be watched as a critical threshold that will reveal whether these two narratives might rebalance.
What are your thoughts on silver, silver prices, and investing in silver?
#WCTCS9 #ShareWeekly #GateTrading
#Metals
Why $45? 👀
Three intersecting dynamics lie behind this decline.
🔹The first is the macroeconomic framework. Rising U.S. Treasury yields and a strengthening dollar have intensified pressure on precious metals, which offer no interest yield. The market is pricing in a more hawkish monetary policy stance from the Federal Reserve, which is accelerating capital outflows from assets like silver that lack a risk-free return.
🔹The second dynamic is the erosion of industrial demand. Approximately 60% of total demand for silver comes from the industrial sector, and industrial production is projected to contract by 2% to 3% in 2026. In particular, gains in the efficiency of solar panels have reduced the amount of silver used per unit, while demand for jewelry and silverware has also seen a sharp decline. Uncertainties surrounding investments in artificial intelligence and an oversupply in the electric vehicle market have further compounded this pressure.
🔹The third—and perhaps least discussed—dynamic is the unwinding of speculative positions. Aggressive buying in the first half of the year had pushed silver prices to historic highs; now, the closing of these positions through profit-taking is amplifying the selling pressure. There has been an outflow of over 55 million ounces from exchange-traded products (ETPs). This indicates a divergence between the financial market and the physical market, despite the tightness in the latter.
A Critical Divergence: Physical Shortage vs. Financial Selling 🔎
The most striking contrast here is that the silver market is experiencing a supply deficit for the sixth consecutive year—meaning physical demand is outstripping supply—yet the price is falling. This is because silver possesses a dual identity: it is both an industrial raw material and an investment asset. When interest rates rise, its appeal as an investment weakens; when industrial demand slows, its role as a raw material falters. Currently, both identities are under pressure simultaneously, marking a rare, synchronized decline in silver’s "dual-engine" structure.
Technical Outlook and Key Levels to Watch
The $45 level serves as a critical psychological threshold. Should the price remain sustained below this mark, support zones at $42 and $40 may come into play. On the upside, the initial resistance lies at $48.62, followed by the $51.49 level, where the 21-day moving average is situated. While the RSI indicator’s approach to the oversold zone raises the possibility of a short-term rebound, a recovery in industrial demand is required for a genuine trend reversal.
At present, silver is not being priced strictly as a precious metal, nor purely as an industrial metal; the market is questioning both narratives simultaneously. Nevertheless, the long-term supply deficit and the themes surrounding the energy transition remain relevant. However, in the short term, financial conditions and an industrial slowdown are taking precedence. The $45 level should be watched as a critical threshold that will reveal whether these two narratives might rebalance.
What are your thoughts on silver, silver prices, and investing in silver?
#WCTCS9 #ShareWeekly #GateTrading
#Metals