





Square
Following
Hot
News
Notifications
Profile
Share your thoughts
placeholder
Article
What Is a Trailing Stop? How Can You Protect Existing Profits Without Exiting a Continuing Trend Too Early?

In cryptocurrency trading, after prices rise, traders often face a difficult question: When should they take profits? Selling too early may mean missing further gains, while holding on too long may gradually give back existing profits. A trailing stop offers a way to dynamically manage exit levels, but it also has limitations.

First, what is a trailing stop?

A trailing stop is a strategy that adjusts the stop level as the price moves favorably. For a long position, for example, as the
post-image
How Should Trading Strategies Be Adjusted When Market Conditions Change?

In the previous article, we discussed how to identify changes in market conditions.

But noticing that the market has changed is only the first step.

What truly determines trading results is what you do next.

When a trending market turns choppy, a strategy that was once effective may start triggering frequent stop-losses; when market volatility suddenly expands, even if you correctly predict the direction of a trade, you may still suffer losses due to oversized positions, increased slippage, or liquidation.

Therefore,
post-image
Trenches
BTC
B
bade
b
BTC
C5xp...pump
Market Cap
$.
Change
.
24h Vol
$.
Holders
.
ZIG
Z
bade
b
ZIG
0x8c...1145
Market Cap
$.
Change
.
24h Vol
$.
Holders
.
STONK
S
bade
b
STONK
6GmA...UNgx
Market Cap
$.
Change
.
24h Vol
$.
Holders
.
GM
G
bade
b
GM
0x13...7777
Market Cap
$.
Change
.
24h Vol
$.
Holders
.
DESSA
D
bade
b
DESSA
npz2...pump
Market Cap
$.
Change
.
24h Vol
$.
Holders
.
Did one X post wipe $3 trillion off the U.S. stock market?
post-image
  • 6
#Breaking:
Almost 1 trillion dollars is gone from the Asian stock market today.
The big crash has already started.
post-image
A good product also needs to be where users can find it
After someone buys an RWA, what else can they do with it? If they still have to search for protocols, find markets, and check whether the asset is supported, many may stop at simply holding it.
The Theorem integration mentioned by @GearboxProtocol addresses this specific problem: when users view the mGLOBAL asset page, they can find an entry point to Gearbox's leveraged markets. This integration is now live on Ethereum.
I think its significance lies in placing the strategy entry point where users research the asset. After reviewing the as
post-image
RWA-0.39%
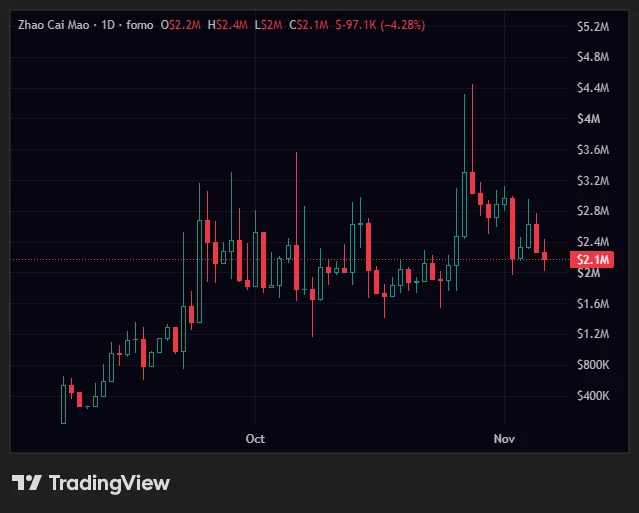
Market might not be looking its best rn, but this one keeps holding strong
With a community like this behind it, I'm not worried one bit
Taking advantage of the dip and adding more to my bag. I know what I'm holding
$招财猫 is going to retire my entire bloodline I'm so bullish on it
post-image
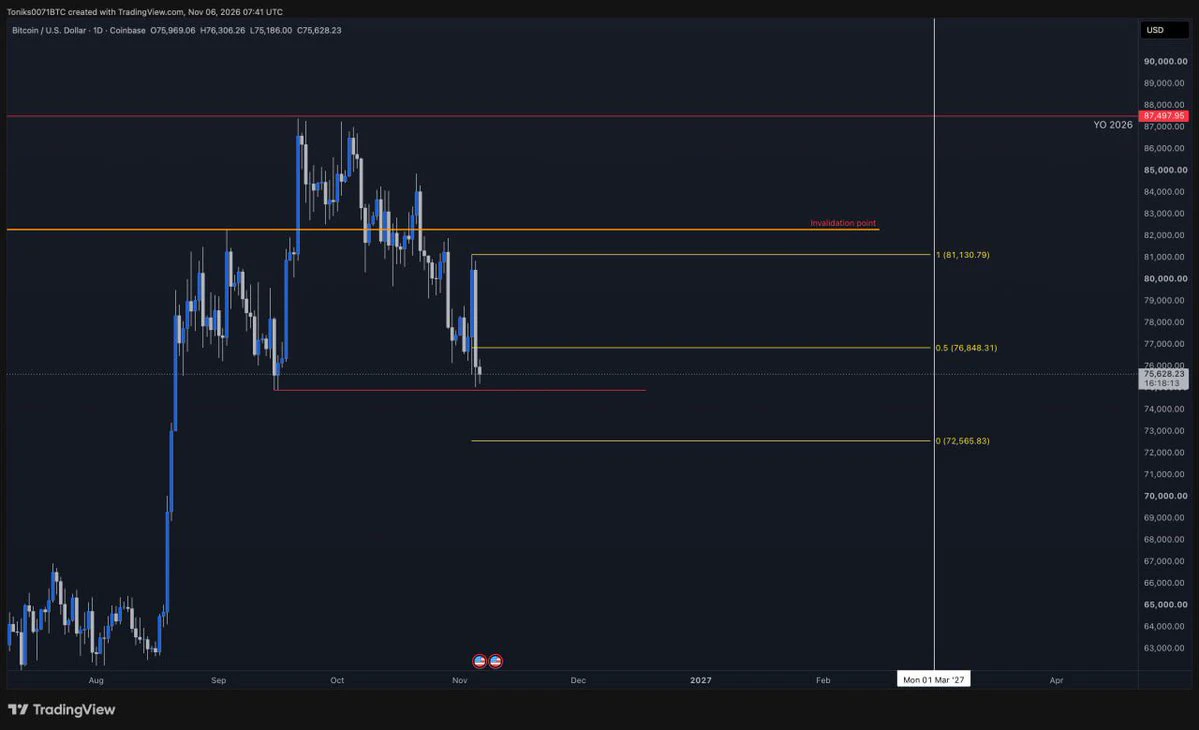
$BTC 📉
I think at this point it's much better if we dump below, take out the liquidity, and form a new range. 🌊
What I see is that Alts, especially a few of them like $INJ , didn't dump; they even stayed very strong. 💪
There will be a buying opportunity, just stay ready. 🚀
For the ones who wait to load their bag I think anything below 75k down to 70k is a MUST buy zone for #BTC and alts
#Bitcoin #Crypto #Stocks #midterms
post-image
BTC-0.67%
INJ-1.67%
Analysis new crypto coin
live-cover
LIVE2,326
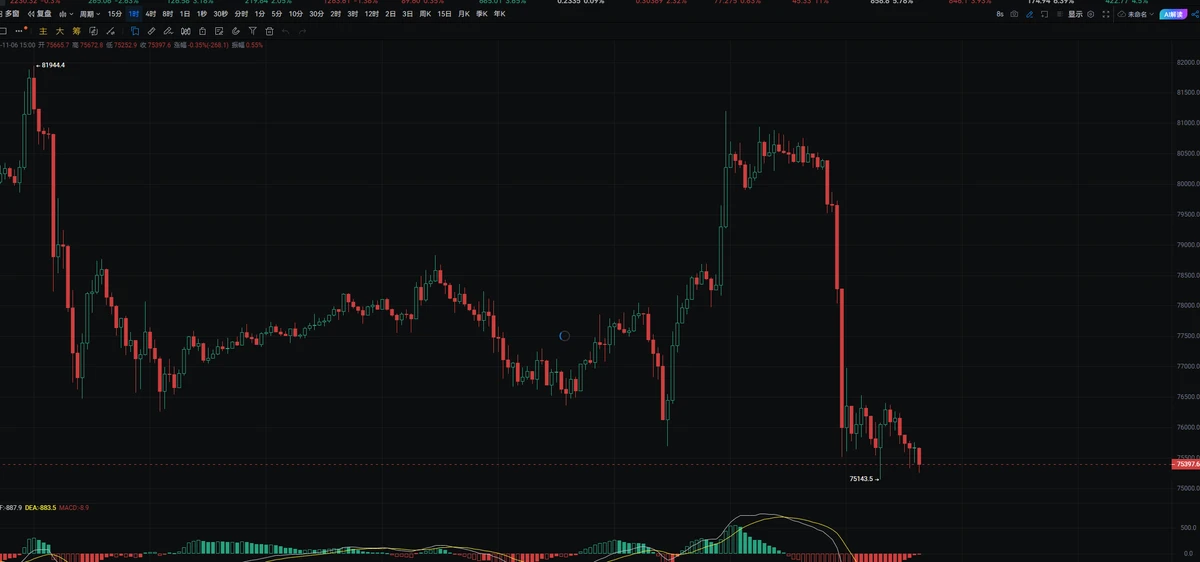
#BTC The current price is 75720. After a sharp pullback, the market is now repeatedly testing key support. The rally above 80400 was followed by a retreat, and the bulls’ attempt to rebound quickly lost momentum. After concentrated selling pressure was released, market sentiment clearly weakened, and the short-term market has entered a weak recovery phase. The first resistance above is around 78000, an area of heavy trading activity in the past and the dividing line between bulls and bears in this downturn. To regain the initiative, the price must hold above this level with a corresponding inc
post-image
BTC-0.67%
  • 5
  • 2
Judge the chart pattern for yourself. Anyway, if it stays sideways there for a while, I’d suggest going long at a slightly lower level and setting a tight stop-loss; a move up is still possible
  • 3
  • 1
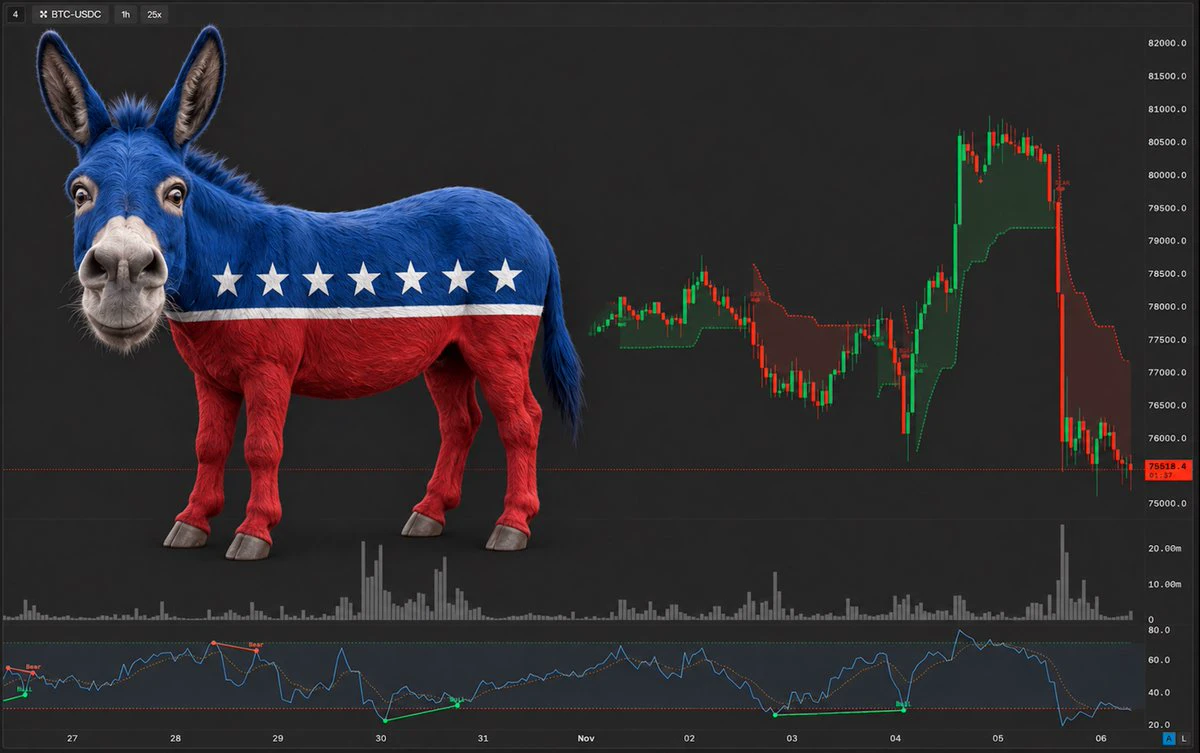
Voted for a donkey, got a bear.
post-image
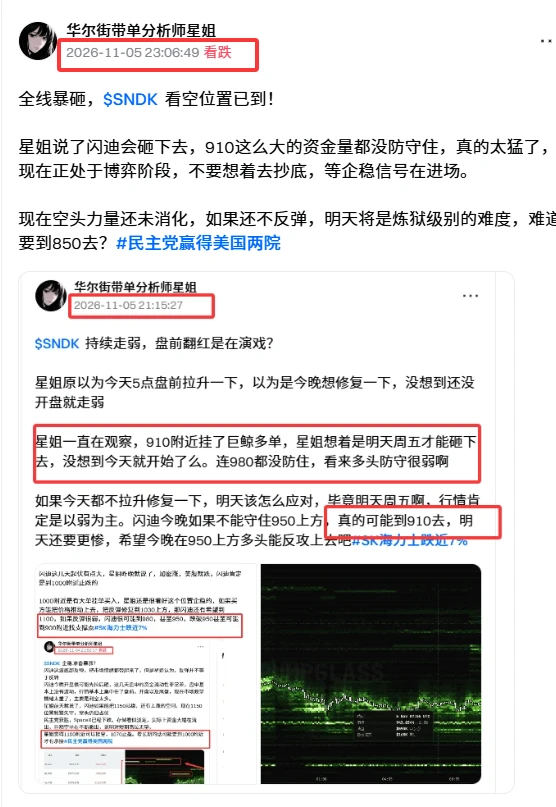
$SNDK A bottoming-out and bargain-buying opportunity? Watch out for another sell-off!

Many people have been asking Sister Xing: After last night's move, have all the bears been wiped out? Is it time to buy the dip? Don't rush.

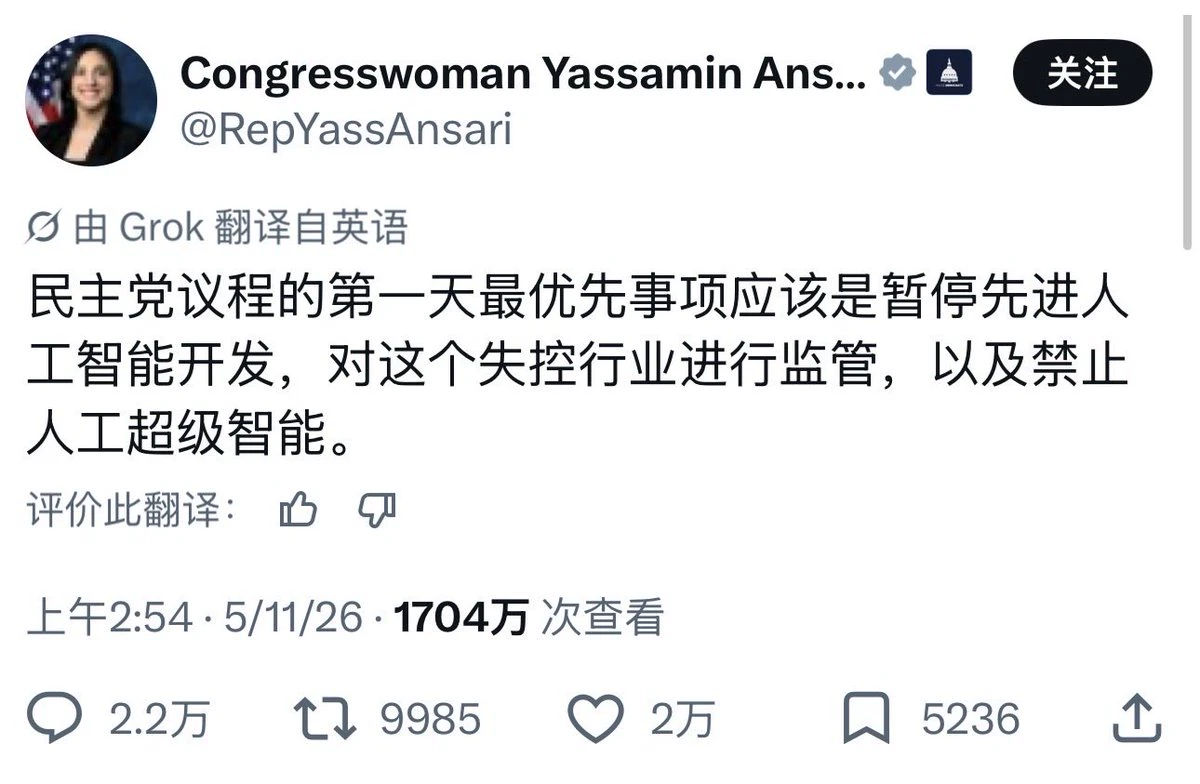
Sister Xing believes this sell-off has completely reshuffled the market. Gold and crypto had both rallied beforehand, leaving room to fall, while AI got hit hard this time. The Democrats are imposing strict regulations on AI and suppressing its gains, triggering a series of sell-offs that battered tech stocks.

It may look stable now, and SanDisk has rebounded from its
post-image
SNDK-0.18%
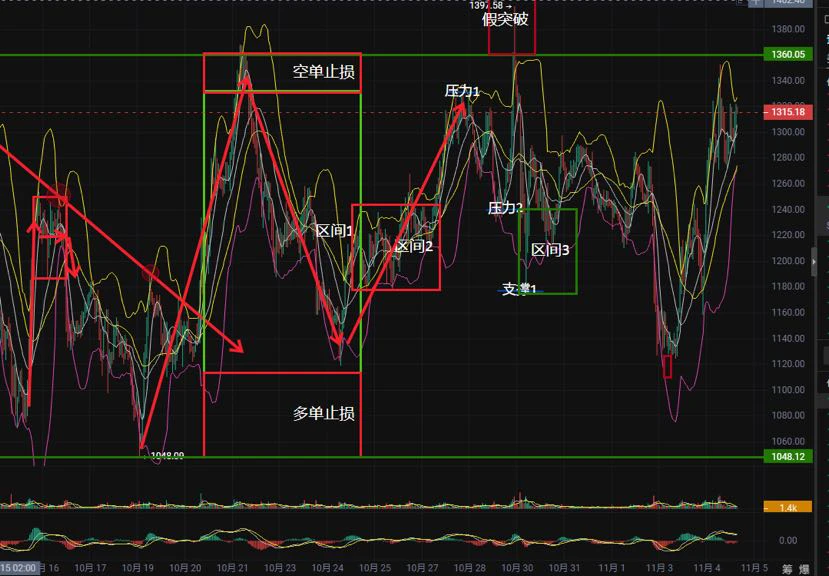
Yesterday’s 11.5 ZEC long/short strategy review (posted late)

【Trading Summary】: $ZEC
Yesterday morning, the short was entered around 1330 and closed around 1230, netting 100 points.
Mistake: Opened a short on ZEC overnight, but it rebounded to 1324 in the morning, resulting in a 45-point loss.

【Strategy Review】:
Expected it to hold around 1360 before pulling back, but it failed to break through the 1360 level.
Long idea: Entered at 1240; the second target of 1330 was hit.
Short idea invalidated.
Went with the trend and shorted overnight; it rebounded to around 1330 in the morning, resultin
AChenBit
11.5 ZEC Public Trading Strategy
【Short Setup】$ZEC
  Entry range: around 1360-1400
  Stop-loss: 1420
Take-profit tiers
  First target: 1330
  Second target: 1280
Third target: around 1240
Fourth target: below 1180

Trading factors: The current price is near the upper Bollinger Band. In the short term, it has held above all moving averages, the red bars are expanding, and bullish momentum is steady. Order book depth suggests sellers have the upper hand.

Trading suggestion: The current price is consolidating near the top of the higher-timeframe range; a small-position short can be considered.

planB
Execute if price does not reach the short entry range or falls below 1240
【Long Setup】$BTC
Entry range: around 1240
  Stop-loss: 1200
Take-profit tiers
  First target: 1280
  Second target: around 1330
Third target: 1360
Fourth target: above 1400 (bullish trend established)
#BTC重返8万
#民主党赢得美国两院
#Gate上线台股交易
repost-content-media
ZEC+1.29%
BTC-0.65%
ETH-1.23%
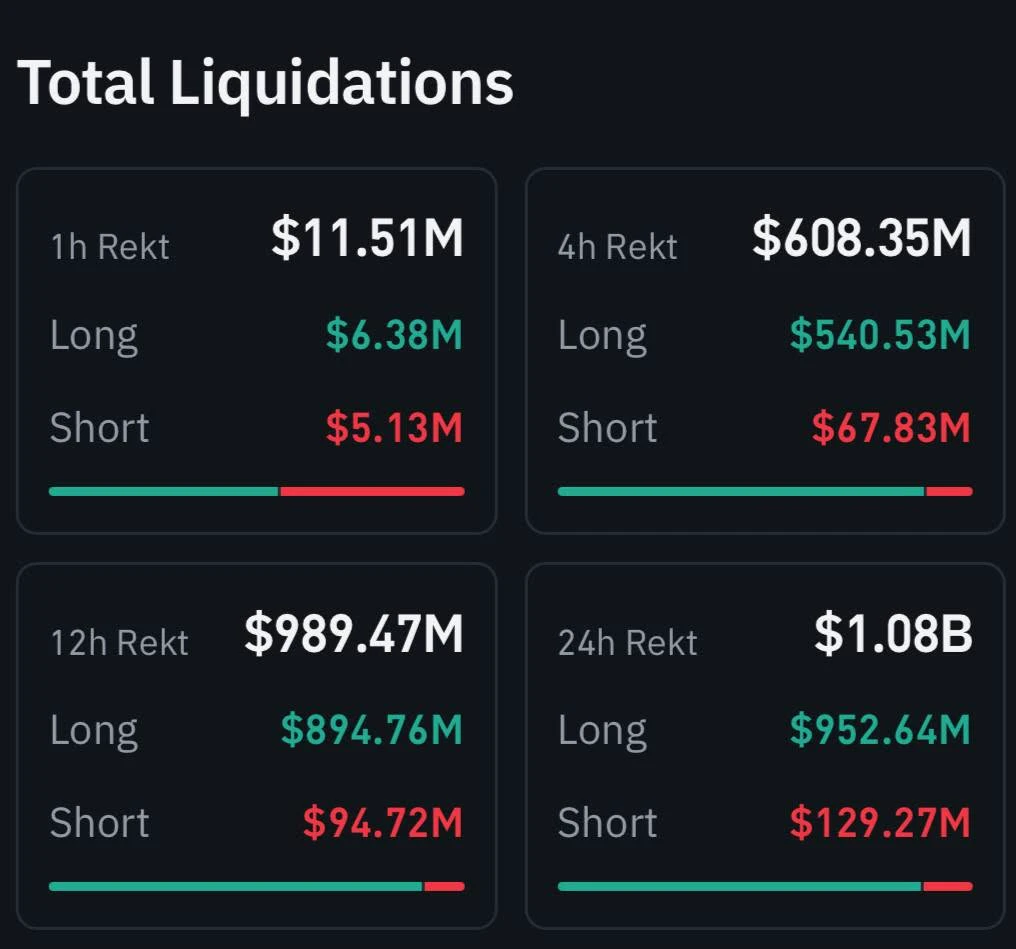
$1+ BILLION LIQUIDATION 🔴

#USStocksFaceHistoricSelloff #ShareWeekly $BTC ‌$ETH ‌$SOL ‌$MU ‌$NVDA ‌
post-image
BTC-0.65%
ETH-1.23%
SOL-0.74%
MU-17.23%
NVDA-9.33%
$ROSE JUST BOUGHT HERE
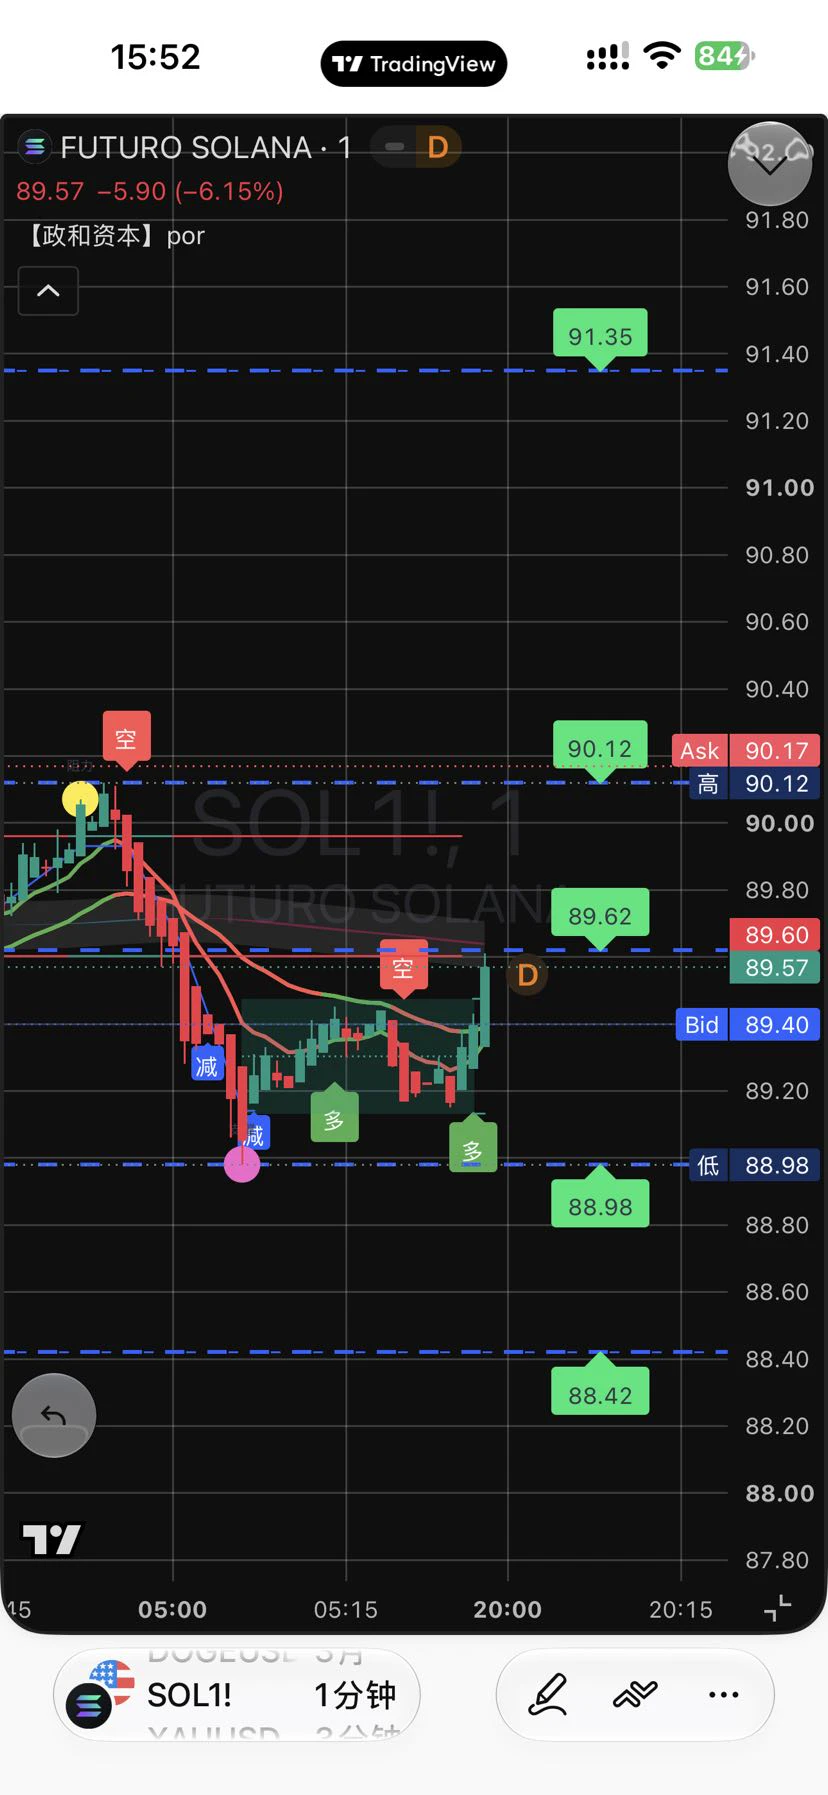
November 6, 2026 (Friday) SOL Contract Strategy for Today (based on the current range of around $89–$90)
Core view (bearish bias, cautious on bounces)
SOL has quickly fallen from around $96 to around $89, breaking recent support, with weak short-term momentum. Today, prioritize watching for a bounce to be rejected as a short opportunity, or consider going long only after a pullback to lower support; keep positions light.
Specific strategy directions
1. Shorting a bounce (primary strategy)
• Watch zone: $91.0–$93.0 (or near $94.0)
• Entry reference: If the price bounces to around $91.5–$92.5
post-image
SOL-0.74%
# How to Build a Trading Strategy Evaluation Checklist That Suits You?

Earlier, we discussed why trading strategies fail, why backtest profits do not guarantee live-trading profits, and how strategies should be adjusted when market conditions change.

But all these questions ultimately converge on a more practical one:

**What criteria should we use to decide whether a trading strategy is worth continuing to use?**

Many traders are accustomed to looking at a few straightforward numbers: returns, win rate, and maximum drawdown.

These metrics are indeed important, but looking at any one of th
post-image
Yesterday, I said $AKE looked good around $0.0026 and pointed to targets at $0.0035 → $0.0042 → $0.0050. Today, it surged straight to $0.005 and rose more than 100% from its low. 👀 is currently seeing new sell orders around $0.0052–$0.0064, but I don’t think this will suddenly turn the entire trend bearish. Some resistance is normal after a rally like this. As long as buyers continue to absorb these sell walls, I still think this $AKE rally has room to run.
post-image
AKE+6.07%
Someone on-chain made the first move.

Lookonchain spotted a trade: more than two hours ago, an address opened a 10x long position on 450,000 LINK, with $5.18 million in exposure—a clear directional bet.

At the same time, LINK was still sliding: $10.69, down 7.4% in 24 hours, ranging from $11.65 to $10.53 intraday, a swing of over ten points, with $264 million in 24-hour trading volume. Its $10.7 billion market cap ranks it fifteenth. It has fallen 23% over the past month and is now worth less than a fifth of its former peak of 52.96.

Prices are falling as someone adds leverage. The market w
post-image
2Z-3.17%
Load More

Join 40 M users in our growing community

⚡️ Join 40 M users in the crypto craze discussion

💬 Engage with your favorite top creators

👍 See what interests you

Trending Topics

USStocksFaceHistoricSelloff

4.09k Views3.64k Discussing

U.S. stocks suffered a sharp selloff on Thursday, with the Nasdaq closing down more than 5% and the Philadelphia Semiconductor Index falling over 12%. AI and chip stocks including $NVDA and $AMD were hit especially hard. Markets are reassessing AI valuations, data-center spending and future returns. Is this just short-term deleveraging, or the start of a deeper correction in the AI trade? Which sectors are you watching next?

GateLaunchesPoSECProofOfSecurity

14.32k Views591 Discussing

USNonfarmPayrolls

12.42k Views4.05k Discussing

View More